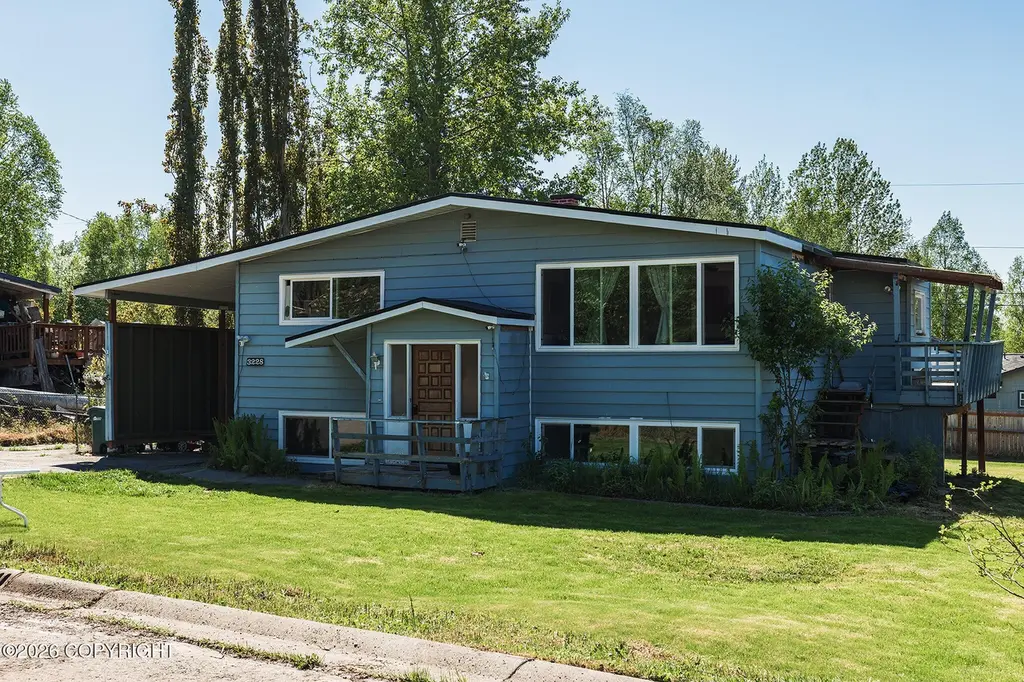
3228 Hiland Dr · Anchorage, AK
Flood risk 1/10 · Minimal
- FEMA flood zone
- X (unshaded)
- Chance of flooding over 30 yrs
- 0.0%
- Est. flood insurance / yr
- $473 – $860
Fire risk No data
- Est. fire insurance / yr
- —
Heat risk No data
- Hot days now (above threshold)
- —
- Hot days in 30 yrs
- —
Wind risk No data
- Chance of severe wind over 30 yrs
- —
Air-quality risk 1/10 · Minimal
- Unhealthy air days now
- —
- Unhealthy air days in 30 yrs
- —
Risk factors via First Street. Map © Google.
Why this score? — see what drove the D+ grade
The composite is a weighted blend of 9 inputs, each scored 0–100. Each bar is that input's sub-score; the figure is the points it added to the 100-point composite (weight × sub-score).
- ARV discount +15.0/15.0
- Cash flow +13.2/30.0
- DSCR +4.0/10.0
- Livability +3.9/5.0
- Schools +3.7/10.0
- 1% rule +3.4/10.0
- Rent growth +3.1/5.0
- Condition / age +2.5/5.0
- Appreciation +0.0/10.0
$335,000
🖨 Deal sheet (PDF) 📄 Offer letter ✓ Due diligence
Listing remarks
Affordable Scenic Foothills living! This 3BR, 2BA home sits on a spacious 1/4 acre lot with a large lawn, storage shed, sunny west facing deck, oversized RV carport, and parking for vehicles, trailers, and Alaska toys. Recent updates include the roof, many windows, and water heater. Steps from lit trails, parks, schools, shopping, and commuter routes. Opportunity and value in a prime location. Welcome to 3228 Hiland Drive, a rare opportunity to own a home on a spacious quarter acre lot in the desirable Scenic Foothills neighborhood. This 3 bedroom, 2 bath home offers over 1,600 square feet of living space, flexible living areas, and a location that puts some of East Anchorage's best outdoor
Key facts
- 0.26 acre lot
- Garage
- Built 1965
Property features AI
Exterior
- Parking: No garage; 1 covered carport space
- Utilities: Public sewer
- Home design: Residential property; Not attached; Wood frame construction; Built in 1965; Other foundation type
- Construction: Wood frame construction; Built in 1965; Other foundation
- Exterior features: Unknown roof type (listed as Unknown - BTV)
Interior
- Bedrooms: 3 bedrooms
- Bathrooms: 2 total bathrooms (1 full, 1 half)
- Interior features: CO detector(s); Smoke detector(s)
Neighborhood map
What this means for you Summary
Snapshot
- This is a 3-bed/1.5-bath single-family listed at $335k.
Deal economics
- At list price, monthly cash flow is $-5 ($-59/yr) — negative.
- To cash-flow at today's rent, offer at most $334k (0.3% below list).
- To meet the 1% rule (rent ≥ 1% of price), the offer needs to be $281k (16.2% below list).
- Recommended offer: $281k (16.2% below list) — sets the bar for 1% rule.
- Cap rate 6.3% vs local median 3.8% in Anchorage — top-decile yield for the area; either an underpriced asset or a hidden risk that comps aren't pricing in. Stress-test before assuming the spread holds.
Location & tenants
- Location reads 78/100 on livability (#6 in AK, #2,553 nationally) — a middle-class / working-renter tenant base. Strengths: amenities A+, commute A+, employment A+; Watch: crime F, cost of living F.
- Anchorage School District (urban): math 37% / reading 43% proficiency, ranked #6 of 21 in AK (top 29%) — families likely to look elsewhere, expect single-tenant / working-renter base with shorter leases.
- Zoned schools: Scenic Park Elementary (math 32% / reading 42%, grade F, #83 of 156 statewide, top 59%, 382 students, 39% FRL); Nicholas J. Begich Middle School (math 10% / reading 24%, grade F, #32 of 36 statewide, top 89%, 882 students, 78% FRL); Bartlett High School (math 22% / reading 27%, grade F, #42 of 61 statewide, top 82%, 1,373 students, 64% FRL) — zoned schools average 60% FRL vs 38% district-wide (22 pts higher); higher-poverty schools than district average — tighter screening recommended.
- Zoned-school proficiency averages 26% at this address vs 40% district-wide (-14 pts) — the specific schools serving this property underperform the Anchorage School District average; the district grade overstates school quality for this exact location.
- Market conditions: Rents rising (+2.6%/yr); 214 active listings in the ZIP; 16 comparable units currently listed for rent nearby; rentals at typical pace (median 24d on market — plan ~3-4 weeks tenant-placement turnaround); solid renter incomes; 306 units permitted in Anchorage Municipality in 2024 (90 in 5+ unit buildings).
- This rent runs 39% of the median local income ($87k/yr) — at the standard rent-burdened threshold; future hikes will face affordability resistance.
Forward outlook
- Local home prices are declining (-3.0%/yr); year-one equity from $2k of loan paydown is wiped out by about $10k of value loss. Plan a longer hold.
- Anchorage County population projected at +12% by 2050 — modest demand growth; plan on rents tracking national, not racing it.
Negotiation context
- Only 5 days on market — expect competitive offers; lowballing is unlikely to land.
- 6 sale attempts since 25y ago with the ask held roughly flat each time — persistent listings suggest the price (not the market) is what's stuck; bring a comps-based counter.
Questions for the listing agent
- What do current leases actually rent for vs. the listed asking? Can we see a recent rent roll and the last 12 months of T-12 income?
- Built in 1965 — when were the roof, HVAC, electrical panel, plumbing, and water heater last replaced?
- Is there a deadline driving the sale (1031 exchange, divorce, estate, relocation)? That informs how much negotiation room exists.
- Schools are B-rated — typically a magnet for longer-tenancy family renters. What's the average tenant stay here, and is there a school-zone premium baked into asking?
- Crime grade is F in this area — have there been break-ins, vandalism, or insurance claims at this property in the last 3 years? What carrier currently insures it and at what premium?
- The area grade is low — what's the realistic commute time and amenity access for the typical tenant pool here? Any planned neighborhood developments (good or bad) we should know about?
- What's the average days-on-market for RENTAL listings here right now (not sales)? A rising rental-DOM trend means longer vacancies and softer asking-rent achievability than the comps imply.
- What's the recent tenant-quality profile in this submarket — average credit score on applications, eviction rate, late-payment / NSF rate, and stable-employment percentage? A property-management company in the area should have these aggregated.
- How much new for-sale + rental construction is in the pipeline within 1–3 miles? Heavy new supply typically softens prices + rents 12–24 months out; constrained supply supports both.
Investment metrics
- 1% rule
- 0.84% ✗
- Cap rate
- 6.28%
- Cash-on-cash
- -0.06%
- DSCR
- 1.00
- GRM
- 9.9
CMA / ARV
- ARV (on-the-fly)
- $422,688
- Comps found
- 12
Show comp detail 12 sales within ~0.75 mi
| Address | Dist | Beds/Ba | Sqft | Sold | Price | $/sf | Match |
|---|---|---|---|---|---|---|---|
| 2550 Chandalar Dr | 0.40mi | 3/1.5 | 1,596 (-2%) | 3mo | $425,000 | $266 | 75 |
| 7017 Cape Lisburne Loop | 0.17mi | 3/2.5 | 1,467 (-10%) | 1mo | $380,000 | $259 | 70 |
| 7031 Baxter Terrace Cir | 0.16mi | 3/2.0 | 1,832 (+12%) | 1mo | $475,000 | $259 | 69 |
| 3213 Tayshee Cir | 0.33mi | 3/2.0 | 1,464 (-10%) | 4mo | $334,000 | $228 | 62 |
| 3701 James Dr | 0.37mi | 3/2.0 | 1,824 (+12%) | 1mo | $475,000 | $260 | 60 |
| 3420 Meadowbrook Cir | 0.37mi | 4/2.0 (+1) | 1,464 (-10%) | 2mo | $400,000 | $273 | 57 |
| 7725 Hennings Way | 0.37mi | 3/2.0 | 1,824 (+12%) | 7mo | $387,000 | $212 | 56 |
| 3933 Sycamore Loop | 0.63mi | 3/2.0 | 1,552 (-5%) | 8mo | $369,500 | $238 | 54 |
| 8011 Little Dipper Ave | 0.47mi | 4/2.0 (+1) | 1,824 (+12%) | 7mo | $410,000 | $225 | 45 |
| 2800 Brookridge Cir | 0.70mi | 3/2.5 | 1,796 (+10%) | 6mo | $389,900 | $217 | 42 |
| 2441 Chandalar Dr | 0.49mi | 4/2.0 (+1) | 1,849 (+13%) | 8mo | $394,900 | $214 | 42 |
| 3832 Sycamore Loop | 0.67mi | 3/2.0 | 1,422 (-13%) | 5mo | $399,900 | $281 | 40 |
Match score weights: distance 35% · size 25% · config 20% · recency 20%. Top-matched comps best support the ARV.
Projected returns pro-forma
-3.0% appreciation · 2.57% rent growth · sell at horizon
- IRR
- -16.9%
- Equity multiple
- 0.40×
- Total profit
- $-55,821
- Equity at exit
- $49,950
- IRR
- -9.5%
- Equity multiple
- 0.42×
- Total profit
- $-53,990
- Equity at exit
- $28,965
Cash invested: $93,800 (down + closing). Projections, not guarantees.
Landlord ↔ Tenant lean methodology
- Overall (STATE)
- 80 Strongly Landlord-Friendly
- State Alaska
- 80 Strongly Landlord-Friendly · R+8
- County
- — inherits STATE
- City
- — inherits STATE
ZIP-level market 99504
- Rents YoY
- 2.6%
- Active inventory
- 214
- Price-to-rent
- 9.9×
Monthly cashflow live
- Estimated rent
- $2,807 high interval (Pro) →
- Mortgage (P&I)
- −$1,757
- Tax from tax record
- −$326 /mo · $3,914/yr
- Insurance
- −$140
- HOA
- −$0
- Vacancy / Maint / Mgmt
- −$589
- Net cashflow
- $-5
Break-even live
Sensitivity live
| Price | -10% $185 | -5% $90 | +0% $-5 | +5% $-100 | +10% $-195 |
|---|---|---|---|---|---|
| Rent | -10% $-227 | -5% $-116 | +0% $-5 | +5% $106 | +10% $217 |
| Rate | -1.0pp $164 | -0.5pp $80 | base $-5 | +0.5pp $-92 | +1.0pp $-180 |
UW: 25.0% down · 7.5% · 30yr · 1.5% tax · 5.0% vac · 8.0% maint · 8.0% mgmt
Financing live
Cash to close
- Down payment
- $83,750
- Closing costs
- $10,050
- Reserves months
- —
- Total cash needed
- —
Loan-product check · same deal, 3 products live
Conventional
25% down · 7.5% · 30yr
- Down + closing
- —
- Monthly P&I
- —
- Monthly cashflow
- —
- DSCR
- —
- Eligible?
- —
Personal DTI + credit; lowest rate.
DSCR
20% down · 8.5% · 30yr
- Down + closing
- —
- Monthly P&I
- —
- Monthly cashflow
- —
- DSCR
- —
- Eligible?
- —
No personal income docs; deal must DSCR.
Hard money
10% down · 12.0% · 12mo
- Down + closing
- —
- Monthly P&I
- —
- Monthly cashflow
- —
- DSCR
- —
- Eligible?
- —
Short-term bridge; refi at stabilization.
Rent comps 16 comps
| Address | Beds | Baths | Sqft | Rent | $/sqft | DOM | Units | Dist |
|---|---|---|---|---|---|---|---|---|
| 3400 Meadowbrook Cir Anchorage, AK | 3.0 | 2.0 | 1500 | $2,350 | $1.57 | 14d | 1 | 0.35mi |
| 4011 Lunar Dr Unit A Anchorage, AK | 2.0 | 2.0 | 2000 | $2,750 | $1.38 | 24d | 1 | 0.53mi |
| 3622 Sycamore Loop Anchorage, AK | 3.0 | 2.0 | 1866 | $2,895 | $1.55 | 44d | 1 | 0.55mi |
| 3841 Sycamore Loop Anchorage, AK | 4.0 | 2.0 | 1568 | $3,000 | $1.91 | 45d | 1 | 0.65mi |
| 5971 Ridgelake Cir Anchorage, AK | 3.0 | 2.0 | 1452 | $3,000 | $2.07 | 14d | 1 | 0.89mi |
| 6131 Prosperity Dr Anchorage, AK | 3.0 | 1.5 | 1250 | $2,800 | $2.24 | 14d | 1 | 0.92mi |
| 3844 Image Dr Anchorage, AK | 4.0 | 2.0 | 1822 | $4,000 | $2.20 | 44d | 1 | 0.97mi |
| 3664 Mirage Cir Anchorage, AK | 3.0 | 3.0 | 2049 | $3,500 | $1.71 | 24d | 1 | 0.98mi |
| 6721 Foothill Dr Anchorage, AK | 4.0 | 2.0 | 1824 | $3,100 | $1.70 | 14d | 1 | 1.06mi |
| 5781 Sapphire Loop Anchorage, AK | 3.0 | 2.0 | 1443 | $2,500 | $1.73 | 44d | 1 | 1.15mi |
| 5703 Jennifer Cir Anchorage, AK | 3.0 | 1.5 | 1400 | $3,300 | $2.36 | 14d | 1 | 1.17mi |
| 1544 State St Unit C Anchorage, AK | 3.0 | 2.0 | 1664 | $2,750 | $1.65 | 24d | 1 | 1.21mi |
| 6413 E 14th Ct Unit A Anchorage, AK | 4.0 | 2.0 | 1900 | $2,475 | $1.30 | 45d | 1 | 1.30mi |
| 2230 Candy Pl Unit C Anchorage, AK | 4.0 | 3.0 | 1800 | $2,995 | $1.66 | 24d | 1 | 1.44mi |
| 2230 Candy Pl Anchorage, AK | 4.0 | 3.0 | 1800 | $2,795 | $1.55 | 14d | 1 | 1.44mi |
| 2432 Glacier St Unit A Anchorage, AK | 3.0 | 2.0 | 1388 | $2,850 | $2.05 | 24d | 1 | 1.47mi |
Listing history 6 events
-
2026-06-18days on market $335,000 Active 5 DOM
-
2026-06-17days on market $335,000 Active 4 DOM
-
2026-06-16days on market $335,000 Active 3 DOM
-
2026-06-15days on market $335,000 Active 2 DOM
-
2026-06-14remarks 699-char remark
-
2026-06-14$335,000 Active 1 DOM
ⓘ Source: listings_history table (triggers on properties + properties_extension) + one-shot
backfill from property_details.listing_events for pre-trigger history.
Tax reassessment forecast AK · Partial reset (capped growth)
- Current annual tax
- $3,914 · $326/mo
- Projected year-2 tax
- $3,950 · $329/mo
- Expected delta
- +$36/yr (+$3/mo · 0.9%)
ⓘ Screening estimate from a state-policy table — verify with the county assessor before closing.
Climate risk First Street
- Flood 1/10 Low FEMA zone X (unshaded) · 0% chance over 30 yrs
- Air quality 1/10 Low
Nearby sold comps map
Loading sold comps map…
Walkable amenities ~0.75 mi
Loading nearby amenities…
Taxation est. · year 1
- Rental income
- $33,686
- − Mortgage interest
- −$18,765
- − Property taxes
- −$3,914
- − Insurance
- −$1,675
- − Repairs & maintenance
- −$2,695
- − Management
- −$2,695
- − Depreciation
- −$9,745
- Taxable loss
- −$5,804
- Est. tax savings @ 24.0%
- +$1,393
- After-tax cash flow
- $1,334/yr
For passive investors: Depreciation is non-cash, so a rental often shows a tax loss while cash-flowing — sheltering income. Rental losses are passive: they offset passive income freely, and up to $25,000/yr can offset ordinary (W-2) income if you actively participate and your MAGI is under $100k (phasing out to $0 by $150k); unused losses carry forward. On sale, claimed depreciation is recaptured at up to 25%, and gains may owe capital-gains tax (a 1031 exchange can defer both). Figures are a year-1 estimate at your 24.0% rate — not tax advice; consult a CPA.
Schools (NCES district)
- District
- Anchorage School District
- NCES district ID
- 0200180
- Math proficiency
- 37% ▼ -2.00%
- Reading proficiency
- 43% ▲ 1.00%
- Median HH income
- $76,447
- Composite
- 37.0/100
- National rank
- #4523
- State rank
- #6 of 21 in AK
Livability — Anchorage
- Score
- 78/100
- State rank
- #6
- US rank
- #2553
Category grades
Schools grade is shown separately in the Schools card above.
Census & demographics
- Census place
- Anchorage, AK
- County
- Anchorage Borough · 246,594 people
- City population
- 218,117
- Metro
- Anchorage, AK
- Population (ZIP)
- 42,093
- Household income
- $86,710
- Rent vs Own
- Severe rent burden
- 1052.0
Population outlook (Anchorage County) Hauer SSP2
- Today (2025)
- 314,993 people
- By 2030
- 321,771 · +2.2%
- By 2040
- 335,493 · +6.5%
- By 2050
- 352,799 · +12.0%
- By 2075
- 414,771 · +31.7%
- By 2100
- 474,485 · +50.6%
Race, ethnicity, and origin ACS 2023
- Neighborhood character
- Highly diverse neighborhood (Simpson 0.80)
- Race & ethnicity
- White 41% Two or more races 18% Asian 13% Native American 9% Black 9% Hispanic / Latino 9% Pacific Islander 6%
- Hispanic origin (detail)
- Mexican 3% Puerto Rican 1%
- Common ancestry
- Portuguese 2% Ukrainian 2% Romanian 2%
- Foreign-born
- 12% · Canada, South Korea, Vietnam
- Languages at home
- 76% English-only · Other Asian/Pacific 9% Spanish 4% Tagalog/Filipino 3%
Political lean MEDSL · Anchorage
- 2024 margin
- D (+12.7) · D 56.3% · R 43.7%
- 2016→2024 swing
- +27.9pp toward D · 2016: -15.2pp · 2024: 12.7pp
- All cycles
- 2024: D+12.7 2016: R+15.2
Not yet ingested
- Civics
- —
Market trends
- HPI YoY
- ▼ -184.29%
- Current HPI
- 259.8803
- Rent YoY
- ▲ 2.57%
- Metro
- Anchorage, AK
- State GDP YoY
- —
- F500 in state
- 0
Price history
+131.0% since first listed11 events — show timeline
- 2026-06-13 Listed $335,000 AKMLS
- 2022-03-03 Sold (Public Records) — Public Records
- 2022-01-27 Pending — AKMLS
- 2022-01-18 Relisted — AKMLS
- 2022-01-12 Pending — AKMLS
- 2022-01-09 Relisted — AKMLS
- 2021-12-18 Pending — AKMLS
- 2021-12-15 Relisted — AKMLS
- 2021-09-16 Listed $275,000 AKMLS
- 2001-03-16 Listed $145,000 AKMLS
- 1991-03-22 Sold (Public Records) — Public Records
Property tax history
+1.6%/yrLatest (2025): $3,914 · +0.1% YoY. Source: county tax records.
Cash-flow waterfall
monthlySold comps — $/sqft
last 12 mo · ≤1 miLoading sold comps…