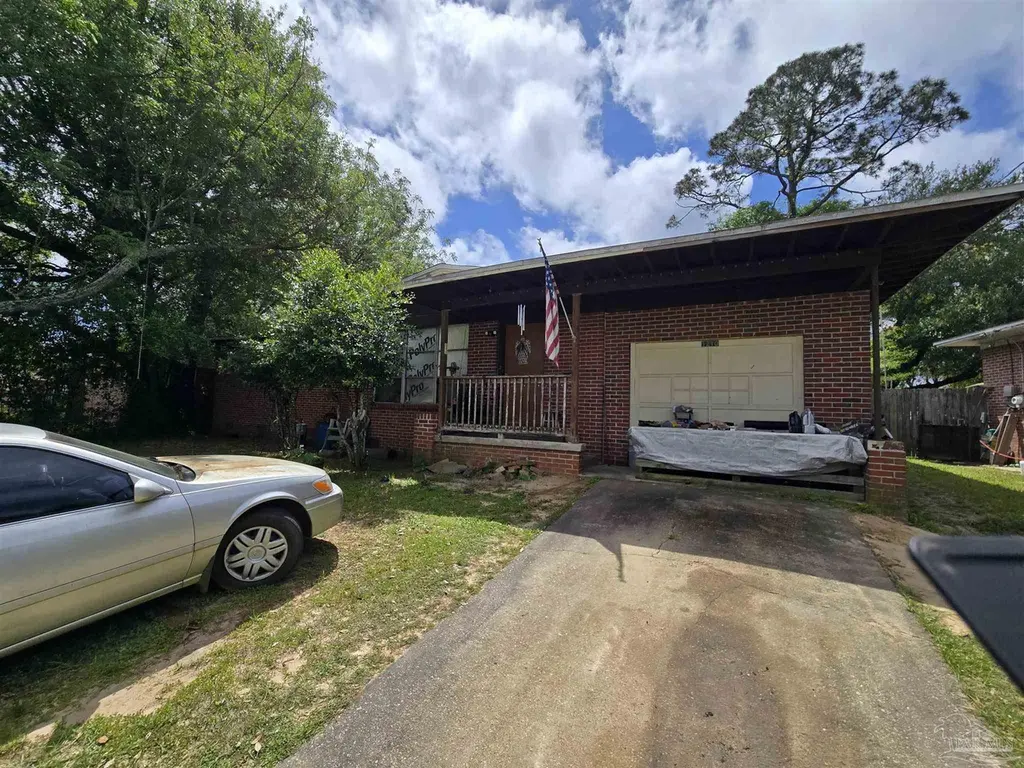
1210 Suburban Dr · West Pensacola, FL
Flood risk 1/10 · Minimal
- FEMA flood zone
- X (unshaded)
- Chance of flooding over 30 yrs
- 0.0%
- Est. flood insurance / yr
- $507 – $1,088
Fire risk 1/10 · Minimal
- Est. fire insurance / yr
- $947 – $1,759
Heat risk 10/10 · Severe
- Hot days now (above 105°F)
- 7 days/yr
- Hot days in 30 yrs
- 23 days/yr
Wind risk 9/10 · Severe
- Chance of severe wind over 30 yrs
- 99.0%
Air-quality risk 1/10 · Minimal
- Unhealthy air days now
- 0 days/yr
- Unhealthy air days in 30 yrs
- 0 days/yr
Risk factors via First Street. Map © Google.
Why this score? — see what drove the C+ grade
The composite is a weighted blend of 9 inputs, each scored 0–100. Each bar is that input's sub-score; the figure is the points it added to the 100-point composite (weight × sub-score).
- Cash flow +23.1/30.0
- ARV discount +12.8/15.0
- DSCR +7.4/10.0
- 1% rule +5.6/10.0
- Rent growth +3.7/5.0
- Schools +3.6/10.0
- Livability +3.3/5.0
- Condition / age +2.5/5.0
- Appreciation +0.0/10.0
$149,000
🖨 Deal sheet (PDF) 📄 Offer letter ✓ Due diligence
Listing remarks MLS
Great 3-bedroom 2-bath home located in the Marfair area in Pensacola. This has been a great rental. Keep it as a rental or make your own primary residence. The tenants have been here for 10 years. Big lot, on high ground, needs TLC.
Key facts
- 8,276 sq ft lot
- Garage
- Built 1959
Neighborhood map
What this means for you Summary
Snapshot
- This is a 3-bed/2.0-bath single-family listed at $149k.
Deal economics
- At list price, monthly cash flow is $268 ($3k/yr) — positive.
- The deal already cash-flows at list — no discount required.
- Meets the 1% rule at list price ($2k rent vs $149k).
- Recommended offer: $140k (6.0% below list) — sets the bar for market timing.
Location & tenants
- Location reads 66/100 on livability (#629 in FL) — a middle-class / working-renter tenant base. Strengths: cost of living A+, housing A+, health & safety B+; Watch: crime D, schools F, amenities F.
- Escambia (suburban): math 40% / reading 45% proficiency, ranked #56 of 73 in FL (top 77%) — families likely to look elsewhere, expect single-tenant / working-renter base with shorter leases.
- Market conditions: Rents rising fast (+4.9%/yr); 198 active listings in the ZIP; 19 comparable units currently listed for rent nearby; rentals at typical pace (median 24d on market — plan ~3-4 weeks tenant-placement turnaround); lower-income renter base — watch delinquency; 1,479 units permitted in Escambia County in 2024 (0 in 5+ unit buildings).
- This rent runs 42% of the median local income ($45k/yr) — at the standard rent-burdened threshold; future hikes will face affordability resistance.
Forward outlook
- Local home prices are declining (-3.0%/yr); year-one equity from $1k of loan paydown is wiped out by about $4k of value loss. Plan a longer hold.
- Escambia County population projected at +13% by 2050 — modest demand growth; plan on rents tracking national, not racing it.
- At projected returns (-3.0% appreciation + 4.9% rent growth), your $42k cash investment doubles in ~10 years — after that, you're playing with house money.
Negotiation context
- It's been on market 65 days — a 6% lower offer ($140k) is reasonable based on typical stale-listing flexibility.
- 3 sale attempts since 21y ago with the ask held roughly flat each time — persistent listings suggest the price (not the market) is what's stuck; bring a comps-based counter.
- Current owner paid $35k; list at $149k implies a 326% gain — meaningful room to come down on a strong offer.
Risks & watch-outs
- Watch-outs: built in 1959 — expect roof / HVAC / electrical / plumbing capex.
- Climate carrying-cost: severe wind risk, 99% chance of damaging wind over 30y; extreme-heat days projected 7→23/yr by 2055 (HVAC capex compounding) — expect insurance premiums to compound above CPI over the hold.
Questions for the listing agent
- It's been on market 65 days. Have you received any prior offers? Is the seller open to a 6% concession, seller financing, or rate buy-down credit?
- Built in 1959 — when were the roof, HVAC, electrical panel, plumbing, and water heater last replaced?
- Why hasn't it sold? Are there any deal-killer items the seller is aware of (foundation, flood, title, zoning, code violations)?
- Is there a deadline driving the sale (1031 exchange, divorce, estate, relocation)? That informs how much negotiation room exists.
- Schools are F-rated, which usually means shorter tenancies and higher turnover. Who's the typical renter profile here, and what's been the actual vacancy rate?
- Crime grade is D in this area — have there been break-ins, vandalism, or insurance claims at this property in the last 3 years? What carrier currently insures it and at what premium?
- What's the average days-on-market for RENTAL listings here right now (not sales)? A rising rental-DOM trend means longer vacancies and softer asking-rent achievability than the comps imply.
- What's the recent tenant-quality profile in this submarket — average credit score on applications, eviction rate, late-payment / NSF rate, and stable-employment percentage? A property-management company in the area should have these aggregated.
- How much new for-sale + rental construction is in the pipeline within 1–3 miles? Heavy new supply typically softens prices + rents 12–24 months out; constrained supply supports both.
Investment metrics
- 1% rule
- 1.06% ✓
- Cap rate
- 8.45%
- Cash-on-cash
- 7.70%
- DSCR
- 1.34
- GRM
- 7.8
CMA / ARV
- ARV (median comp)
- $169,033
- List price
- $149,000
- Delta
- -11.85%
- Verdict
- UNDERPRICED
- Comps
- 20 within 1.0 mi
Show comp detail 12 sales within ~0.75 mi
| Address | Dist | Beds/Ba | Sqft | Sold | Price | $/sf | Match |
|---|---|---|---|---|---|---|---|
| 117 Aquamarine Ave | 0.53mi | 3/1.0 | 1,243 (-2%) | 1mo | $82,500 | $66 | 68 |
| 1102 Revere Dr | 0.32mi | 3/1.5 | 1,396 (+10%) | 1mo | $95,000 | $68 | 64 |
| 923 S Madison Dr | 0.36mi | 4/2.0 (+1) | 1,368 (+8%) | 2mo | $180,000 | $132 | 62 |
| 1012 Edison Dr | 0.17mi | 2/1.5 (-1) | 1,391 (+10%) | 8mo | $175,000 | $126 | 61 |
| 10 Tennessee Dr | 0.67mi | 3/2.0 | 1,318 (+4%) | 1mo | $260,000 | $197 | 61 |
| 832 S Madison Dr | 0.41mi | 4/1.0 (+1) | 1,290 (+2%) | 9mo | $131,000 | $102 | 61 |
| 1026 Northview Dr | 0.19mi | 3/1.5 | 1,422 (+13%) | 10mo | $203,000 | $143 | 60 |
| 305 N Madison Dr | 0.46mi | 4/2.0 (+1) | 1,373 (+9%) | 1mo | $200,000 | $146 | 58 |
| 6 Georgia Dr | 0.62mi | 4/2.0 (+1) | 1,206 (-4%) | 3mo | $157,000 | $130 | 56 |
| 203 Opal Ave | 0.42mi | 3/1.0 | 1,412 (+12%) | 9mo | $80,000 | $57 | 49 |
| 4404 Ellysee Way | 0.64mi | 3/2.0 | 1,435 (+14%) | 2mo | $239,900 | $167 | 46 |
| 4512 Havre Way | 0.72mi | 3/2.0 | 1,380 (+9%) | 8mo | $72,800 | $53 | 44 |
Match score weights: distance 35% · size 25% · config 20% · recency 20%. Top-matched comps best support the ARV.
Projected returns pro-forma
-3.0% appreciation · 4.92% rent growth · sell at horizon
- IRR
- -2.5%
- Equity multiple
- 0.90×
- Total profit
- $-3,980
- Equity at exit
- $22,216
- IRR
- 9.1%
- Equity multiple
- 1.76×
- Total profit
- $31,777
- Equity at exit
- $12,883
Cash invested: $41,720 (down + closing). Projections, not guarantees.
Landlord ↔ Tenant lean methodology
- Overall (STATE)
- 87 Strongly Landlord-Friendly
- State Florida
- 87 Strongly Landlord-Friendly · R+3
- County
- — inherits STATE
- City
- — inherits STATE
ZIP-level market 32505
- Home prices YoY
- -26.5%
- Rents YoY
- 4.9%
- Active inventory
- 198
- Price-to-rent
- 7.8×
Monthly cashflow live
- Estimated rent
- $1,583 high interval (Pro) →
- Mortgage (P&I)
- −$781
- Tax from tax record
- −$140 /mo · $1,677/yr
- Insurance
- −$62
- HOA
- −$0
- Vacancy / Maint / Mgmt
- −$333
- Net cashflow
- $268
Break-even live
Sensitivity live
| Price | -10% $352 | -5% $310 | +0% $268 | +5% $226 | +10% $183 |
|---|---|---|---|---|---|
| Rent | -10% $143 | -5% $205 | +0% $268 | +5% $330 | +10% $393 |
| Rate | -1.0pp $343 | -0.5pp $306 | base $268 | +0.5pp $229 | +1.0pp $190 |
UW: 25.0% down · 7.5% · 30yr · 1.5% tax · 5.0% vac · 8.0% maint · 8.0% mgmt
Financing live
Cash to close
- Down payment
- $37,250
- Closing costs
- $4,470
- Reserves months
- —
- Total cash needed
- —
Loan-product check · same deal, 3 products live
Conventional
25% down · 7.5% · 30yr
- Down + closing
- —
- Monthly P&I
- —
- Monthly cashflow
- —
- DSCR
- —
- Eligible?
- —
Personal DTI + credit; lowest rate.
DSCR
20% down · 8.5% · 30yr
- Down + closing
- —
- Monthly P&I
- —
- Monthly cashflow
- —
- DSCR
- —
- Eligible?
- —
No personal income docs; deal must DSCR.
Hard money
10% down · 12.0% · 12mo
- Down + closing
- —
- Monthly P&I
- —
- Monthly cashflow
- —
- DSCR
- —
- Eligible?
- —
Short-term bridge; refi at stabilization.
Rent comps 19 comps
| Address | Beds | Baths | Sqft | Rent | $/sqft | DOM | Units | Dist |
|---|---|---|---|---|---|---|---|---|
| 707 New York Dr Pensacola, FL | 2.0 | 1.0 | 1266 | $1,185 | $0.94 | 24d | 1 | 0.38mi |
| 221 Edison Dr Pensacola, FL | 3.0 | 1.0 | 1500 | $1,598 | $1.07 | 24d | 1 | 0.60mi |
| 3296 Two Sisters Way Pensacola, FL | 4.0 | 2.5 | 1856 | $1,795 | $0.97 | 24d | 1 | 0.78mi |
| 3417 W Fisher St Unit C Pensacola, FL | 3.0 | 2.0 | 1106 | $1,350 | $1.22 | 24d | 1 | 0.81mi |
| 3216 Two Sisters Way Pensacola, FL | 3.0 | 2.0 | 1117 | $1,700 | $1.52 | 24d | 1 | 0.88mi |
| 3418 Luke St Pensacola, FL | 4.0 | 2.0 | 1620 | $1,800 | $1.11 | 24d | 1 | 0.89mi |
| 918 Montclair Rd Pensacola, FL | 3.0 | 1.0 | 1012 | $1,500 | $1.48 | 14d | 1 | 1.01mi |
| 2303 W Michigan Ave Unit A6 Pensacola, FL | 2.0 | 2.0 | 1014 | $1,300 | $1.28 | 24d | 1 | 1.08mi |
| 2301 W Michigan Ave #21 Pensacola, FL | 2.0 | 2.5 | 1164 | $1,325 | $1.14 | 24d | 1 | 1.08mi |
| 101 Vanderbilt Rd Pensacola, FL | 3.0 | 2.0 | 1104 | $1,850 | $1.68 | 22d | 1 | 1.11mi |
| 918 Fremont Ave Pensacola, FL | 3.0 | 1.0 | 1756 | $1,450 | $0.83 | 14d | 1 | 1.17mi |
| 5602 W Shore Dr Unit B Pensacola, FL | 2.0 | 2.0 | 920 | $1,250 | $1.36 | 24d | 1 | 1.19mi |
| 2355 W Michigan Ave Pensacola, FL | 1.0–2.0 | 1.0–2.0 | 850 | $1,450 | $1.71 | 14d | 9 | 1.22mi |
| 902 Lucerne Ave Pensacola, FL | 3.0 | 2.0 | 1276 | $1,600 | $1.25 | 24d | 1 | 1.22mi |
| 2300 W Michigan Ave #12 Pensacola, FL | 2.0 | 2.0 | 1050 | $1,300 | $1.24 | 24d | 1 | 1.27mi |
| 2702 Massachusetts Ave Pensacola, FL | 1.0–3.0 | 1.0–2.5 | 1150 | $1,745 | $1.52 | 14d | 9 | 1.28mi |
| 1860 Broyhill Ln Pensacola, FL | 3.0 | 2.0 | 1561 | $1,600 | $1.02 | 24d | 1 | 1.31mi |
| 5180 Burlington Ave Pensacola, FL | 3.0 | 2.0 | 1184 | $1,650 | $1.39 | 24d | 1 | 1.41mi |
| 925 Twinbrook Ave Pensacola, FL | 3.0 | 1.0 | 1105 | $1,750 | $1.58 | 24d | 1 | 1.49mi |
Listing history 20 events
-
2026-06-18days on market $149,000 Active 65 DOM
-
2026-06-17days on market $149,000 Active 64 DOM
-
2026-06-16days on market $149,000 Active 63 DOM
-
2026-06-15days on market $149,000 Active 62 DOM
-
2026-06-14days on market $149,000 Active 60 DOM
-
2026-06-10days on market $149,000 Active 57 DOM
-
2026-06-09days on market $149,000 Active 56 DOM
-
2026-06-08days on market $149,000 Active 55 DOM
-
2026-06-07days on market $149,000 Active 54 DOM
-
2026-06-03days on market $149,000 Active 50 DOM
-
2026-06-02days on market $149,000 Active 49 DOM
-
2026-06-01days on market $149,000 Active 48 DOM
-
2026-05-31days on market $149,000 Active 47 DOM
-
2026-05-31days on market $149,000 Active 46 DOM
-
2026-04-14$149,000 Active 232-char remark
Show marketing remark (232 chars)
Great 3-bedroom 2-bath home located in the Marfair area in Pensacola. This has been a great rental. Keep it as a rental or make your own primary residence. The tenants have been here for 10 years. Big lot, on high ground, needs TLC.
-
2015-12-16soldstatus $35,000 344-char remark
Show marketing remark (344 chars)
Cute brick home in the Mayfair subdivision. Home features a large living room with hardwood flooring that leads to a formal dining room and kitchen with a stove and oven. The home also features a one car garage with laundry area. Sliding glass doors in the dining room lead out to a nice sized fenced backyard. Hurry! This home won't last long!
-
2015-10-13$36,000 344-char remark
Show marketing remark (344 chars)
Cute brick home in the Mayfair subdivision. Home features a large living room with hardwood flooring that leads to a formal dining room and kitchen with a stove and oven. The home also features a one car garage with laundry area. Sliding glass doors in the dining room lead out to a nice sized fenced backyard. Hurry! This home won't last long!
-
2006-02-24soldstatus $96,500
-
2006-02-15soldstatus $96,500
-
2005-08-25$99,500
ⓘ Source: listings_history table (triggers on properties + properties_extension) + one-shot
backfill from property_details.listing_events for pre-trigger history.
Tax reassessment forecast FL · Resets to sale price
- Current annual tax
- $1,677 · $140/mo
- Projected year-2 tax
- $1,677 · $140/mo
- Expected delta
- $0/yr ($0/mo · 0.0%)
ⓘ Screening estimate from a state-policy table — verify with the county assessor before closing.
Climate risk First Street
- Flood 1/10 Low FEMA zone X (unshaded) · 0% chance over 30 yrs
- Wildfire 1/10 Low
- Heat 10/10 Extreme 7 d/yr ≥105°F today · 23 d/yr by 30 yrs out
- Wind 9/10 Extreme 99% chance of damaging wind over 30 yrs
- Air quality 1/10 Low 0 unhealthy d/yr today · 0 by 30 yrs out
Nearby sold comps map
Loading sold comps map…
Walkable amenities ~0.75 mi
Loading nearby amenities…
Taxation est. · year 1
- Rental income
- $19,001
- − Mortgage interest
- −$8,346
- − Property taxes
- −$1,677
- − Insurance
- −$745
- − Repairs & maintenance
- −$1,520
- − Management
- −$1,520
- − Depreciation
- −$4,335
- Taxable income
- $858
- Est. tax owed @ 24.0%
- −$206
- After-tax cash flow
- $3,007/yr
For passive investors: Depreciation is non-cash, so a rental often shows a tax loss while cash-flowing — sheltering income. Rental losses are passive: they offset passive income freely, and up to $25,000/yr can offset ordinary (W-2) income if you actively participate and your MAGI is under $100k (phasing out to $0 by $150k); unused losses carry forward. On sale, claimed depreciation is recaptured at up to 25%, and gains may owe capital-gains tax (a 1031 exchange can defer both). Figures are a year-1 estimate at your 24.0% rate — not tax advice; consult a CPA.
Schools (NCES district)
- District
- Escambia
- NCES district ID
- 1200510
- Math proficiency
- 40% ▼ -9.00%
- Reading proficiency
- 45% ▼ -4.00%
- Median HH income
- $44,649
- Composite
- 36.04/100
- National rank
- #4773
- State rank
- #56 of 73 in FL
Livability — West Pensacola
- Score
- 66/100
- State rank
- #629
- US rank
- #12275
Category grades
Schools grade is shown separately in the Schools card above.
Census & demographics
- Census place
- West Pensacola, FL
- County
- Escambia County · 301,722 people
- Metro
- Pensacola-Ferry Pass-Brent, FL
- Population (ZIP)
- 27,877
- Household income
- $44,783
- Rent vs Own
- Severe rent burden
- 1458.0
Population outlook (Escambia County) Hauer SSP2
- Today (2025)
- 334,637 people
- By 2030
- 345,779 · +3.3%
- By 2040
- 364,828 · +9.0%
- By 2050
- 378,514 · +13.1%
- By 2075
- 403,220 · +20.5%
- By 2100
- 386,125 · +15.4%
Race, ethnicity, and origin ACS 2023
- Neighborhood character
- Diverse neighborhood (Simpson 0.66)
- Race & ethnicity
- Black 48% White 32% Hispanic / Latino 11% Two or more races 9% Asian 2%
- Hispanic origin (detail)
- Mexican 5% Cuban 2%
- Common ancestry
- Slovak 2% Italian 1% Serbian 1%
- Foreign-born
- 9% · Canada, Vietnam
- Languages at home
- 87% English-only · Spanish 9% Other Indo-European 1% Vietnamese 1%
Political lean MEDSL · Escambia
- 2024 margin
- R (+19.5) · D 39.7% · R 59.2% · Other 1.1%
- 2008→2024 swing
- -0.2pp no change · 2008: -19.3pp · 2024: -19.5pp
- All cycles
- 2024: R+19.5 2020: R+15.1 2016: R+20.6 2012: R+20.6 2008: R+19.3
Not yet ingested
- Civics
- —
Market trends
- HPI YoY
- ▼ -74.10%
- Current HPI
- 205.45
- Rent YoY
- ▲ 4.92%
- Metro
- Pensacola-Ferry Pass-Brent, FL
- State GDP YoY
- ▲ 3.28%
- F500 in state
- 36
Industry mix (Fortune 500 HQ in FL)
| Industry | F500 HQs | Revenue |
|---|---|---|
| Industrial Technology | 2 | $29B |
|
||
| Insurance | 2 | $17B |
|
||
| Retail | 1 | $60B |
|
||
| Technology Distribution | 1 | $58B |
|
||
| Homebuilding | 1 | $35B |
|
||
| Technology Manufacturing | 1 | $35B |
|
||
Price history
+49.7% since first listed6 events — show timeline
- 2026-04-14 Listed $149,000 PARMLS
- 2015-12-16 Sold (MLS) $35,000 PARMLS
- 2015-10-13 Listed $36,000 PARMLS
- 2006-02-24 Sold (Public Records) $96,500 Public Records
- 2006-02-15 Sold (MLS) $96,500 PARMLS
- 2005-08-25 Listed $99,500 PARMLS
Property tax history
+8.0%/yrLatest (2025): $1,677 · +18.8% YoY. Source: county tax records.
Cash-flow waterfall
monthlySold comps — $/sqft
last 12 mo · ≤1 miLoading sold comps…