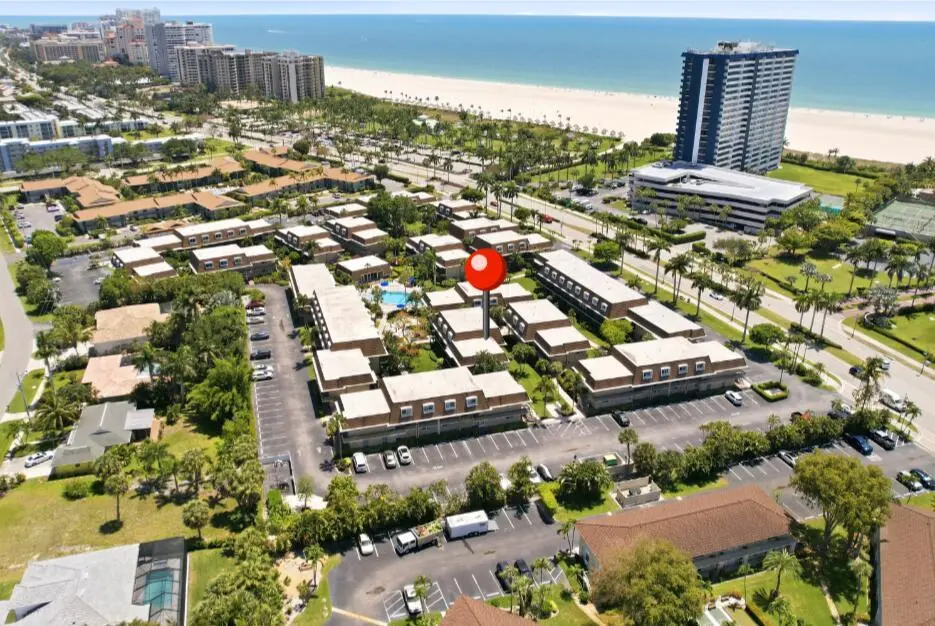
87 N Collier Blvd Unit N2 · Marco Island, FL
Flood risk 9/10 · Severe
- FEMA flood zone
- AE
- Chance of flooding over 30 yrs
- 0.99%
- Est. flood insurance / yr
- $1,737 – $8,500
Fire risk 4/10 · Minor
- Est. fire insurance / yr
- $947 – $1,759
Heat risk 10/10 · Severe
- Hot days now (above 107°F)
- 7 days/yr
- Hot days in 30 yrs
- 28 days/yr
Wind risk 10/10 · Severe
- Chance of severe wind over 30 yrs
- 99.0%
Air-quality risk 3/10 · Minor
- Unhealthy air days now
- 3 days/yr
- Unhealthy air days in 30 yrs
- 3 days/yr
Risk factors via First Street. Map © Google.
Why this score? — see what drove the D+ grade
The composite is a weighted blend of 9 inputs, each scored 0–100. Each bar is that input's sub-score; the figure is the points it added to the 100-point composite (weight × sub-score).
- Cash flow +13.3/30.0
- ARV discount +7.5/15.0
- 1% rule +6.0/10.0
- Schools +5.0/10.0
- Rent growth +4.1/5.0
- DSCR +4.0/10.0
- Livability +3.6/5.0
- Condition / age +2.5/5.0
- Appreciation +0.0/10.0
$249,900
🖨 Deal sheet (PDF) 📄 Offer letter ✓ Due diligence
Listing remarks MLS
ACROSS THE STREET FROM RESIDENTS BEACH!! New Tile Flooring throughout in 2016, Newer Furniture, Queen Sleeper Couch, 2 New AC units; one in 2017 & one in 2019, New Water Heater in 2014, New Bathroom Vanity in 2016. The Island Manor Community has Many New Updates including New Roofs, New Screen Enclosures, Fresh Paint, and New Underground Plumbing. All assessments have been paid.
Key facts
- Gulf access
- Community pool
- Built 1973
Tags
Property features AI
Finance
- HOA & community: Community amenities: Bike path, Bike storage, Clubhouse, Pool, Shuffleboard court
Exterior
- Parking: No garage
- Home design: One-story; 540 living area
- Construction: Built-up roof
- Exterior features: Private pool; Impact doors and impact sliding windows; Built-up roof
Interior
- Kitchen: Microwave, Range, Refrigerator
- Bedrooms: 1 bedroom
- Flooring: Concrete; Tile
- Bathrooms: 1 full bathroom
- Heating & cooling: No central heating; Wall cooling units; Ceiling fan(s)
- Interior features: Microwave, Range, Refrigerator; Impact doors and impact sliding windows; Ceiling fan(s)
Neighborhood map
What this means for you Summary
Snapshot
- This is a 1-bed/1.0-bath condo listed at $250k.
Deal economics
- At list price, monthly cash flow is $-426 ($-5k/yr) — negative.
- The deal already cash-flows at list — no discount required.
- Meets the 1% rule at list price ($3k rent vs $250k).
- Recommended offer: $242k (3.0% below list) — sets the bar for market timing.
Location & tenants
- Location reads 71/100 on livability (#404 in FL) — a middle-class / working-renter tenant base. Strengths: crime A+, employment A+, health & safety A+; Watch: amenities F, commute F, cost of living F.
- Collier (suburban): math 60% / reading 56% proficiency, ranked #16 of 73 in FL (top 22%) — acceptable for families but not a draw, mixed tenant base, ~2y average lease.
- Zoned schools: Tommie Barfield Elementary School (math 84% / reading 75%, grade A, #116 of 2,144 statewide, top 6%, 464 students, 30% FRL); Manatee Middle School (math 61% / reading 43%, grade C+, #217 of 571 statewide, top 40%, 749 students, 64% FRL); Lely High School (math 40% / reading 39%, grade F, #304 of 667 statewide, top 47%, 1,504 students, 54% FRL).
- Market conditions: Rents rising fast (+6.6%/yr); 689 active listings in the ZIP; 9 comparable units currently listed for rent nearby; rentals at typical pace (median 25d on market — plan ~3-4 weeks tenant-placement turnaround); solid renter incomes; 3,520 units permitted in Collier County in 2024 (959 in 5+ unit buildings).
- This rent runs 32% of the median local income ($102k/yr) — at the standard rent-burdened threshold; future hikes will face affordability resistance.
Forward outlook
- Local home prices are declining (-3.0%/yr); year-one equity from $2k of loan paydown is wiped out by about $7k of value loss. Plan a longer hold.
- Collier County population projected at +30% by 2050 — long-run rental-demand tailwind backs the buy-and-hold thesis.
Negotiation context
- It's been on market 33 days — a 3% lower offer ($242k) is reasonable based on typical stale-listing flexibility.
- 5 sale attempts since 10y ago with the ask held roughly flat each time — persistent listings suggest the price (not the market) is what's stuck; bring a comps-based counter.
- Current owner paid $175k; 43% above their basis — modest negotiation headroom, anchor on the comps not their cost.
Risks & watch-outs
- Watch-outs: flood insurance adds $427/mo; HOA is 21% of rent.
- Climate carrying-cost: in FEMA flood zone AE (mandatory federal flood insurance); severe wind risk, 99% chance of damaging wind over 30y; extreme-heat days projected 7→28/yr by 2055 (HVAC capex compounding) — expect insurance premiums to compound above CPI over the hold.
Questions for the listing agent
- What do current leases actually rent for vs. the listed asking? Can we see a recent rent roll and the last 12 months of T-12 income?
- It's been on market 33 days. Have you received any prior offers? Is the seller open to a 3% concession, seller financing, or rate buy-down credit?
- Built in 1973 — when were the roof, HVAC, electrical panel, plumbing, and water heater last replaced?
- What's the actual annual flood-insurance premium (NFIP or private), and is the property in a SFHA with mandatory coverage?
- What does the HOA fee cover, when was the last increase, and are there any pending special assessments or reserve-fund shortfalls?
- Any open or pending special assessments — roof, HVAC, plumbing, elevator, façade? What's the per-unit balance and payoff schedule, and is the seller paying it off at close or rolling it to the buyer?
- Is there a deadline driving the sale (1031 exchange, divorce, estate, relocation)? That informs how much negotiation room exists.
- Schools are A-rated — typically a magnet for longer-tenancy family renters. What's the average tenant stay here, and is there a school-zone premium baked into asking?
- The area grade is low — what's the realistic commute time and amenity access for the typical tenant pool here? Any planned neighborhood developments (good or bad) we should know about?
- What's the average days-on-market for RENTAL listings here right now (not sales)? A rising rental-DOM trend means longer vacancies and softer asking-rent achievability than the comps imply.
- What's the recent tenant-quality profile in this submarket — average credit score on applications, eviction rate, late-payment / NSF rate, and stable-employment percentage? A property-management company in the area should have these aggregated.
- How much new apartment / multifamily construction is in the pipeline within 1–3 miles? Heavy new supply (>2% of stock underway) typically softens rents 12–24 months out; light construction supports rent growth.
Investment metrics
- 1% rule
- 1.10% ✓
- Cap rate
- 6.30%
- Cash-on-cash
- 0.01%
- DSCR
- 1.00
- GRM
- 7.6
CMA / ARV
No comps found within radius.
Projected returns pro-forma
-3.0% appreciation · 6.59% rent growth · sell at horizon
- IRR
- -22.5%
- Equity multiple
- 0.19×
- Total profit
- $-56,792
- Equity at exit
- $37,261
- IRR
- -6.6%
- Equity multiple
- 0.48×
- Total profit
- $-36,729
- Equity at exit
- $21,607
Cash invested: $69,972 (down + closing). Projections, not guarantees.
Landlord ↔ Tenant lean methodology
- Overall (STATE)
- 87 Strongly Landlord-Friendly
- State Florida
- 87 Strongly Landlord-Friendly · R+3
- County
- — inherits STATE
- City
- — inherits STATE
ZIP-level market 34145
- Rents YoY
- 6.6%
- Active inventory
- 689
- Price-to-rent
- 7.6×
Monthly cashflow live
- Estimated rent
- $2,742 high interval (Pro) →
- Mortgage (P&I)
- −$1,311
- Tax from tax record
- −$177 /mo · $2,120/yr
- Insurance
- −$104
- Flood insurance flood zone
- −$427 /mo · $5,118/yr
- HOA est. from 2 same-building comps
- −$574
- Vacancy / Maint / Mgmt
- −$576
- Net cashflow
- $-426
Break-even live
Sensitivity live
| Price | -10% $-285 | -5% $-355 | +0% $-426 | +5% $-497 | +10% $-567 |
|---|---|---|---|---|---|
| Rent | -10% $-643 | -5% $-534 | +0% $-426 | +5% $-318 | +10% $-209 |
| Rate | -1.0pp $-300 | -0.5pp $-362 | base $-426 | +0.5pp $-491 | +1.0pp $-557 |
UW: 25.0% down · 7.5% · 30yr · 1.5% tax · 5.0% vac · 8.0% maint · 8.0% mgmt
Financing live
Cash to close
- Down payment
- $62,475
- Closing costs
- $7,497
- Reserves months
- —
- Total cash needed
- —
Loan-product check · same deal, 3 products live
Conventional
25% down · 7.5% · 30yr
- Down + closing
- —
- Monthly P&I
- —
- Monthly cashflow
- —
- DSCR
- —
- Eligible?
- —
Personal DTI + credit; lowest rate.
DSCR
20% down · 8.5% · 30yr
- Down + closing
- —
- Monthly P&I
- —
- Monthly cashflow
- —
- DSCR
- —
- Eligible?
- —
No personal income docs; deal must DSCR.
Hard money
10% down · 12.0% · 12mo
- Down + closing
- —
- Monthly P&I
- —
- Monthly cashflow
- —
- DSCR
- —
- Eligible?
- —
Short-term bridge; refi at stabilization.
Rent comps 9 comps
| Address | Beds | Baths | Sqft | Rent | $/sqft | DOM | Units | Dist |
|---|---|---|---|---|---|---|---|---|
| 87 N Collier Blvd Marco Island, FL | 1.0–2.0 | 1.0–1.5 | 663 | $1,800 | $2.71 | 25d | 3 | 0.02mi |
| 130 N Collier Blvd Unit A6 Marco Island, FL | 2.0 | 1.0 | 704 | $1,900 | $2.70 | 25d | 1 | 0.15mi |
| 167 N Collier Blvd Marco Island, FL | 2.0 | 1.0 | 555 | $1,850 | $3.33 | 15d | 2 | 0.18mi |
| 140 Seaview Ct #1504 Marco Island, FL | 1.0 | 1.5 | 610 | $2,200 | $3.61 | 25d | 1 | 0.22mi |
| 190 N Collier Blvd Unit T2 Marco Island, FL | 1.0 | 1.0 | 508 | $1,800 | $3.54 | 25d | 1 | 0.26mi |
| 180 Seaview Ct Marco Island, FL | 1.0–2.0 | 1.5–2.0 | 721 | $3,450 | $4.78 | 25d | 2 | 0.29mi |
| 235 Seaview Ct Unit G8 Marco Island, FL | — | 1.0 | 406 | $1,850 | $4.56 | 25d | 1 | 0.39mi |
| 240 Seaview Ct #413 Marco Island, FL | 1.0 | 1.0 | 750 | $6,500 | $8.67 | 25d | 1 | 0.41mi |
| 457 Tallwood St #106 Marco Island, FL | 1.0 | 1.0 | 539 | $1,600 | $2.97 | 25d | 1 | 0.98mi |
HOA detail condo
- Monthly dues
- $0 · $0/yr
- Likely covers
- water
- Assessments
- None detected in remarks — confirm with the listing agent.
Listing history 33 events
-
2026-06-21days on market $249,900 Active 33 DOM
-
2026-06-18days on market $249,900 Active 30 DOM
-
2026-06-17days on market $249,900 Active 29 DOM
-
2026-06-16days on market $249,900 Active 28 DOM
-
2026-06-15days on market $249,900 Active 27 DOM
-
2026-06-14days on market $249,900 Active 25 DOM
-
2026-06-10days on market $249,900 Active 22 DOM
-
2026-06-09days on market $249,900 Active 21 DOM
-
2026-06-08days on market $249,900 Active 20 DOM
-
2026-06-07days on market $249,900 Active 19 DOM
-
2026-06-03days on market $249,900 Active 15 DOM
-
2026-06-02days on market $249,900 Active 14 DOM
-
2026-06-01days on market $249,900 Active 13 DOM
-
2026-05-31days on market $249,900 Active 12 DOM
-
2026-05-30days on market $249,900 Active 11 DOM
-
2026-05-19status Active
-
2026-05-12$249,900 Active
-
2021-04-08soldstatus $175,000
-
2021-03-12soldstatus $175,000 Sold 387-char remark
Show marketing remark (385 chars)
ACROSS THE STREET FROM RESIDENTS BEACH!! New Tile Flooring throughout in 2016, Newer Furniture, Queen Sleeper Couch, 2 New AC units; one in 2017 & one in 2019, New Water Heater in 2014, New Bathroom Vanity in 2016. The Island Manor Community has Many New Updates including New Roofs, New Screen Enclosures, Fresh Paint, and New Underground Plumbing. All assessments have been paid.
-
2021-03-12soldstatus $175,000 Closed 385-char remark
Show marketing remark (385 chars)
ACROSS THE STREET FROM RESIDENTS BEACH!! New Tile Flooring throughout in 2016, Newer Furniture, Queen Sleeper Couch, 2 New AC units; one in 2017 & one in 2019, New Water Heater in 2014, New Bathroom Vanity in 2016. The Island Manor Community has Many New Updates including New Roofs, New Screen Enclosures, Fresh Paint, and New Underground Plumbing. All assessments have been paid.
-
2021-02-02status Pending With Contingencies 387-char remark
Show marketing remark (385 chars)
ACROSS THE STREET FROM RESIDENTS BEACH!! New Tile Flooring throughout in 2016, Newer Furniture, Queen Sleeper Couch, 2 New AC units; one in 2017 & one in 2019, New Water Heater in 2014, New Bathroom Vanity in 2016. The Island Manor Community has Many New Updates including New Roofs, New Screen Enclosures, Fresh Paint, and New Underground Plumbing. All assessments have been paid.
-
2021-02-02historical 385-char remark
Show marketing remark (385 chars)
ACROSS THE STREET FROM RESIDENTS BEACH!! New Tile Flooring throughout in 2016, Newer Furniture, Queen Sleeper Couch, 2 New AC units; one in 2017 & one in 2019, New Water Heater in 2014, New Bathroom Vanity in 2016. The Island Manor Community has Many New Updates including New Roofs, New Screen Enclosures, Fresh Paint, and New Underground Plumbing. All assessments have been paid.
-
2021-02-01$175,000 Active 387-char remark
Show marketing remark (387 chars)
ACROSS THE STREET FROM RESIDENTS BEACH!! New Tile Flooring throughout in 2016, Newer Furniture, Queen Sleeper Couch, 2 New AC units; one in 2017 & one in 2019, New Water Heater in 2014, New Bathroom Vanity in 2016. The Island Manor Community has Many New Updates including New Roofs, New Screen Enclosures, Fresh Paint, and New Underground Plumbing. All assessments have been paid.
-
2021-01-28$175,000 385-char remark
Show marketing remark (385 chars)
ACROSS THE STREET FROM RESIDENTS BEACH!! New Tile Flooring throughout in 2016, Newer Furniture, Queen Sleeper Couch, 2 New AC units; one in 2017 & one in 2019, New Water Heater in 2014, New Bathroom Vanity in 2016. The Island Manor Community has Many New Updates including New Roofs, New Screen Enclosures, Fresh Paint, and New Underground Plumbing. All assessments have been paid.
-
2016-10-13soldstatus $135,000
-
2016-10-09price $135,000
-
2016-10-07soldstatus $135,000 Sold
-
2016-10-04price $145,000
-
2016-08-04status Pending With Contingencies
-
2016-07-24$145,000 Active
-
2015-02-26soldstatus $117,900
-
2001-04-27soldstatus $99,500
-
1998-07-06soldstatus $68,700
ⓘ Source: listings_history table (triggers on properties + properties_extension) + one-shot
backfill from property_details.listing_events for pre-trigger history.
Tax reassessment forecast FL · Resets to sale price
- Current annual tax
- $2,120 · $177/mo
- Projected year-2 tax
- $2,120 · $177/mo
- Expected delta
- $0/yr ($0/mo · 0.0%)
ⓘ Screening estimate from a state-policy table — verify with the county assessor before closing.
Climate risk First Street
- Flood 9/10 Extreme FEMA zone AE · 99% chance over 30 yrs
- Wildfire 4/10 Moderate
- Heat 10/10 Extreme 7 d/yr ≥107°F today · 28 d/yr by 30 yrs out
- Wind 10/10 Extreme 99% chance of damaging wind over 30 yrs
- Air quality 3/10 Moderate 3 unhealthy d/yr today · 3 by 30 yrs out
Nearby sold comps map
Loading sold comps map…
Walkable amenities ~0.75 mi
Loading nearby amenities…
Taxation est. · year 1
- Rental income
- $32,899
- − Mortgage interest
- −$13,998
- − Property taxes
- −$2,120
- − Insurance
- −$6,368
- − Repairs & maintenance
- −$2,632
- − Management
- −$2,632
- − HOA
- −$6,888
- − Depreciation
- −$7,270
- Taxable loss
- −$9,009
- Est. tax savings @ 24.0%
- +$2,162
- After-tax cash flow
- $-2,950/yr
For passive investors: Depreciation is non-cash, so a rental often shows a tax loss while cash-flowing — sheltering income. Rental losses are passive: they offset passive income freely, and up to $25,000/yr can offset ordinary (W-2) income if you actively participate and your MAGI is under $100k (phasing out to $0 by $150k); unused losses carry forward. On sale, claimed depreciation is recaptured at up to 25%, and gains may owe capital-gains tax (a 1031 exchange can defer both). Figures are a year-1 estimate at your 24.0% rate — not tax advice; consult a CPA.
Schools (NCES district)
- District
- Collier
- NCES district ID
- 1200330
- Math proficiency
- 60% ▼ -4.00%
- Reading proficiency
- 56% ▼ -2.00%
- Median HH income
- $58,275
- Composite
- 50.23/100
- National rank
- #1892
- State rank
- #16 of 73 in FL
Livability — Marco Island
- Score
- 71/100
- State rank
- #404
- US rank
- #7149
Category grades
Schools grade is shown separately in the Schools card above.
Census & demographics
- Census place
- Marco Island, FL
- County
- Collier County · 396,295 people
- City population
- 16,205
- Metro
- Naples-Marco Island, FL
- Population (ZIP)
- 16,205
- Household income
- $101,523
- Rent vs Own
- Severe rent burden
- 314.0
Population outlook (Collier County) Hauer SSP2
- Today (2025)
- 420,858 people
- By 2030
- 450,054 · +6.9%
- By 2040
- 502,232 · +19.3%
- By 2050
- 544,932 · +29.5%
- By 2075
- 627,203 · +49.0%
- By 2100
- 659,015 · +56.6%
Race, ethnicity, and origin ACS 2023
- Neighborhood character
- Predominantly White (90%)
- Race & ethnicity
- White 90% Hispanic / Latino 7% Two or more races 6%
- Hispanic origin (detail)
- Mexican 1% Puerto Rican 1% Cuban 2%
- Common ancestry
- Romanian 5% Lithuanian 2% Slovak 2%
- Foreign-born
- 9% · Canada
- Languages at home
- 90% English-only · Spanish 5% Other Indo-European 1% German/W. Germanic 1%
Political lean MEDSL · Collier
- 2024 margin
- Solid R (+33.1) · D 33.1% · R 66.2%
- 2008→2024 swing
- -10.6pp toward R · 2008: -22.5pp · 2024: -33.1pp
- All cycles
- 2024: R+33.1 2020: R+24.7 2016: R+26.0 2012: R+30.1 2008: R+22.5
Not yet ingested
- Civics
- —
Market trends
- HPI YoY
- ▼ -374.55%
- Current HPI
- 284.7538
- Rent YoY
- ▲ 6.59%
- Metro
- Naples-Marco Island, FL
- State GDP YoY
- ▲ 3.28%
- F500 in state
- 36
Industry mix (Fortune 500 HQ in FL)
| Industry | F500 HQs | Revenue |
|---|---|---|
| Industrial Technology | 2 | $29B |
|
||
| Insurance | 2 | $17B |
|
||
| Retail | 1 | $60B |
|
||
| Technology Distribution | 1 | $58B |
|
||
| Homebuilding | 1 | $35B |
|
||
| Technology Manufacturing | 1 | $35B |
|
||
Price history
+263.8% since first listed18 events — show timeline
- 2026-05-19 Relisted — MIML
- 2026-05-12 Listed $249,900 MIML
- 2021-04-08 Sold (Public Records) $175,000 Public Records
- 2021-03-12 Sold (MLS) $175,000 MIML
- 2021-03-12 Sold (MLS) $175,000 NAPLESMLS
- 2021-02-02 Pending — NAPLESMLS
- 2021-02-02 Delisted — MIML
- 2021-02-01 Listed $175,000 NAPLESMLS
- 2021-01-28 Listed $175,000 MIML
- 2016-10-13 Sold (Public Records) $135,000 Public Records
- 2016-10-09 Price Changed $135,000 NAPLESMLS
- 2016-10-07 Sold (MLS) $135,000 NAPLESMLS
- 2016-10-04 Price Changed $145,000 NAPLESMLS
- 2016-08-04 Pending — NAPLESMLS
- 2016-07-24 Listed $145,000 NAPLESMLS
- 2015-02-26 Sold (Public Records) $117,900 Public Records
- 2001-04-27 Sold (Public Records) $99,500 Public Records
- 1998-07-06 Sold (Public Records) $68,700 Public Records
Property tax history
+7.6%/yrLatest (2025): $2,120 · -0.4% YoY. Source: county tax records.
Cash-flow waterfall
monthlySold comps — $/sqft
last 12 mo · ≤1 miLoading sold comps…