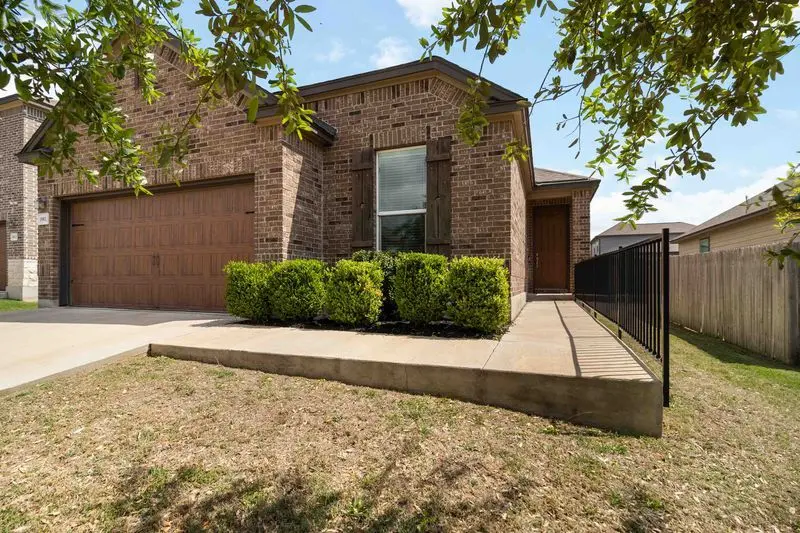
1911 Prickly Pear Dr · Bastrop, TX
Flood risk 1/10 · Minimal
- FEMA flood zone
- X (unshaded)
- Chance of flooding over 30 yrs
- 0.0%
- Est. flood insurance / yr
- $507 – $1,088
Fire risk 5/10 · Moderate
- Est. fire insurance / yr
- $1,222 – $2,270
Heat risk 8/10 · Major
- Hot days now (above 109°F)
- 7 days/yr
- Hot days in 30 yrs
- 23 days/yr
Wind risk 8/10 · Major
- Chance of severe wind over 30 yrs
- 80.0%
Air-quality risk 1/10 · Minimal
- Unhealthy air days now
- 0 days/yr
- Unhealthy air days in 30 yrs
- 0 days/yr
Risk factors via First Street. Map © Google.
Why this score? — see what drove the D+ grade
The composite is a weighted blend of 9 inputs, each scored 0–100. Each bar is that input's sub-score; the figure is the points it added to the 100-point composite (weight × sub-score).
- Cash flow +15.4/30.0
- ARV discount +14.2/15.0
- 1% rule +4.9/10.0
- DSCR +4.7/10.0
- Livability +3.1/5.0
- Condition / age +2.5/5.0
- Schools +2.4/10.0
- Rent growth +2.0/5.0
- Appreciation +0.0/10.0
$295,000
🖨 Deal sheet 📄 Offer letter ✓ Due diligence
Listing remarks MLS
Welcome to this charming 4 Bedroom, 2 Bathroom home featuring a thoughtfully designed floor plan perfect for everyday living and entertaining. The open-Concept layout creates a seamless flow between the living, dining, and kitchen areas, making the home feel spacious and inviting. The kitchen is the heart of the home, complete with a center island with breakfast bar, ideal for casual meals, gatherings or morning coffee. The primary suite offers a private retreat with its own en-suite bathroom, providing comfort and convenience. Located in a great neighborhood in the heart of downtown Bastrop, you'll enjoy easy access to local shops, dining and everything this vibrant community has to offer. Don't miss this opportunity to own a beautiful home in a prime location.
Key facts
- En suite bathroom
- Great neighborhood
- Easy access
Tags
Neighborhood map
What this means for you Summary
Snapshot
- This is a 4-bed/2.0-bath single-family listed at $295k.
Deal economics
- At list price, monthly cash flow is $115 ($1k/yr) — positive.
- The deal already cash-flows at list — no discount required.
- To meet the 1% rule (rent ≥ 1% of price), the offer needs to be $293k (0.6% below list).
- Recommended offer: $277k (6.0% below list) — sets the bar for market timing.
- Cap rate 6.8% vs local median 3.2% in Bastrop — top-decile yield for the area; either an underpriced asset or a hidden risk that comps aren't pricing in. Stress-test before assuming the spread holds.
Location & tenants
- Location reads 62/100 on livability (#947 in TX) — a middle-class / working-renter tenant base. Strengths: housing A+, cost of living A; Watch: amenities D, employment D, crime F.
- Bastrop ISD (rural): math 25% / reading 28% proficiency, ranked #670 of 826 in TX (top 81%) — low school quality limits family demand, transient renter base, plan for 1-2y turnover; 62% free/reduced lunch — lower-income household profile, screen leases tightly.
- Market conditions: Rents soft (-2.0%/yr); 1068 active listings in the ZIP; 10 comparable units currently listed for rent nearby; rentals at typical pace (median 24d on market — plan ~3-4 weeks tenant-placement turnaround); 40% of comp listings sitting > 30 days — soft ceiling on asking rent; solid renter incomes; 1,841 units permitted in Bastrop County in 2024 (150 in 5+ unit buildings).
- This rent runs 39% of the median local income ($90k/yr) — at the standard rent-burdened threshold; future hikes will face affordability resistance.
Forward outlook
- Local home prices are declining (-3.0%/yr); year-one equity from $2k of loan paydown is wiped out by about $9k of value loss. Plan a longer hold.
- Bastrop County population projected at +37% by 2050 — long-run rental-demand tailwind backs the buy-and-hold thesis.
Negotiation context
- It's been on market 83 days — a 6% lower offer ($277k) is reasonable based on typical stale-listing flexibility.
- 3 sale attempts since 7y ago with the ask held roughly flat each time — persistent listings suggest the price (not the market) is what's stuck; bring a comps-based counter.
Risks & watch-outs
- Climate carrying-cost: severe wind risk, 80% chance of damaging wind over 30y; moderate wildfire risk; extreme-heat days projected 7→23/yr by 2055 (HVAC capex compounding) — expect insurance premiums to compound above CPI over the hold.
Questions for the listing agent
- It's been on market 83 days. Have you received any prior offers? Is the seller open to a 6% concession, seller financing, or rate buy-down credit?
- What does the HOA fee cover, when was the last increase, and are there any pending special assessments or reserve-fund shortfalls?
- Why hasn't it sold? Are there any deal-killer items the seller is aware of (foundation, flood, title, zoning, code violations)?
- Is there a deadline driving the sale (1031 exchange, divorce, estate, relocation)? That informs how much negotiation room exists.
- Crime grade is F in this area — have there been break-ins, vandalism, or insurance claims at this property in the last 3 years? What carrier currently insures it and at what premium?
- The area grade is low — what's the realistic commute time and amenity access for the typical tenant pool here? Any planned neighborhood developments (good or bad) we should know about?
- What's the average days-on-market for RENTAL listings here right now (not sales)? A rising rental-DOM trend means longer vacancies and softer asking-rent achievability than the comps imply.
- What's the recent tenant-quality profile in this submarket — average credit score on applications, eviction rate, late-payment / NSF rate, and stable-employment percentage? A property-management company in the area should have these aggregated.
- How much new for-sale + rental construction is in the pipeline within 1–3 miles? Heavy new supply typically softens prices + rents 12–24 months out; constrained supply supports both.
Investment metrics
- 1% rule
- 0.99% ✗
- Cap rate
- 6.76%
- Cash-on-cash
- 1.66%
- DSCR
- 1.07
- GRM
- 8.4
CMA / ARV
- ARV (median comp)
- $346,888
- List price
- $295,000
- Delta
- -14.96%
- Verdict
- UNDERPRICED
- Comps
- 20 within 1.0 mi
Show comp detail 10 sales within ~0.75 mi
| Address | Dist | Beds/Ba | Sqft | Sold | Price | $/sf | Match |
|---|---|---|---|---|---|---|---|
| 1928 Dragonfly Loop | 0.10mi | 4/2.0 | 1,724 (+2%) | 5mo | $289,000 | $168 | 89 |
| 505 Magnolia St | 0.39mi | 4/2.5 | 1,695 (-0%) | 10mo | $264,990 | $156 | 72 |
| 412 Persimmon St | 0.19mi | 3/2.0 (-1) | 1,500 (-12%) | 4mo | $335,900 | $224 | 64 |
| 410 Juniper St | 0.19mi | 3/2.0 (-1) | 1,574 (-7%) | 16mo | $177,000 | $112 | 61 |
| 402 Laurel St | 0.14mi | 3/2.0 (-1) | 1,479 (-13%) | 8mo | $299,000 | $202 | 61 |
| 1710 Garfield St | 0.27mi | 3/2.0 (-1) | 1,583 (-7%) | 15mo | $395,000 | $250 | 58 |
| 604 Wilhelm St | 0.36mi | 3/2.0 (-1) | 1,475 (-13%) | 3mo | $398,000 | $270 | 54 |
| 2415 Wilson St | 0.51mi | 3/2.5 (-1) | 1,840 (+8%) | 1mo | $338,000 | $184 | 54 |
| 1804 Hill St | 0.69mi | 4/2.0 | 1,527 (-10%) | 7mo | $349,000 | $229 | 45 |
| 705 Laurel St N | 0.43mi | 3/2.0 (-1) | 1,472 (-13%) | 17mo | $265,000 | $180 | 39 |
Match score weights: distance 35% · size 25% · config 20% · recency 20%. Top-matched comps best support the ARV.
Projected returns pro-forma
-3.0% appreciation · 0.0% rent growth · sell at horizon
- IRR
- -17.3%
- Equity multiple
- 0.41×
- Total profit
- $-48,954
- Equity at exit
- $43,985
- IRR
- -16.9%
- Equity multiple
- 0.20×
- Total profit
- $-65,854
- Equity at exit
- $25,506
Cash invested: $82,600 (down + closing). Projections, not guarantees.
Landlord ↔ Tenant lean methodology
- Overall (STATE)
- 87 Strongly Landlord-Friendly
- State Texas
- 87 Strongly Landlord-Friendly · R+5
- County
- — inherits STATE
- City
- — inherits STATE
ZIP-level market 78602
- Home prices YoY
- -23.0%
- Rents YoY
- -2.0%
- Active inventory
- 1068
- Price-to-rent
- 8.4×
Monthly cashflow live
- Estimated rent
- $2,932 high interval (Pro) →
- Mortgage (P&I)
- −$1,547
- Tax from tax record
- −$507 /mo · $6,084/yr
- Insurance
- −$123
- HOA
- −$25
- Vacancy / Maint / Mgmt
- −$616
- Net cashflow
- $115
Break-even live
UW: 25.0% down · 7.5% · 30yr · 1.5% tax · 5.0% vac · 8.0% maint · 8.0% mgmt
Financing live
Cash to close
- Down payment
- $73,750
- Closing costs
- $8,850
- Reserves months
- —
- Total cash needed
- —
Loan-product check · same deal, 3 products live
Conventional
25% down · 7.5% · 30yr
- Down + closing
- —
- Monthly P&I
- —
- Monthly cashflow
- —
- DSCR
- —
- Eligible?
- —
Personal DTI + credit; lowest rate.
DSCR
20% down · 8.5% · 30yr
- Down + closing
- —
- Monthly P&I
- —
- Monthly cashflow
- —
- DSCR
- —
- Eligible?
- —
No personal income docs; deal must DSCR.
Hard money
10% down · 12.0% · 12mo
- Down + closing
- —
- Monthly P&I
- —
- Monthly cashflow
- —
- DSCR
- —
- Eligible?
- —
Short-term bridge; refi at stabilization.
Rent comps 10 comps
| Address | Beds | Baths | Sqft | Rent | $/sqft | DOM | Units | Dist |
|---|---|---|---|---|---|---|---|---|
| 1921 Dragonfly Loop Unit NA Bastrop, TX | 3.0 | 2.0 | 1491 | $3,395 | $2.28 | 44d | 1 | 0.09mi |
| 1921 Dragonfly Loop Bastrop, TX | 3.0 | 2.0 | 1491 | $3,395 | $2.28 | 24d | 1 | 0.09mi |
| 805 Laurel St Bastrop, TX | 3.0 | 1.0 | 1110 | $1,550 | $1.40 | 24d | 1 | 0.53mi |
| 2305 Main St Bastrop, TX | 3.0 | 1.0 | 1100 | $1,500 | $1.36 | 3d | 1 | 0.57mi |
| 223 Nicole Way Bastrop, TX | 3.0 | 2.0 | 1318 | $1,800 | $1.37 | 4d | 1 | 0.88mi |
| 1510 Elm St Bastrop, TX | 3.0 | 2.0 | 1212 | $1,650 | $1.36 | 44d | 1 | 1.07mi |
| 114 Clear Water Pass Bastrop, TX | 3.0 | 2.0 | 1716 | $2,200 | $1.28 | 15d | 1 | 1.38mi |
| 117 Calm Water Loop Bastrop, TX | 3.0 | 2.5 | 1400 | $1,750 | $1.25 | 44d | 1 | 1.39mi |
| 131 Trailstone Dr Bastrop, TX | 3.0 | 2.0 | 1450 | $1,850 | $1.28 | 24d | 1 | 1.49mi |
| 131 Trailstone Dr Bastrop, TX | 3.0 | 2.0 | 1450 | $1,850 | $1.28 | 44d | 1 | 1.49mi |
HOA detail
- Monthly dues
- $25 · $300/yr
Listing history 23 events
-
2026-06-18days on market $295,000 Active 83 DOM
-
2026-06-17days on market $295,000 Active 82 DOM
-
2026-06-16days on market $295,000 Active 81 DOM
-
2026-06-15days on market $295,000 Active 80 DOM
-
2026-06-13days on market $295,000 Active 78 DOM
-
2026-06-09days on market $295,000 Active 74 DOM
-
2026-06-08days on market $295,000 Active 73 DOM
-
2026-06-07days on market $295,000 Active 72 DOM
-
2026-06-04days on market $295,000 Active 69 DOM
-
2026-06-03days on market $295,000 Active 68 DOM
-
2026-06-02days on market $295,000 Active 67 DOM
-
2026-06-01days on market $295,000 Active 66 DOM
-
2026-05-31days on market $295,000 Active 65 DOM
-
2026-03-27$295,000 Active 772-char remark
Show marketing remark (772 chars)
Welcome to this charming 4 Bedroom, 2 Bathroom home featuring a thoughtfully designed floor plan perfect for everyday living and entertaining. The open-Concept layout creates a seamless flow between the living, dining, and kitchen areas, making the home feel spacious and inviting. The kitchen is the heart of the home, complete with a center island with breakfast bar, ideal for casual meals, gatherings or morning coffee. The primary suite offers a private retreat with its own en-suite bathroom, providing comfort and convenience. Located in a great neighborhood in the heart of downtown Bastrop, you'll enjoy easy access to local shops, dining and everything this vibrant community has to offer. Don't miss this opportunity to own a beautiful home in a prime location.
-
2020-05-29soldstatus Sold 532-char remark
Show marketing remark (532 chars)
Single-story home w kitchen featuring Woodmont® shaker panel maple cabinetry in Pebble. Master suite has large walk-in closet & dual vanity with Silestone® countertops. Finishing touches include 9-foot ceilings throughout, plush Shaw® carpeting in bedrooms, family room & dining room, tile flooring in the entry & bathrooms & Armstrong® premium vinyl flooring in kitchen & laundry room, 2" faux wood blinds, Carrier® CôR Wi-Fi Smart Thermostat & covered back patio.
-
2020-05-01status Pending - Over 4 Months 532-char remark
Show marketing remark (532 chars)
Single-story home w kitchen featuring Woodmont® shaker panel maple cabinetry in Pebble. Master suite has large walk-in closet & dual vanity with Silestone® countertops. Finishing touches include 9-foot ceilings throughout, plush Shaw® carpeting in bedrooms, family room & dining room, tile flooring in the entry & bathrooms & Armstrong® premium vinyl flooring in kitchen & laundry room, 2" faux wood blinds, Carrier® CôR Wi-Fi Smart Thermostat & covered back patio.
-
2019-12-30status Pending 532-char remark
Show marketing remark (532 chars)
Single-story home w kitchen featuring Woodmont® shaker panel maple cabinetry in Pebble. Master suite has large walk-in closet & dual vanity with Silestone® countertops. Finishing touches include 9-foot ceilings throughout, plush Shaw® carpeting in bedrooms, family room & dining room, tile flooring in the entry & bathrooms & Armstrong® premium vinyl flooring in kitchen & laundry room, 2" faux wood blinds, Carrier® CôR Wi-Fi Smart Thermostat & covered back patio.
-
2019-12-09status Active 532-char remark
Show marketing remark (532 chars)
Single-story home w kitchen featuring Woodmont® shaker panel maple cabinetry in Pebble. Master suite has large walk-in closet & dual vanity with Silestone® countertops. Finishing touches include 9-foot ceilings throughout, plush Shaw® carpeting in bedrooms, family room & dining room, tile flooring in the entry & bathrooms & Armstrong® premium vinyl flooring in kitchen & laundry room, 2" faux wood blinds, Carrier® CôR Wi-Fi Smart Thermostat & covered back patio.
-
2019-12-06status Pending 532-char remark
Show marketing remark (532 chars)
Single-story home w kitchen featuring Woodmont® shaker panel maple cabinetry in Pebble. Master suite has large walk-in closet & dual vanity with Silestone® countertops. Finishing touches include 9-foot ceilings throughout, plush Shaw® carpeting in bedrooms, family room & dining room, tile flooring in the entry & bathrooms & Armstrong® premium vinyl flooring in kitchen & laundry room, 2" faux wood blinds, Carrier® CôR Wi-Fi Smart Thermostat & covered back patio.
-
2019-11-08price $226,921 532-char remark
Show marketing remark (532 chars)
Single-story home w kitchen featuring Woodmont® shaker panel maple cabinetry in Pebble. Master suite has large walk-in closet & dual vanity with Silestone® countertops. Finishing touches include 9-foot ceilings throughout, plush Shaw® carpeting in bedrooms, family room & dining room, tile flooring in the entry & bathrooms & Armstrong® premium vinyl flooring in kitchen & laundry room, 2" faux wood blinds, Carrier® CôR Wi-Fi Smart Thermostat & covered back patio.
-
2019-11-01price $226,856 532-char remark
Show marketing remark (532 chars)
Single-story home w kitchen featuring Woodmont® shaker panel maple cabinetry in Pebble. Master suite has large walk-in closet & dual vanity with Silestone® countertops. Finishing touches include 9-foot ceilings throughout, plush Shaw® carpeting in bedrooms, family room & dining room, tile flooring in the entry & bathrooms & Armstrong® premium vinyl flooring in kitchen & laundry room, 2" faux wood blinds, Carrier® CôR Wi-Fi Smart Thermostat & covered back patio.
-
2019-10-09price $226,836 532-char remark
Show marketing remark (532 chars)
Single-story home w kitchen featuring Woodmont® shaker panel maple cabinetry in Pebble. Master suite has large walk-in closet & dual vanity with Silestone® countertops. Finishing touches include 9-foot ceilings throughout, plush Shaw® carpeting in bedrooms, family room & dining room, tile flooring in the entry & bathrooms & Armstrong® premium vinyl flooring in kitchen & laundry room, 2" faux wood blinds, Carrier® CôR Wi-Fi Smart Thermostat & covered back patio.
-
2019-09-24$226,801 Active 532-char remark
Show marketing remark (532 chars)
Single-story home w kitchen featuring Woodmont® shaker panel maple cabinetry in Pebble. Master suite has large walk-in closet & dual vanity with Silestone® countertops. Finishing touches include 9-foot ceilings throughout, plush Shaw® carpeting in bedrooms, family room & dining room, tile flooring in the entry & bathrooms & Armstrong® premium vinyl flooring in kitchen & laundry room, 2" faux wood blinds, Carrier® CôR Wi-Fi Smart Thermostat & covered back patio.
ⓘ Source: listings_history table (triggers on properties + properties_extension) + one-shot
backfill from property_details.listing_events for pre-trigger history.
Tax reassessment forecast TX · Resets to sale price
- Current annual tax
- $6,084 · $507/mo
- Projected year-2 tax
- $6,084 · $507/mo
- Expected delta
- $0/yr ($0/mo · 0.0%)
ⓘ Screening estimate from a state-policy table — verify with the county assessor before closing.
Climate risk First Street
- Flood 1/10 Low FEMA zone X (unshaded) · 0% chance over 30 yrs
- Wildfire 5/10 Major
- Heat 8/10 Severe 7 d/yr ≥109°F today · 23 d/yr by 30 yrs out
- Wind 8/10 Severe 80% chance of damaging wind over 30 yrs
- Air quality 1/10 Low 0 unhealthy d/yr today · 0 by 30 yrs out
Nearby sold comps map
Loading sold comps map…
Walkable amenities ~0.75 mi
Loading nearby amenities…
Taxation est. · year 1
- Rental income
- $35,187
- − Mortgage interest
- −$16,525
- − Property taxes
- −$6,084
- − Insurance
- −$1,475
- − Repairs & maintenance
- −$2,815
- − Management
- −$2,815
- − HOA
- −$300
- − Depreciation
- −$8,582
- Taxable loss
- −$3,408
- Est. tax savings @ 24.0%
- +$818
- After-tax cash flow
- $2,193/yr
For passive investors: Depreciation is non-cash, so a rental often shows a tax loss while cash-flowing — sheltering income. Rental losses are passive: they offset passive income freely, and up to $25,000/yr can offset ordinary (W-2) income if you actively participate and your MAGI is under $100k (phasing out to $0 by $150k); unused losses carry forward. On sale, claimed depreciation is recaptured at up to 25%, and gains may owe capital-gains tax (a 1031 exchange can defer both). Figures are a year-1 estimate at your 24.0% rate — not tax advice; consult a CPA.
Schools (NCES district)
- District
- Bastrop ISD
- NCES district ID
- 4809570
- Math proficiency
- 25% ▼ -13.00%
- Reading proficiency
- 28% ▼ -4.00%
- Median HH income
- $56,010
- Composite
- 23.87/100
- National rank
- #7799
- State rank
- #670 of 826 in TX
Livability — Bastrop
- Score
- 62/100
- State rank
- #947
- US rank
- #16846
Category grades
Schools grade is shown separately in the Schools card above.
Census & demographics
- Census place
- Bastrop, TX
- County
- Bastrop County · 68,601 people
- City population
- 38,190
- Metro
- Austin-Round Rock-Georgetown, TX
- Population (ZIP)
- 38,190
- Household income
- $89,968
- Rent vs Own
- Severe rent burden
- 775.0
Population outlook (Bastrop County) Hauer SSP2
- Today (2025)
- 94,260 people
- By 2030
- 101,355 · +7.5%
- By 2040
- 115,578 · +22.6%
- By 2050
- 129,464 · +37.3%
- By 2075
- 168,068 · +78.3%
- By 2100
- 194,857 · +106.7%
Race, ethnicity, and origin ACS 2023
- Neighborhood character
- Diverse neighborhood (Simpson 0.57)
- Race & ethnicity
- White 54% Hispanic / Latino 36% Two or more races 17% Black 6% Native American 1%
- Hispanic origin (detail)
- Mexican 28% Puerto Rican 2%
- Common ancestry
- Italian 3% Serbian 2% Lithuanian 2%
- Foreign-born
- 8% · Canada, Vietnam
- Languages at home
- 75% English-only · Spanish 23% German/W. Germanic 1%
Political lean MEDSL · Bastrop
- 2024 margin
- R (+18.4) · D 40.2% · R 58.6% · Other 1.2%
- 2008→2024 swing
- -10.2pp toward R · 2008: -8.2pp · 2024: -18.4pp
- All cycles
- 2024: R+18.4 2020: R+13.8 2016: R+20.4 2012: R+17.0 2008: R+8.2
Not yet ingested
- Civics
- —
Market trends
- HPI YoY
- ▼ -73.68%
- Current HPI
- 247.1145
- Rent YoY
- ▼ -2.04%
- Metro
- Austin-Round Rock-Georgetown, TX
- State GDP YoY
- ▲ 3.95%
- F500 in state
- 110
Industry mix (Fortune 500 HQ in TX)
| Industry | F500 HQs | Revenue |
|---|---|---|
| Energy | 16 | $1,198B |
|
||
| Technology | 5 | $198B |
|
||
| Engineering / Construction | 4 | $72B |
|
||
| Energy Services | 3 | $60B |
|
||
| Utilities | 3 | $41B |
|
||
| Healthcare | 2 | $330B |
|
||
Price history
+30.1% since first listed10 events — show timeline
- 2026-03-27 Listed $295,000 Unlock MLS
- 2020-05-29 Sold (MLS) — Unlock MLS
- 2020-05-01 Pending — Unlock MLS
- 2019-12-30 Pending — Unlock MLS
- 2019-12-09 Relisted — Unlock MLS
- 2019-12-06 Pending — Unlock MLS
- 2019-11-08 Price Changed $226,921 Unlock MLS
- 2019-11-01 Price Changed $226,856 Unlock MLS
- 2019-10-09 Price Changed $226,836 Unlock MLS
- 2019-09-24 Listed $226,801 Unlock MLS
Property tax history
+53.2%/yrLatest (2025): $6,084 · -5.1% YoY. Source: county tax records.
Cash-flow waterfall
monthlySold comps — $/sqft
last 12 mo · ≤1 miLoading sold comps…