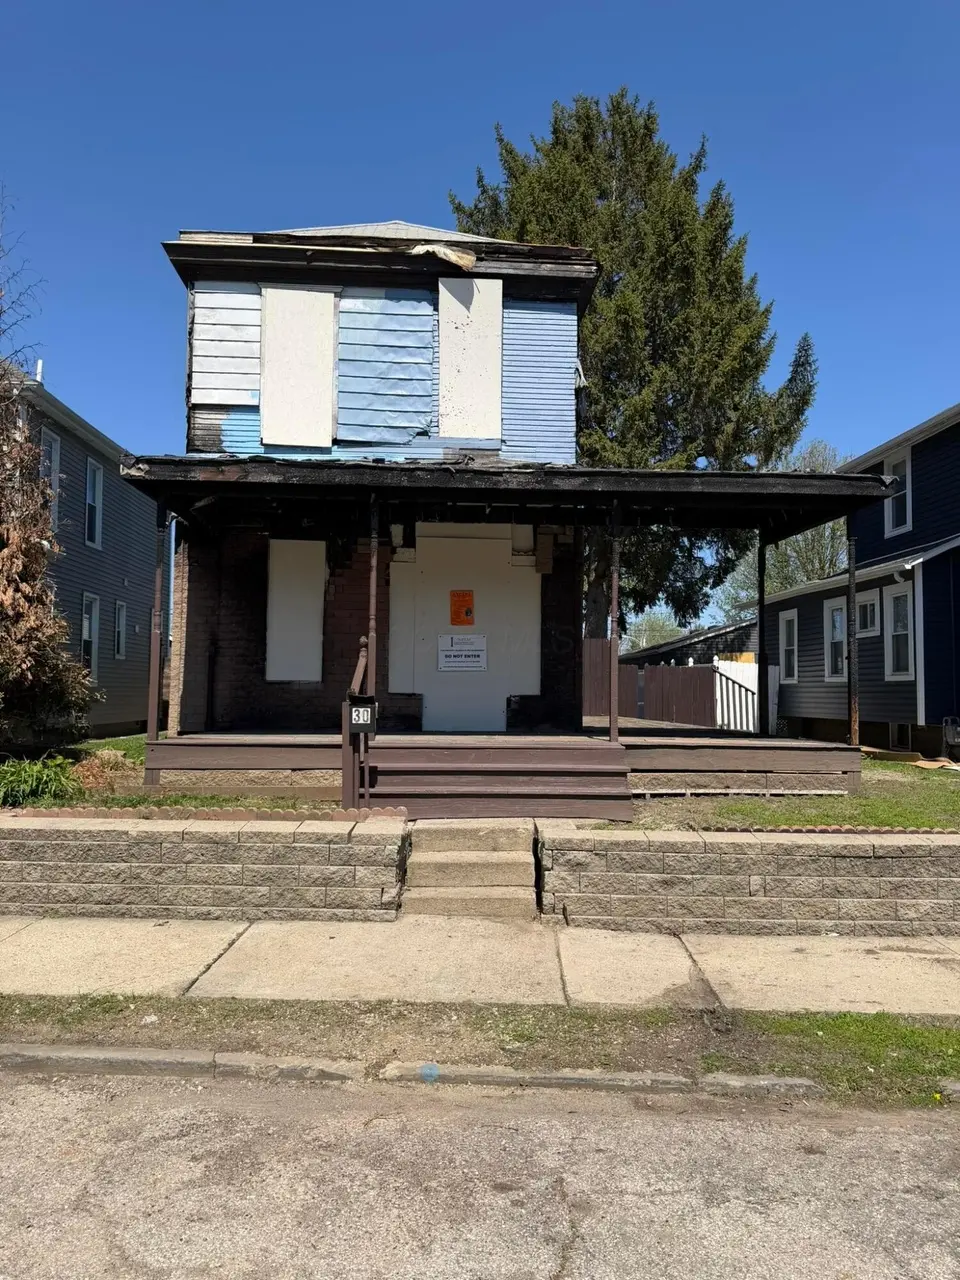
30 W Markison Ave · Columbus, OH
Flood risk 1/10 · Minimal
- FEMA flood zone
- X (unshaded)
- Chance of flooding over 30 yrs
- 0.0%
- Est. flood insurance / yr
- $473 – $860
Fire risk 1/10 · Minimal
- Est. fire insurance / yr
- $713 – $1,323
Heat risk 4/10 · Minor
- Hot days now (above 100°F)
- 7 days/yr
- Hot days in 30 yrs
- 18 days/yr
Wind risk 2/10 · Minimal
- Chance of severe wind over 30 yrs
- 1.0%
Air-quality risk 3/10 · Minor
- Unhealthy air days now
- 2 days/yr
- Unhealthy air days in 30 yrs
- 3 days/yr
Risk factors via First Street. Map © Google.
Why this score? — see what drove the B- grade
The composite is a weighted blend of 9 inputs, each scored 0–100. Each bar is that input's sub-score; the figure is the points it added to the 100-point composite (weight × sub-score).
- Cash flow +30.0/30.0
- 1% rule +10.0/10.0
- DSCR +10.0/10.0
- ARV discount +7.5/15.0
- Livability +4.0/5.0
- Rent growth +3.1/5.0
- Condition / age +2.5/5.0
- Schools +1.7/10.0
- Appreciation +0.0/10.0
$70,000
🖨 Deal sheet 📄 Offer letter ✓ Due diligence
Listing remarks MLS
THE REALTOR IS THE RECEIVER APPOINTED BY THE FRANKLIN COUNTY MUNICIPAL COURT, ENVIRONMENTAL DIVISION. The buyer must provide the Receiver with a demolition or rehabilitation plan, project timeline, and proof of funds when submitting an offer. The property currently has an unsafe order that the buyer will be required to remediate. Any accepted contract is subject to court review and approval and will not be a quick close. Due to the condition of the property, curb offers only. The Receiver requests in-state buyers only.
Key facts
- 3,920 sq ft lot
- Built 1900
- Listed 25 days
Neighborhood map
What this means for you Summary
Snapshot
- This is a 3-bed/1.0-bath single-family listed at $70k.
Deal economics
- At list price, monthly cash flow is $703 ($8k/yr) — positive.
- The deal already cash-flows at list — no discount required.
- Meets the 1% rule at list price ($2k rent vs $70k).
- Recommended offer: $69k (1.5% below list) — sets the bar for market timing.
- Cap rate 18.4% vs local median 3.8% in Columbus — top-decile yield for the area; either an underpriced asset or a hidden risk that comps aren't pricing in. Stress-test before assuming the spread holds.
Location & tenants
- Location reads 81/100 on livability (#97 in OH, #1,491 nationally) — a professional / high-income tenant draw. Strengths: commute A+, cost of living A+, housing A+; Watch: employment C-, crime F.
- Columbus City School District (urban): math 15% / reading 26% proficiency, ranked #626 of 656 in OH (top 95%) — low school quality limits family demand, transient renter base, plan for 1-2y turnover; 72% free/reduced lunch — lower-income household profile, screen leases tightly.
- Market conditions: Rents rising (+2.3%/yr); 196 active listings in the ZIP; 40 comparable units currently listed for rent nearby; rentals at typical pace (median 24d on market — plan ~3-4 weeks tenant-placement turnaround); 8,139 units permitted in Franklin County in 2024 (5,940 in 5+ unit buildings).
- This rent runs 32% of the median local income ($63k/yr) — at the standard rent-burdened threshold; future hikes will face affordability resistance.
Forward outlook
- Local home prices are declining (-3.0%/yr); year-one equity from $484 of loan paydown is wiped out by about $2k of value loss. Plan a longer hold.
- Franklin County population projected at +34% by 2050 — long-run rental-demand tailwind backs the buy-and-hold thesis.
- At projected returns (-3.0% appreciation + 2.3% rent growth), your $20k cash investment doubles in ~3 years — after that, you're playing with house money.
Negotiation context
- It's been on market 25 days — a 2% lower offer ($69k) is reasonable based on typical stale-listing flexibility.
- 2 sale attempts since 17y ago with the ask held roughly flat each time — persistent listings suggest the price (not the market) is what's stuck; bring a comps-based counter.
- Current owner paid $30k; list at $70k implies a 133% gain — meaningful room to come down on a strong offer.
Risks & watch-outs
- Watch-outs: property tax is 4.2% of price; built in 1900 — expect roof / HVAC / electrical / plumbing capex.
Questions for the listing agent
- Built in 1900 — when were the roof, HVAC, electrical panel, plumbing, and water heater last replaced?
- Property tax is high relative to price — has the assessment been appealed recently, and will the sale trigger a re-assessment?
- Is there a deadline driving the sale (1031 exchange, divorce, estate, relocation)? That informs how much negotiation room exists.
- Crime grade is F in this area — have there been break-ins, vandalism, or insurance claims at this property in the last 3 years? What carrier currently insures it and at what premium?
- What's the average days-on-market for RENTAL listings here right now (not sales)? A rising rental-DOM trend means longer vacancies and softer asking-rent achievability than the comps imply.
- What's the recent tenant-quality profile in this submarket — average credit score on applications, eviction rate, late-payment / NSF rate, and stable-employment percentage? A property-management company in the area should have these aggregated.
- How much new for-sale + rental construction is in the pipeline within 1–3 miles? Heavy new supply typically softens prices + rents 12–24 months out; constrained supply supports both.
Investment metrics
- 1% rule
- 2.43% ✓
- Cap rate
- 18.35%
- Cash-on-cash
- 43.07%
- DSCR
- 2.92
- GRM
- 3.4
CMA / ARV
- ARV (median comp)
- $361,640
- List price
- $70,000
- Delta
- -80.64%
- Verdict
- UNDERPRICED
- Comps
- 20 within 1.0 mi
Show comp detail 12 sales within ~0.75 mi
| Address | Dist | Beds/Ba | Sqft | Sold | Price | $/sf | Match |
|---|---|---|---|---|---|---|---|
| 1383 City Park Ave | 0.18mi | 3/1.0 | 1,456 (+3%) | 1mo | $325,000 | $223 | 86 |
| 1403 Bruck St | 0.44mi | 2/2.0 (-1) | 1,428 (+1%) | 1mo | $395,000 | $277 | 68 |
| 1452 S 4th St | 0.24mi | 3/2.5 | 1,268 (-10%) | 1mo | $399,000 | $315 | 65 |
| 139 E Moler St | 0.34mi | 2/3.0 (-1) | 1,471 (+4%) | 1mo | $436,000 | $296 | 64 |
| 166 E Welch Ave | 0.31mi | 3/2.0 | 1,256 (-11%) | 0mo | $400,000 | $318 | 62 |
| 120 Hosack St | 0.66mi | 3/1.0 | 1,360 (-4%) | 0mo | $52,500 | $39 | 62 |
| 363 E Morrill Ave | 0.61mi | 2/1.5 (-1) | 1,440 (+2%) | 2mo | $329,000 | $228 | 60 |
| 1532 Parsons Ave | 0.70mi | 2/1.5 (-1) | 1,402 (-1%) | 1mo | $185,500 | $132 | 58 |
| 165 Frebis Ave | 0.40mi | 2/2.5 (-1) | 1,314 (-7%) | 1mo | $360,000 | $274 | 58 |
| 301 Southwood Ave | 0.49mi | 3/1.5 | 1,260 (-11%) | 1mo | $350,000 | $278 | 56 |
| 306 E Jenkins Ave | 0.50mi | 3/1.5 | 1,248 (-12%) | 1mo | $390,000 | $313 | 54 |
| 966 S Front St | 0.73mi | 2/2.0 (-1) | 1,580 (+12%) | 0mo | $420,000 | $266 | 37 |
Match score weights: distance 35% · size 25% · config 20% · recency 20%. Top-matched comps best support the ARV.
Projected returns pro-forma
-3.0% appreciation · 2.32% rent growth · sell at horizon
- IRR
- 39.1%
- Equity multiple
- 2.65×
- Total profit
- $32,428
- Equity at exit
- $10,437
- IRR
- 45.2%
- Equity multiple
- 5.17×
- Total profit
- $81,747
- Equity at exit
- $6,052
Cash invested: $19,600 (down + closing). Projections, not guarantees.
Landlord ↔ Tenant lean methodology
- Overall (STATE)
- 73 Landlord-Friendly
- State Ohio
- 73 Landlord-Friendly · R+6
- County
- — inherits STATE
- City
- — inherits STATE
ZIP-level market 43207
- Rents YoY
- 2.3%
- Active inventory
- 196
- Price-to-rent
- 3.4×
Monthly cashflow live
- Estimated rent
- $1,702 high interval (Pro) →
- Mortgage (P&I)
- −$367
- Tax from tax record
- −$245 /mo · $2,936/yr
- Insurance
- −$29
- HOA
- −$0
- Vacancy / Maint / Mgmt
- −$357
- Net cashflow
- $703
Break-even live
UW: 25.0% down · 7.5% · 30yr · 1.5% tax · 5.0% vac · 8.0% maint · 8.0% mgmt
Financing live
Cash to close
- Down payment
- $17,500
- Closing costs
- $2,100
- Reserves months
- —
- Total cash needed
- —
Loan-product check · same deal, 3 products live
Conventional
25% down · 7.5% · 30yr
- Down + closing
- —
- Monthly P&I
- —
- Monthly cashflow
- —
- DSCR
- —
- Eligible?
- —
Personal DTI + credit; lowest rate.
DSCR
20% down · 8.5% · 30yr
- Down + closing
- —
- Monthly P&I
- —
- Monthly cashflow
- —
- DSCR
- —
- Eligible?
- —
No personal income docs; deal must DSCR.
Hard money
10% down · 12.0% · 12mo
- Down + closing
- —
- Monthly P&I
- —
- Monthly cashflow
- —
- DSCR
- —
- Eligible?
- —
Short-term bridge; refi at stabilization.
Rent comps 40 comps
| Address | Beds | Baths | Sqft | Rent | $/sqft | DOM | Units | Dist |
|---|---|---|---|---|---|---|---|---|
| 27 W Jenkins Ave Columbus, OH | 2.0–3.0 | 1.0–1.5 | 1013 | $1,458 | $1.44 | 7d | 4 | 0.08mi |
| 33 W Morrill Ave Columbus, OH | 1.0–3.0 | 1.0–2.0 | 935 | $1,297 | $1.39 | 7d | 4 | 0.15mi |
| 61 E Moler St #63 Columbus, OH | 2.0 | 1.0 | 1050 | $1,950 | $1.86 | 14d | 1 | 0.25mi |
| 6 Hanford St #6 Columbus, OH | 2.0 | 1.0 | 1080 | $1,850 | $1.71 | 43d | 1 | 0.35mi |
| 122 E Woodrow Ave Columbus, OH | 2.0 | 1.0 | 1200 | $1,450 | $1.21 | 14d | 1 | 0.39mi |
| 205 E Moler St Unit B Columbus, OH | 2.0 | 1.0 | 891 | $995 | $1.12 | 7d | 1 | 0.40mi |
| 106 E Gates St Columbus, OH | 3.0 | 1.5 | 1472 | $2,700 | $1.83 | 14d | 1 | 0.45mi |
| 206 E Woodrow Ave Columbus, OH | 2.0 | 1.0 | 999 | $1,295 | $1.30 | 43d | 1 | 0.47mi |
| 76-78 E Barthman Ave Columbus, OH | 3.0 | 1.0 | 1206 | $1,500 | $1.24 | 23d | 1 | 0.56mi |
| 1808 S 6th St Unit 1808 Columbus, OH | 2.0 | 1.0 | 975 | $1,050 | $1.08 | 43d | 1 | 0.56mi |
| 1110 S 4th St Columbus, OH | 3.0 | 2.0 | 1465 | $900 | $0.61 | 7d | 1 | 0.60mi |
| 357 Frebis Ave #5 Columbus, OH | 3.0 | 3.5 | 1748 | $2,750 | $1.57 | 43d | 1 | 0.61mi |
| 19 E Deshler Ave Columbus, OH | 2.0 | 1.0 | 1104 | $2,000 | $1.81 | 21d | 1 | 0.62mi |
| 367 E Morrill Ave Columbus, OH | 2.0 | 1.0 | 977 | $1,450 | $1.48 | 43d | 1 | 0.63mi |
| 362 E Hinman Ave Columbus, OH | 2.0 | 1.0 | 879 | $1,149 | $1.31 | 43d | 1 | 0.64mi |
| 967-971 S High St Columbus, OH | 2.0 | 1.0 | 1050 | $1,700 | $1.62 | 43d | 1 | 0.71mi |
| 274 E Barthman Ave Columbus, OH | 2.0 | 1.0 | 960 | $1,500 | $1.56 | 17d | 1 | 0.72mi |
| 476 Southwood Ave Columbus, OH | 2.0 | 1.0 | 1219 | $1,400 | $1.15 | 43d | 1 | 0.75mi |
| 490-492 E Jenkins Ave Unit 490 Columbus, OH | 3.0 | 1.0 | 1050 | $1,325 | $1.26 | 43d | 1 | 0.76mi |
| 396 E Mithoff St Columbus, OH | 3.0 | 1.5 | 1380 | $2,295 | $1.66 | 10d | 1 | 0.77mi |
| 1843 Parsons Ave Columbus, OH | 2.0 | 1.0 | 899 | $1,331 | $1.48 | 23d | 1 | 0.80mi |
| 901 S Front St Columbus, OH | 3.0 | 2.5 | 1743 | $2,800 | $1.61 | 43d | 1 | 0.80mi |
| 546 E Jenkins Ave Unit 1 Columbus, OH | 2.0 | 1.0 | 975 | $1,295 | $1.33 | 23d | 1 | 0.84mi |
| 529 E Morrill Ave Columbus, OH | 3.0 | 1.0 | 1318 | $1,600 | $1.21 | 3d | 1 | 0.85mi |
| 315 Siebert St Columbus, OH | 3.0 | 1.0 | 1597 | $2,200 | $1.38 | 23d | 1 | 0.88mi |
| 530 Hanford St Unit 1496117P Columbus, OH | 4.0 | 3.0 | 1862 | $7,310 | $3.93 | 2d | 1 | 0.89mi |
| 874 Macon Aly Columbus, OH | 2.0 | 1.5 | 1213 | $2,100 | $1.73 | 21d | 1 | 0.93mi |
| 554 E Gates St Columbus, OH | 2.0 | 1.0 | 902 | $1,295 | $1.44 | 10d | 1 | 0.94mi |
| 506 Thurman Ave Columbus, OH | 3.0 | 1.0 | 1500 | $1,600 | $1.07 | 2d | 1 | 0.94mi |
| 573 E Mithoff St Columbus, OH | 3.0 | 1.5 | 1300 | $2,100 | $1.62 | 43d | 1 | 0.98mi |
| 100 Frankfort Sq Columbus, OH | 1.0–2.0 | 1.0–2.0 | 986 | $2,264 | $2.30 | 2d | 25 | 0.98mi |
| 1061 Parsons Ave Columbus, OH | 2.0 | 2.0 | 1408 | $1,950 | $1.38 | 43d | 1 | 1.00mi |
| 850 Jaeger St Columbus, OH | 2.0 | 1.0–2.5 | 910 | $4,241 | $4.66 | 1d | 27 | 1.00mi |
| 662 Southwood Ave Columbus, OH | 3.0 | 2.0 | 1183 | $1,950 | $1.65 | 19d | 1 | 1.01mi |
| 1175 Ann St Columbus, OH | 2.0 | 1.0 | 904 | $1,495 | $1.65 | 43d | 1 | 1.01mi |
| 461-463 Reinhard Ave Unit 461 Columbus, OH | 3.0 | 1.0 | 1134 | $1,450 | $1.28 | 3d | 1 | 1.02mi |
| 461-463 Reinhard Ave Columbus, OH | 3.0 | 1.0 | 1134 | $1,450 | $1.28 | 3d | 1 | 1.02mi |
| 383 Schiller Aly Columbus, OH | 2.0 | 1.5 | 1275 | $2,550 | $2.00 | 23d | 1 | 1.04mi |
| 317 E Kossuth St Columbus, OH | 2.0 | 1.5 | 1192 | $1,699 | $1.43 | 43d | 1 | 1.05mi |
| 745 Mohawk St Columbus, OH | 2.0 | 2.0 | 1218 | $2,550 | $2.09 | 43d | 1 | 1.07mi |
Listing history 6 events
-
2026-05-04status Pending 524-char remark
Show marketing remark (524 chars)
THE REALTOR IS THE RECEIVER APPOINTED BY THE FRANKLIN COUNTY MUNICIPAL COURT, ENVIRONMENTAL DIVISION. The buyer must provide the Receiver with a demolition or rehabilitation plan, project timeline, and proof of funds when submitting an offer. The property currently has an unsafe order that the buyer will be required to remediate. Any accepted contract is subject to court review and approval and will not be a quick close. Due to the condition of the property, curb offers only. The Receiver requests in-state buyers only.
-
2026-04-09$70,000 Active 524-char remark
Show marketing remark (524 chars)
THE REALTOR IS THE RECEIVER APPOINTED BY THE FRANKLIN COUNTY MUNICIPAL COURT, ENVIRONMENTAL DIVISION. The buyer must provide the Receiver with a demolition or rehabilitation plan, project timeline, and proof of funds when submitting an offer. The property currently has an unsafe order that the buyer will be required to remediate. Any accepted contract is subject to court review and approval and will not be a quick close. Due to the condition of the property, curb offers only. The Receiver requests in-state buyers only.
-
2009-03-16historical
-
2009-01-13$19,900
-
1998-04-23soldstatus $30,000
-
1993-08-16soldstatus $23,000
ⓘ Source: listings_history table (triggers on properties + properties_extension) + one-shot
backfill from property_details.listing_events for pre-trigger history.
Tax reassessment forecast OH · Partial reset (capped growth)
- Current annual tax
- $2,936 · $245/mo
- Projected year-2 tax
- $2,936 · $245/mo
- Expected delta
- $0/yr ($0/mo · 0.0%)
ⓘ Screening estimate from a state-policy table — verify with the county assessor before closing.
Climate risk First Street
- Flood 1/10 Low FEMA zone X (unshaded) · 0% chance over 30 yrs
- Wildfire 1/10 Low
- Heat 4/10 Moderate 7 d/yr ≥100°F today · 18 d/yr by 30 yrs out
- Wind 2/10 Low 100% chance of damaging wind over 30 yrs
- Air quality 3/10 Moderate 2 unhealthy d/yr today · 3 by 30 yrs out
Nearby sold comps map
Loading sold comps map…
Walkable amenities ~0.75 mi
Loading nearby amenities…
Taxation est. · year 1
- Rental income
- $20,421
- − Mortgage interest
- −$3,921
- − Property taxes
- −$2,936
- − Insurance
- −$350
- − Repairs & maintenance
- −$1,634
- − Management
- −$1,634
- − Depreciation
- −$2,036
- Taxable income
- $7,910
- Est. tax owed @ 24.0%
- −$1,899
- After-tax cash flow
- $6,543/yr
For passive investors: Depreciation is non-cash, so a rental often shows a tax loss while cash-flowing — sheltering income. Rental losses are passive: they offset passive income freely, and up to $25,000/yr can offset ordinary (W-2) income if you actively participate and your MAGI is under $100k (phasing out to $0 by $150k); unused losses carry forward. On sale, claimed depreciation is recaptured at up to 25%, and gains may owe capital-gains tax (a 1031 exchange can defer both). Figures are a year-1 estimate at your 24.0% rate — not tax advice; consult a CPA.
Schools (NCES district)
- District
- Columbus City School District
- NCES district ID
- 3904380
- Math proficiency
- 15% ▼ -17.00%
- Reading proficiency
- 26% ▼ -12.00%
- Median HH income
- $38,483
- Composite
- 17.19/100
- National rank
- #9105
- State rank
- #626 of 656 in OH
Livability — Columbus
- Score
- 81/100
- State rank
- #97
- US rank
- #1491
Category grades
Schools grade is shown separately in the Schools card above.
Census & demographics
- Census place
- Columbus, OH
- County
- Franklin County · 1,351,780 people
- City population
- 612,189
- Metro
- Columbus, OH
- Population (ZIP)
- 47,272
- Household income
- $63,310
- Rent vs Own
- Severe rent burden
- 1679.0
Population outlook (Franklin County) Hauer SSP2
- Today (2025)
- 1,456,139 people
- By 2030
- 1,556,890 · +6.9%
- By 2040
- 1,757,349 · +20.7%
- By 2050
- 1,950,539 · +34.0%
- By 2075
- 2,376,171 · +63.2%
- By 2100
- 2,636,796 · +81.1%
Race, ethnicity, and origin ACS 2023
- Neighborhood character
- Diverse neighborhood (Simpson 0.57)
- Race & ethnicity
- White 59% Black 28% Two or more races 7% Hispanic / Latino 5% Asian 1%
- Hispanic origin (detail)
- Mexican 3%
- Common ancestry
- Italian 2% Romanian 2% Slovak 1%
- Foreign-born
- 4% · Canada
- Languages at home
- 95% English-only · Spanish 3% Other Indo-European 1%
Political lean MEDSL · Franklin
- 2024 margin
- Strong D (+28.4) · D 63.7% · R 35.3% · Other 1.0%
- 2008→2024 swing
- +7.7pp toward D · 2008: 20.7pp · 2024: 28.4pp
- All cycles
- 2024: D+28.4 2020: D+31.4 2016: D+25.9 2012: D+21.7 2008: D+20.7
Not yet ingested
- Civics
- —
Market trends
- HPI YoY
- ▼ -244.33%
- Current HPI
- 268.3028
- Rent YoY
- ▲ 2.32%
- Metro
- Columbus, OH
- State GDP YoY
- ▲ 1.98%
- F500 in state
- 48
Industry mix (Fortune 500 HQ in OH)
| Industry | F500 HQs | Revenue |
|---|---|---|
| Insurance | 3 | $145B |
|
||
| Industrial Machinery | 3 | $49B |
|
||
| Financial Services | 3 | $24B |
|
||
| Consumer Goods | 2 | $93B |
|
||
| Aerospace / Defense | 2 | $47B |
|
||
| Utilities | 2 | $33B |
|
||
Price history
+204.3% since first listed6 events — show timeline
- 2026-05-04 Pending — CBRMLS
- 2026-04-09 Listed $70,000 CBRMLS
- 2009-03-16 Listing Removed — CBRMLS
- 2009-01-13 Listed $19,900 CBRMLS
- 1998-04-23 Sold (Public Records) $30,000 Public Records
- 1993-08-16 Sold (Public Records) $23,000 Public Records
Property tax history
+18.0%/yrLatest (2024): $2,936 · +1.3% YoY. Source: county tax records.
Cash-flow waterfall
monthlySold comps — $/sqft
last 12 mo · ≤1 miLoading sold comps…