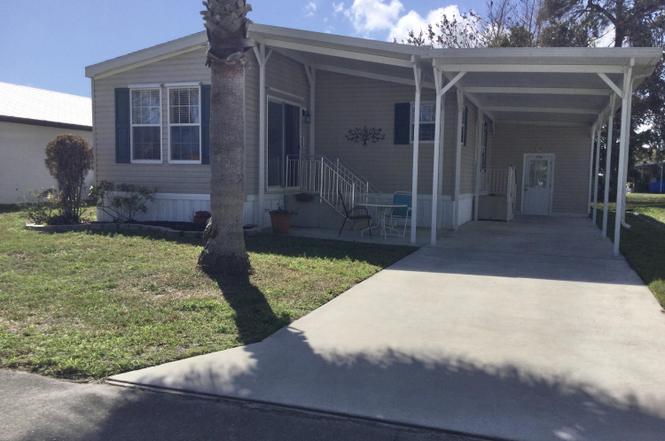
24 Golf Dr · River Park, FL
Flood risk 1/10 · Minimal
- FEMA flood zone
- X (unshaded)
- Chance of flooding over 30 yrs
- 0.0%
- Est. flood insurance / yr
- $507 – $1,088
Fire risk 4/10 · Minor
- Est. fire insurance / yr
- $947 – $1,759
Heat risk 10/10 · Severe
- Hot days now (above 106°F)
- 6 days/yr
- Hot days in 30 yrs
- 20 days/yr
Wind risk 10/10 · Severe
- Chance of severe wind over 30 yrs
- 99.0%
Air-quality risk 2/10 · Minimal
- Unhealthy air days now
- 1 days/yr
- Unhealthy air days in 30 yrs
- 1 days/yr
Risk factors via First Street. Map © Google.
Why this score? — see what drove the B grade
The composite is a weighted blend of 9 inputs, each scored 0–100. Each bar is that input's sub-score; the figure is the points it added to the 100-point composite (weight × sub-score).
- Cash flow +30.0/30.0
- 1% rule +10.0/10.0
- DSCR +10.0/10.0
- ARV discount +7.5/15.0
- Schools +3.7/10.0
- Livability +3.5/5.0
- Rent growth +3.0/5.0
- Condition / age +2.5/5.0
- Appreciation +0.0/10.0
$89,900
🖨 Deal sheet 📄 Offer letter ✓ Due diligence
Listing remarks
Meticulously maintained home in the much sought after Spanish Lakes Community. This is one of the newer manufactured homes in the community featuring indoor laundry, 2022 roof and 2019 ac unit. Home is nicely situated on the canal. Land lease covers all amenities, taxes, lawn care and trash removal. Amenities include golf, 2 pools, shuffleboard, pickleball, bocce, horseshoes, tennis, billiards, ping pong, community room, party room, game room, library, fitness center and dog park. Spanish Lakes is a 55+ community. Future residents must be approved by Spanish Lakes. Call for application. Mobile home license required to show and sell. Mobile home license # BH/1130558/1. Home is turnkey. Item
Key facts
- 2019 ac unit
- 2 pools
- Indoor laundry
Tags
Property features AI
Finance
- Other: Land lease expires 2026-06-30
- Financial info: Monthly land lease payment required
- HOA & community: Located in a senior community; Pets allowed (restrictions may apply); Land lease in place (monthly)
Exterior
- Parking: Three total parking spaces; Attached carport with two covered spaces; One open parking space; Concrete parking
- Security: Security patrol
- Utilities: 150 Amp electric service; Private sewer; Water available; Sewer available; Cable available
- Home design: Mobile home (double wide); One story; Resale condition; Faces north; Entry raised (raised foundation)
- Construction: Vinyl siding; Pre-fab construction; Shingle roof; Aluminum skirting; Raised foundation; Mobile width 24 feet
- Exterior features: Covered and open patios; Patio; Waterfront property; Paved road access; Private maintained road
Interior
- Kitchen: Dishwasher; Electric range; Microwave; Refrigerator
- Bedrooms: Two bedrooms on the main level
- Flooring: Carpet; Vinyl
- Bathrooms: Two full bathrooms on the main level
- Heating & cooling: Central electric heating; Central air conditioning; Ceiling fans
- Interior features: Kitchen island; Stacked bedroom layout; Partially furnished; Blinds on windows
- Laundry & utility: Laundry closet; Electric water heater
Neighborhood map
What this means for you Summary
Snapshot
- This is a 2-bed/2.0-bath manufactured listed at $90k.
Deal economics
- At list price, monthly cash flow is $842 ($10k/yr) — positive.
- The deal already cash-flows at list — no discount required.
- Meets the 1% rule at list price ($2k rent vs $90k).
- Recommended offer: $82k (9.0% below list) — sets the bar for market timing.
- Cap rate 17.5% vs local median 6.3% in River Park — top-decile yield for the area; either an underpriced asset or a hidden risk that comps aren't pricing in. Stress-test before assuming the spread holds.
Location & tenants
- Location reads 69/100 on livability (#451 in FL) — a middle-class / working-renter tenant base. Strengths: cost of living A+, housing A+, commute A-; Watch: schools F, amenities F, employment F.
- St. Lucie (urban): math 40% / reading 48% proficiency, ranked #51 of 73 in FL (top 70%) — families likely to look elsewhere, expect single-tenant / working-renter base with shorter leases.
- Market conditions: Rents rising (+1.9%/yr); 639 active listings in the ZIP; 16 comparable units currently listed for rent nearby; rentals at typical pace (median 24d on market — plan ~3-4 weeks tenant-placement turnaround); 4,868 units permitted in St. Lucie County in 2024 (268 in 5+ unit buildings).
- This rent runs 36% of the median local income ($62k/yr) — at the standard rent-burdened threshold; future hikes will face affordability resistance.
Forward outlook
- Local home prices are declining (-3.0%/yr); year-one equity from $622 of loan paydown is wiped out by about $3k of value loss. Plan a longer hold.
- St. Lucie County population projected at +20% by 2050 — long-run rental-demand tailwind backs the buy-and-hold thesis.
- At projected returns (-3.0% appreciation + 1.9% rent growth), your $25k cash investment doubles in ~3 years — after that, you're playing with house money.
Negotiation context
- It's been on market 98 days — a 9% lower offer ($82k) is reasonable based on typical stale-listing flexibility.
Risks & watch-outs
- Climate carrying-cost: severe wind risk, 99% chance of damaging wind over 30y; extreme-heat days projected 6→20/yr by 2055 (HVAC capex compounding) — expect insurance premiums to compound above CPI over the hold.
Questions for the listing agent
- It's been on market 98 days. Have you received any prior offers? Is the seller open to a 9% concession, seller financing, or rate buy-down credit?
- Why hasn't it sold? Are there any deal-killer items the seller is aware of (foundation, flood, title, zoning, code violations)?
- Is there a deadline driving the sale (1031 exchange, divorce, estate, relocation)? That informs how much negotiation room exists.
- Schools are F-rated, which usually means shorter tenancies and higher turnover. Who's the typical renter profile here, and what's been the actual vacancy rate?
- What's the average days-on-market for RENTAL listings here right now (not sales)? A rising rental-DOM trend means longer vacancies and softer asking-rent achievability than the comps imply.
- What's the recent tenant-quality profile in this submarket — average credit score on applications, eviction rate, late-payment / NSF rate, and stable-employment percentage? A property-management company in the area should have these aggregated.
- How much new for-sale + rental construction is in the pipeline within 1–3 miles? Heavy new supply typically softens prices + rents 12–24 months out; constrained supply supports both.
Investment metrics
- 1% rule
- 2.06% ✓
- Cap rate
- 17.53%
- Cash-on-cash
- 40.14%
- DSCR
- 2.79
- GRM
- 4.0
CMA / ARV
- ARV (on-the-fly)
- $34,560
- Comps found
- 12
Show comp detail 12 sales within ~0.75 mi
| Address | Dist | Beds/Ba | Sqft | Sold | Price | $/sf | Match |
|---|---|---|---|---|---|---|---|
| 23 Oro Grande Way | 0.44mi | 2/2.0 | 1,088 (+1%) | 6mo | $45,000 | $41 | 73 |
| 37 El Camino Real | 0.32mi | 2/2.0 | 984 (-9%) | 1mo | $15,000 | $15 | 69 |
| 7 Reforma Ln | 0.14mi | 2/2.0 | 1,150 (+6%) | 20mo | $37,000 | $32 | 67 |
| 12 Nuestra Calle Ln | 0.41mi | 2/2.0 | 984 (-9%) | 6mo | $26,000 | $26 | 61 |
| 31 Huarte Way | 0.45mi | 2/2.0 | 1,188 (+10%) | 3mo | $45,000 | $38 | 60 |
| 46 Spanish Way | 0.44mi | 2/2.0 | 984 (-9%) | 13mo | $15,000 | $15 | 54 |
| 45 Mediterranean Blvd W | 0.26mi | 2/2.0 | 1,200 (+11%) | 24mo | $38,000 | $32 | 49 |
| 66 Spanish Way | 0.54mi | 2/2.0 | 984 (-9%) | 14mo | $28,900 | $29 | 49 |
| 8471 Florence Dr | 0.66mi | 2/2.0 | 966 (-11%) | 6mo | $110,000 | $114 | 46 |
| 541 Natalie Dr | 0.60mi | 2/2.0 | 1,032 (-4%) | 22mo | $85,000 | $82 | 46 |
| 23 San Pablo Ln | 0.59mi | 2/2.0 | 1,200 (+11%) | 13mo | $37,000 | $31 | 43 |
| 25 Rio Verde Way | 0.56mi | 2/2.0 | 1,200 (+11%) | 22mo | $64,900 | $54 | 37 |
Match score weights: distance 35% · size 25% · config 20% · recency 20%. Top-matched comps best support the ARV.
Projected returns pro-forma
-3.0% appreciation · 1.92% rent growth · sell at horizon
- IRR
- 35.3%
- Equity multiple
- 2.47×
- Total profit
- $37,094
- Equity at exit
- $13,404
- IRR
- 41.5%
- Equity multiple
- 4.71×
- Total profit
- $93,469
- Equity at exit
- $7,773
Cash invested: $25,172 (down + closing). Projections, not guarantees.
Landlord ↔ Tenant lean methodology
- Overall (STATE)
- 87 Strongly Landlord-Friendly
- State Florida
- 87 Strongly Landlord-Friendly · R+3
- County
- — inherits STATE
- City
- — inherits STATE
ZIP-level market 34952
- Home prices YoY
- -29.6%
- Rents YoY
- 1.9%
- Active inventory
- 639
- Price-to-rent
- 4.0×
Monthly cashflow live
- Estimated rent
- $1,852 high interval (Pro) →
- Mortgage (P&I)
- −$471
- Tax est. 1.5%
- −$112 /mo · $1,348/yr
- Insurance
- −$37
- HOA
- −$0
- Vacancy / Maint / Mgmt
- −$389
- Net cashflow
- $842
Break-even live
UW: 25.0% down · 7.5% · 30yr · 1.5% tax · 5.0% vac · 8.0% maint · 8.0% mgmt
Financing live
Cash to close
- Down payment
- $22,475
- Closing costs
- $2,697
- Reserves months
- —
- Total cash needed
- —
Loan-product check · same deal, 3 products live
Conventional
25% down · 7.5% · 30yr
- Down + closing
- —
- Monthly P&I
- —
- Monthly cashflow
- —
- DSCR
- —
- Eligible?
- —
Personal DTI + credit; lowest rate.
DSCR
20% down · 8.5% · 30yr
- Down + closing
- —
- Monthly P&I
- —
- Monthly cashflow
- —
- DSCR
- —
- Eligible?
- —
No personal income docs; deal must DSCR.
Hard money
10% down · 12.0% · 12mo
- Down + closing
- —
- Monthly P&I
- —
- Monthly cashflow
- —
- DSCR
- —
- Eligible?
- —
Short-term bridge; refi at stabilization.
Rent comps 16 comps
| Address | Beds | Baths | Sqft | Rent | $/sqft | DOM | Units | Dist |
|---|---|---|---|---|---|---|---|---|
| 1900 Bella Vista Way Port Saint Lucie, FL | 1.0–2.0 | 1.0–2.0 | 995 | $1,764 | $1.77 | 14d | 15 | 0.70mi |
| 7700 Pine Lakes Blvd Port Saint Lucie, FL | 1.0–3.0 | 1.0–2.0 | 1022 | $1,878 | $1.84 | 14d | 16 | 0.94mi |
| 124 E Arbor Ave Port Saint Lucie, FL | 3.0 | 1.0 | 964 | $2,550 | $2.65 | 14d | 1 | 1.06mi |
| 13 Lake Vista Trl #205 Port Saint Lucie, FL | 1.0 | 1.5 | 800 | $1,375 | $1.72 | 23d | 1 | 1.19mi |
| 730 SE White Ave Port Saint Lucie, FL | 2.0 | 2.0 | 1386 | $10,000 | $7.22 | 23d | 1 | 1.20mi |
| 14 Lake Vista Trl #101 Port Saint Lucie, FL | 2.0 | 2.0 | 1170 | $2,200 | $1.88 | 23d | 1 | 1.21mi |
| 11 Lake Vista Trl #206 Port Saint Lucie, FL | 2.0 | 2.0 | 1080 | $1,400 | $1.30 | 23d | 1 | 1.26mi |
| 8 Lake Vista Trl #205 Port Saint Lucie, FL | 1.0 | 1.5 | 800 | $1,500 | $1.88 | 23d | 1 | 1.28mi |
| 26 Lake Vista Trl #201 Port Saint Lucie, FL | 2.0 | 2.0 | 1170 | $1,500 | $1.28 | 23d | 1 | 1.31mi |
| 28 Lake Vista Trl #205 Port Saint Lucie, FL | 1.0 | 1.5 | 800 | $1,600 | $2.00 | 23d | 1 | 1.34mi |
| 30 Lake Vista Trl #205 Port Saint Lucie, FL | 1.0 | 1.5 | 800 | $1,300 | $1.62 | 23d | 1 | 1.35mi |
| 4 Lake Vista Trl #202 Port Saint Lucie, FL | 2.0 | 2.0 | 1080 | $1,700 | $1.57 | 21d | 1 | 1.37mi |
| 326 Shady Ln Port Saint Lucie, FL | 3.0 | 2.0 | 1030 | $2,250 | $2.18 | 23d | 1 | 1.38mi |
| 2 Lake Vista Trl #107 Port Saint Lucie, FL | 2.0 | 2.0 | 1170 | $1,850 | $1.58 | 23d | 1 | 1.41mi |
| 1 Lake Vista Trl #201 Port Saint Lucie, FL | 2.0 | 2.0 | 1170 | $1,800 | $1.54 | 23d | 1 | 1.43mi |
| 1810 SE Pinewood Trl Port Saint Lucie, FL | 1.0–2.0 | 1.0–2.0 | 1013 | $2,055 | $2.03 | 14d | 7 | 1.48mi |
Listing history 17 events
-
2026-06-18days on market $89,900 Active 98 DOM
-
2026-06-17days on market $89,900 Active 97 DOM
-
2026-06-16days on market $89,900 Active 96 DOM
-
2026-06-15days on market $89,900 Active 95 DOM
-
2026-06-14days on market $89,900 Active 93 DOM
-
2026-06-13days on market $89,900 Active 92 DOM
-
2026-06-10days on market $89,900 Active 90 DOM
-
2026-06-09days on market $89,900 Active 89 DOM
-
2026-06-08days on market $89,900 Active 88 DOM
-
2026-06-07days on market $89,900 Active 87 DOM
-
2026-06-05days on market $89,900 Active 84 DOM
-
2026-06-03days on market $89,900 Active 83 DOM
-
2026-06-02days on market $89,900 Active 82 DOM
-
2026-06-01days on market $89,900 Active 81 DOM
-
2026-05-31days on market $89,900 Active 80 DOM
-
2026-05-30days on market $89,900 Active 79 DOM
-
2026-03-11$89,900 Active
ⓘ Source: listings_history table (triggers on properties + properties_extension) + one-shot
backfill from property_details.listing_events for pre-trigger history.
Climate risk First Street
- Flood 1/10 Low FEMA zone X (unshaded) · 0% chance over 30 yrs
- Wildfire 4/10 Moderate
- Heat 10/10 Extreme 6 d/yr ≥106°F today · 20 d/yr by 30 yrs out
- Wind 10/10 Extreme 99% chance of damaging wind over 30 yrs
- Air quality 2/10 Low 1 unhealthy d/yr today · 1 by 30 yrs out
Nearby sold comps map
Loading sold comps map…
Walkable amenities ~0.75 mi
Loading nearby amenities…
Taxation est. · year 1
- Rental income
- $22,226
- − Mortgage interest
- −$5,036
- − Property taxes
- −$1,348
- − Insurance
- −$450
- − Repairs & maintenance
- −$1,778
- − Management
- −$1,778
- − Depreciation
- −$2,615
- Taxable income
- $9,221
- Est. tax owed @ 24.0%
- −$2,213
- After-tax cash flow
- $7,890/yr
For passive investors: Depreciation is non-cash, so a rental often shows a tax loss while cash-flowing — sheltering income. Rental losses are passive: they offset passive income freely, and up to $25,000/yr can offset ordinary (W-2) income if you actively participate and your MAGI is under $100k (phasing out to $0 by $150k); unused losses carry forward. On sale, claimed depreciation is recaptured at up to 25%, and gains may owe capital-gains tax (a 1031 exchange can defer both). Figures are a year-1 estimate at your 24.0% rate — not tax advice; consult a CPA.
Schools (NCES district)
- District
- St. Lucie
- NCES district ID
- 1201770
- Math proficiency
- 40% ▼ -11.00%
- Reading proficiency
- 48% ▼ -4.00%
- Median HH income
- $44,737
- Composite
- 37.28/100
- National rank
- #4449
- State rank
- #51 of 73 in FL
Livability — River Park
- Score
- 69/100
- State rank
- #451
- US rank
- #8159
Category grades
Schools grade is shown separately in the Schools card above.
Census & demographics
- County
- Saint Lucie County · 337,150 people
- Metro
- Port St. Lucie, FL
- Population (ZIP)
- 42,655
- Household income
- $61,628
- Rent vs Own
- Severe rent burden
- 1759.0
Population outlook (St. Lucie County) Hauer SSP2
- Today (2025)
- 338,016 people
- By 2030
- 355,687 · +5.2%
- By 2040
- 385,521 · +14.1%
- By 2050
- 406,106 · +20.1%
- By 2075
- 441,054 · +30.5%
- By 2100
- 436,885 · +29.2%
Race, ethnicity, and origin ACS 2023
- Neighborhood character
- Diverse neighborhood (Simpson 0.57)
- Race & ethnicity
- White 62% Hispanic / Latino 19% Two or more races 14% Black 10% Asian 3%
- Hispanic origin (detail)
- Mexican 4% Puerto Rican 4% Cuban 2% Dominican 2%
- Common ancestry
- Romanian 3% Lithuanian 2% Hispanic 1%
- Foreign-born
- 18% · Canada, Jamaica, China
- Languages at home
- 76% English-only · Spanish 16% French/Haitian/Cajun 3% Tagalog/Filipino 2%
Political lean MEDSL · St. Lucie
- 2024 margin
- Lean R (+9.1) · D 45.1% · R 54.2%
- 2008→2024 swing
- -21.2pp toward R · 2008: 12.1pp · 2024: -9.1pp
- All cycles
- 2024: R+9.1 2020: R+1.6 2016: R+2.5 2012: D+7.9 2008: D+12.1
Not yet ingested
- Civics
- —
Market trends
- HPI YoY
- ▼ -155.80%
- Current HPI
- 371.0573
- Rent YoY
- ▲ 1.92%
- Metro
- Port St. Lucie, FL
- State GDP YoY
- ▲ 3.28%
- F500 in state
- 36
Industry mix (Fortune 500 HQ in FL)
| Industry | F500 HQs | Revenue |
|---|---|---|
| Industrial Technology | 2 | $29B |
|
||
| Insurance | 2 | $17B |
|
||
| Retail | 1 | $60B |
|
||
| Technology Distribution | 1 | $58B |
|
||
| Homebuilding | 1 | $35B |
|
||
| Technology Manufacturing | 1 | $35B |
|
||
Price history
1 event — show timeline
- 2026-03-11 Listed $89,900 Beaches MLS
Cash-flow waterfall
monthlySold comps — $/sqft
last 12 mo · ≤1 miLoading sold comps…