1025 NE 58th Ln · Ankeny, IA
Flood risk 1/10 · Minimal
- FEMA flood zone
- X (unshaded)
- Chance of flooding over 30 yrs
- 0.0%
- Est. flood insurance / yr
- $507 – $1,088
Fire risk 2/10 · Minimal
- Est. fire insurance / yr
- $902 – $1,676
Heat risk 3/10 · Minor
- Hot days now (above 103°F)
- 7 days/yr
- Hot days in 30 yrs
- 15 days/yr
Wind risk 2/10 · Minimal
- Chance of severe wind over 30 yrs
- —
Air-quality risk 2/10 · Minimal
- Unhealthy air days now
- 0 days/yr
- Unhealthy air days in 30 yrs
- 1 days/yr
Risk factors via First Street. Map © Google.
Why this score? — see what drove the D grade
The composite is a weighted blend of 9 inputs, each scored 0–100. Each bar is that input's sub-score; the figure is the points it added to the 100-point composite (weight × sub-score).
- Cash flow +8.1/30.0
- ARV discount +7.5/15.0
- Schools +7.5/10.0
- Livability +4.6/5.0
- Condition / age +4.0/5.0
- 1% rule +3.7/10.0
- Rent growth +2.7/5.0
- DSCR +2.1/10.0
- Appreciation +0.0/10.0
$224,900
🖨 Deal sheet 📄 Offer letter ✓ Due diligence
Listing remarks MLS
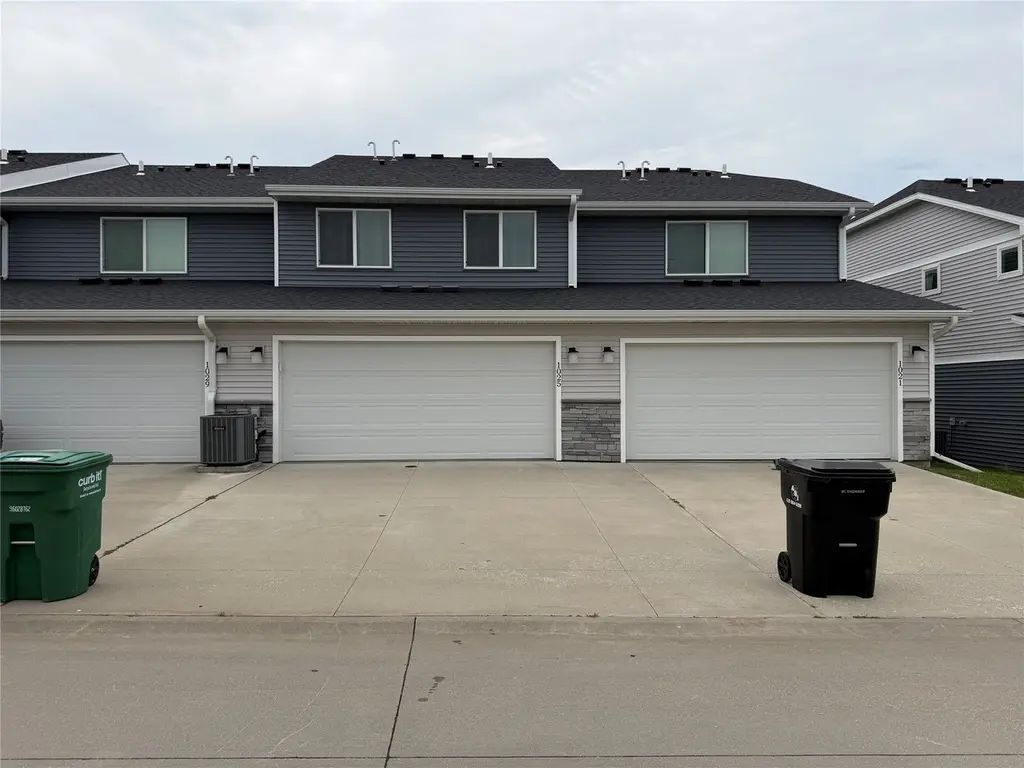
Welcome to Northgate and our new Everly plan by Jerry's Homes, who has been building homes since 1957.Entering the main floor you'll enjoy the popular open floor plan with electric fireplace kitchen w/ white cabinets, breakfast bar plus eating area, quartz counters, tile backsplash, upgraded LVP flooring and 1/2 bath. Plenty of cabinet & closet space throughout. Upstairs are 3 bedrooms, 2 bathrooms & handy laundry room. Convenient attached garage, open patio & maintenance free living where snow removal & yard work is done for you. One year home warranty, washer, dryer & all appliances included. Located in north Ankeny, near I-35 access, Saylorville Lake, shopping and amenities.
Key facts
- $162 HOA
- 2 garage spots
- Built 2020
Property features AI
Finance
- Other: Annual tax information available
- HOA & community: Homeowners association (HOA Management Solutions / NorthGate East Rowhouses Assoc); HOA fee $162 monthly; HOA covers grounds and structure maintenance, snow removal, and trash
Exterior
- Parking: Attached 2-car garage
- Utilities: Public water; Public sewer
- Home design: 2-story property; Asphalt shingle roof
- Construction: Asphalt shingle roof
- Exterior features: Lot zoned residential; Lot dimensions approximately 20 x 122.5
Interior
- Kitchen: Dishwasher; Microwave; Refrigerator; Stove
- Bathrooms: 1 full bathroom; 1 three-quarter bathroom; 1 half bathroom
- Heating & cooling: Forced air heating (natural gas); Central air conditioning
- Interior features: Fireplace (1); Central air
- Laundry & utility: Washer; Dryer
Neighborhood map
What this means for you Summary
Snapshot
- This is a 3-bed/2.5-bath condo listed at $225k. Condition is rated good.
Deal economics
- At list price, monthly cash flow is $-223 ($-3k/yr) — negative.
- To cash-flow at today's rent, offer at most $186k (17.5% below list).
- To meet the 1% rule (rent ≥ 1% of price), the offer needs to be $196k (12.9% below list).
- Recommended offer: $186k (17.5% below list) — sets the bar for cash-flow.
- Cap rate 5.1% vs local median 2.9% in Ankeny — top-decile yield for the area; either an underpriced asset or a hidden risk that comps aren't pricing in. Stress-test before assuming the spread holds.
Location & tenants
- Location reads 92/100 on livability (#3 in IA, #29 nationally) — a professional / high-income tenant draw. Strengths: schools A+, amenities A+, employment A+; Watch: commute C-.
- North Polk Community School District (rural): math 87% / reading 84% proficiency, ranked #7 of 289 in IA (top 2%) — strong family-tenant draw, lease renewals of 3-5y typical; only 9% free/reduced lunch — higher-income household profile.
- Market conditions: Rents flat; 708 active listings in the ZIP; 13 comparable units currently listed for rent nearby; rentals at typical pace (median 24d on market — plan ~3-4 weeks tenant-placement turnaround); solid renter incomes; 2,953 units permitted in Polk County in 2024 (540 in 5+ unit buildings).
Forward outlook
- Local home prices are declining (-3.0%/yr); year-one equity from $2k of loan paydown is wiped out by about $7k of value loss. Plan a longer hold.
- Polk County population projected at +37% by 2050 — long-run rental-demand tailwind backs the buy-and-hold thesis.
Negotiation context
- It's been on market 20 days — a 2% lower offer ($222k) is reasonable based on typical stale-listing flexibility.
- 2 sale attempts since 6y ago with the ask held roughly flat each time — persistent listings suggest the price (not the market) is what's stuck; bring a comps-based counter.
Questions for the listing agent
- What do current leases actually rent for vs. the listed asking? Can we see a recent rent roll and the last 12 months of T-12 income?
- What does the HOA fee cover, when was the last increase, and are there any pending special assessments or reserve-fund shortfalls?
- Any open or pending special assessments — roof, HVAC, plumbing, elevator, façade? What's the per-unit balance and payoff schedule, and is the seller paying it off at close or rolling it to the buyer?
- Is there a deadline driving the sale (1031 exchange, divorce, estate, relocation)? That informs how much negotiation room exists.
- Schools are A-rated — typically a magnet for longer-tenancy family renters. What's the average tenant stay here, and is there a school-zone premium baked into asking?
- The area grade is low — what's the realistic commute time and amenity access for the typical tenant pool here? Any planned neighborhood developments (good or bad) we should know about?
- What's the average days-on-market for RENTAL listings here right now (not sales)? A rising rental-DOM trend means longer vacancies and softer asking-rent achievability than the comps imply.
- What's the recent tenant-quality profile in this submarket — average credit score on applications, eviction rate, late-payment / NSF rate, and stable-employment percentage? A property-management company in the area should have these aggregated.
- How much new apartment / multifamily construction is in the pipeline within 1–3 miles? Heavy new supply (>2% of stock underway) typically softens rents 12–24 months out; light construction supports rent growth.
Investment metrics
- 1% rule
- 0.87% ✗
- Cap rate
- 5.10%
- Cash-on-cash
- -4.25%
- DSCR
- 0.81
- GRM
- 9.6
CMA / ARV
No comps found within radius.
Projected returns pro-forma
-3.0% appreciation · 0.92% rent growth · sell at horizon
- IRR
- -26.1%
- Equity multiple
- 0.13×
- Total profit
- $-54,497
- Equity at exit
- $33,533
- IRR
- -32.9%
- Equity multiple
- -0.28×
- Total profit
- $-80,883
- Equity at exit
- $19,445
Cash invested: $62,972 (down + closing). Projections, not guarantees.
Landlord ↔ Tenant lean methodology
- Overall (STATE)
- 83 Strongly Landlord-Friendly
- State Iowa
- 83 Strongly Landlord-Friendly · R+6
- County
- — inherits STATE
- City
- — inherits STATE
ZIP-level market 50021
- Rents YoY
- 0.9%
- Active inventory
- 708
- Price-to-rent
- 9.6×
Monthly cashflow live
- Estimated rent
- $1,958 high interval (Pro) →
- Mortgage (P&I)
- −$1,179
- Tax from tax record
- −$335 /mo · $4,016/yr
- Insurance
- −$94
- HOA
- −$162
- Vacancy / Maint / Mgmt
- −$411
- Net cashflow
- $-223
Break-even live
UW: 25.0% down · 7.5% · 30yr · 1.5% tax · 5.0% vac · 8.0% maint · 8.0% mgmt
Financing live
Cash to close
- Down payment
- $56,225
- Closing costs
- $6,747
- Reserves months
- —
- Total cash needed
- —
Loan-product check · same deal, 3 products live
Conventional
25% down · 7.5% · 30yr
- Down + closing
- —
- Monthly P&I
- —
- Monthly cashflow
- —
- DSCR
- —
- Eligible?
- —
Personal DTI + credit; lowest rate.
DSCR
20% down · 8.5% · 30yr
- Down + closing
- —
- Monthly P&I
- —
- Monthly cashflow
- —
- DSCR
- —
- Eligible?
- —
No personal income docs; deal must DSCR.
Hard money
10% down · 12.0% · 12mo
- Down + closing
- —
- Monthly P&I
- —
- Monthly cashflow
- —
- DSCR
- —
- Eligible?
- —
Short-term bridge; refi at stabilization.
Rent comps 13 comps
| Address | Beds | Baths | Sqft | Rent | $/sqft | DOM | Units | Dist |
|---|---|---|---|---|---|---|---|---|
| 1424 NE 56th Ln Ankeny, IA | 4.0 | 2.5 | 1658 | $2,300 | $1.39 | 14d | 6 | 0.16mi |
| 4543 NE McDougal Ln Ankeny, IA | 3.0 | 3.5 | 1520 | $1,895 | $1.25 | 14d | 1 | 0.76mi |
| 3921 NE Gardenia Ln Ankeny, IA | 2.0 | 1.5 | 1300 | $1,595 | $1.23 | 43d | 1 | 1.13mi |
| 110 NE 46th Ln Ankeny, IA | 2.0–3.0 | 2.0 | 1099 | $1,400 | $1.27 | 14d | 3 | 1.14mi |
| 3611 NE Otterview Cir Ankeny, IA | 1.0–2.0 | 1.0–2.0 | 834 | $1,800 | $2.16 | 14d | 20 | 1.29mi |
| 3707 NE Marissa Ln Ankeny, IA | 3.0 | 2.5 | 1480 | $1,795 | $1.21 | 23d | 1 | 1.39mi |
| 3654 NE Kara Ln Ankeny, IA | 2.0 | 2.0 | 1368 | $1,950 | $1.43 | 43d | 1 | 1.40mi |
| 3635 NE Kara Ln Ankeny, IA | 3.0 | 2.0 | 1740 | $1,950 | $1.12 | 23d | 1 | 1.40mi |
| 3619 NE Kara Ln Ankeny, IA | 3.0 | 2.5 | 1700 | $1,950 | $1.15 | 23d | 1 | 1.42mi |
| 3630 NE Kara Ln Ankeny, IA | 2.0 | 2.0 | 1336 | $1,900 | $1.42 | 43d | 1 | 1.42mi |
| 3641 NE Marissa Ln Ankeny, IA | 2.0 | 2.0 | 1336 | $1,900 | $1.42 | 23d | 1 | 1.42mi |
| 3622 NE Kara Ln Ankeny, IA | 3.0 | 2.5 | 1740 | $1,950 | $1.12 | 43d | 1 | 1.43mi |
| 3624 NE Marissa Ln Ankeny, IA | 3.0 | 3.0 | 1740 | $1,950 | $1.12 | 43d | 1 | 1.45mi |
HOA detail condo
- Monthly dues
- $162 · $1,944/yr
- Likely covers
- electricsnow removal
- Assessments
- None detected in remarks — confirm with the listing agent.
Listing history 17 events
-
2026-06-18days on market $224,900 Active 20 DOM
-
2026-06-17days on market $224,900 Active 19 DOM
-
2026-06-16days on market $224,900 Active 18 DOM
-
2026-06-15days on market $224,900 Active 17 DOM
-
2026-06-14days on market $224,900 Active 15 DOM
-
2026-06-13days on market $224,900 Active 14 DOM
-
2026-06-10days on market $224,900 Active 12 DOM
-
2026-06-09days on market $224,900 Active 11 DOM
-
2026-06-08days on market $224,900 Active 10 DOM
-
2026-06-07days on market $224,900 Active 9 DOM
-
2026-06-05days on market $224,900 Active 6 DOM
-
2026-06-03days on market $224,900 Active 5 DOM
-
2026-06-02days on market $224,900 Active 4 DOM
-
2026-06-01days on market $224,900 Active 3 DOM
-
2026-05-31days on market $224,900 Active 2 DOM
-
2026-05-31remarks 196-char remark
-
2026-05-31$224,900 Active 1 DOM
ⓘ Source: listings_history table (triggers on properties + properties_extension) + one-shot
backfill from property_details.listing_events for pre-trigger history.
Tax reassessment forecast IA · Partial reset (capped growth)
- Current annual tax
- $4,016 · $335/mo
- Projected year-2 tax
- $4,016 · $335/mo
- Expected delta
- $0/yr ($0/mo · 0.0%)
ⓘ Screening estimate from a state-policy table — verify with the county assessor before closing.
Climate risk First Street
- Flood 1/10 Low FEMA zone X (unshaded) · 0% chance over 30 yrs
- Wildfire 2/10 Low
- Heat 3/10 Moderate 7 d/yr ≥103°F today · 15 d/yr by 30 yrs out
- Wind 2/10 Low
- Air quality 2/10 Low 0 unhealthy d/yr today · 1 by 30 yrs out
Nearby sold comps map
Loading sold comps map…
Walkable amenities ~0.75 mi
Loading nearby amenities…
Taxation est. · year 1
- Rental income
- $23,496
- − Mortgage interest
- −$12,598
- − Property taxes
- −$4,016
- − Insurance
- −$1,124
- − Repairs & maintenance
- −$1,880
- − Management
- −$1,880
- − HOA
- −$1,944
- − Depreciation
- −$6,543
- Taxable loss
- −$6,489
- Est. tax savings @ 24.0%
- +$1,557
- After-tax cash flow
- $-1,118/yr
For passive investors: Depreciation is non-cash, so a rental often shows a tax loss while cash-flowing — sheltering income. Rental losses are passive: they offset passive income freely, and up to $25,000/yr can offset ordinary (W-2) income if you actively participate and your MAGI is under $100k (phasing out to $0 by $150k); unused losses carry forward. On sale, claimed depreciation is recaptured at up to 25%, and gains may owe capital-gains tax (a 1031 exchange can defer both). Figures are a year-1 estimate at your 24.0% rate — not tax advice; consult a CPA.
Condition & rehab AI · 12 photos
This 3-bedroom, 2.5-bathroom townhome is in good condition with modern updates and a good condition score. It's move-in ready with minor cosmetic improvements needed for optimal curb appeal and value.
Value-add opportunities
- Both Paint exterior trim — Enhances curb appeal and value
- Both Clean gutters — Improves drainage and property value
Renovation cost estimate screening
Value-add ROI direction
- Both Paint exterior trim — Enhances curb appeal and value ↑
- Both Clean gutters — Improves drainage and property value ↑
ⓘ Cost ranges are severity-bucket heuristics (US national rule-of-thumb). Get contractor quotes + a written scope before underwriting a rehab budget.
Schools (NCES district)
- District
- North Polk Community School District
- NCES district ID
- 1920910
- Math proficiency
- 87% ▼ -2.00%
- Reading proficiency
- 84% ▼ -3.00%
- Median HH income
- $80,205
- Composite
- 75.13/100
- National rank
- #140
- State rank
- #7 of 289 in IA
Livability — Ankeny
- Score
- 92/100
- State rank
- #3
- US rank
- #29
Category grades
Schools grade is shown separately in the Schools card above.
Census & demographics
- Census place
- Ankeny, IA
- County
- Polk County · 453,298 people
- City population
- 76,589
- Metro
- Des Moines-West Des Moines, IA
- Population (ZIP)
- 30,283
- Household income
- $99,572
- Rent vs Own
- Severe rent burden
- 472.0
Population outlook (Polk County) Hauer SSP2
- Today (2025)
- 548,042 people
- By 2030
- 588,557 · +7.4%
- By 2040
- 670,629 · +22.4%
- By 2050
- 752,830 · +37.4%
- By 2075
- 955,069 · +74.3%
- By 2100
- 1,115,436 · +103.5%
Race, ethnicity, and origin ACS 2023
- Neighborhood character
- Predominantly White (84%)
- Race & ethnicity
- White 84% Hispanic / Latino 6% Black 5% Two or more races 4% Asian 3%
- Hispanic origin (detail)
- Mexican 5%
- Common ancestry
- Italian 5% Portuguese 4% Iranian 3%
- Foreign-born
- 6% · Canada, South Korea, Jamaica
- Languages at home
- 91% English-only · Spanish 5% Russian/Polish/Slavic 1% Other Asian/Pacific 1%
Political lean MEDSL · Polk
- 2024 margin
- D (+10.9) · D 54.8% · R 43.9% · Other 1.3%
- 2008→2024 swing
- -3.7pp toward R · 2008: 14.6pp · 2024: 10.9pp
- All cycles
- 2024: D+10.9 2020: D+15.2 2016: D+11.5 2012: D+14.2 2008: D+14.6
Not yet ingested
- Civics
- —
Market trends
- HPI YoY
- ▼ -150.38%
- Current HPI
- 208.945
- Rent YoY
- ▲ 0.92%
- Metro
- Des Moines-West Des Moines, IA
- State GDP YoY
- ▲ 2.48%
- F500 in state
- 4
Industry mix (Fortune 500 HQ in IA)
| Industry | F500 HQs | Revenue |
|---|---|---|
| Financial Services | 1 | $16B |
|
||
| Retail / Convenience | 1 | $15B |
|
||
Price history
+16.5% since first listed9 events — show timeline
- 2026-05-29 Listed $224,900 DMMLS
- 2021-06-30 Sold (MLS) $197,201 DMMLS
- 2021-04-02 Pending — DMMLS
- 2021-03-10 Price Changed $197,201 DMMLS
- 2021-01-23 Price Changed $195,201 DMMLS
- 2021-01-20 Price Changed $196,201 DMMLS
- 2021-01-06 Price Changed $193,201 DMMLS
- 2020-12-21 Price Changed $192,731 DMMLS
- 2020-09-21 Listed $192,981 DMMLS
Property tax history
+357.7%/yrLatest (2025): $4,016 · +2.3% YoY. Source: county tax records.
Cash-flow waterfall
monthlySold comps — $/sqft
last 12 mo · ≤1 miLoading sold comps…