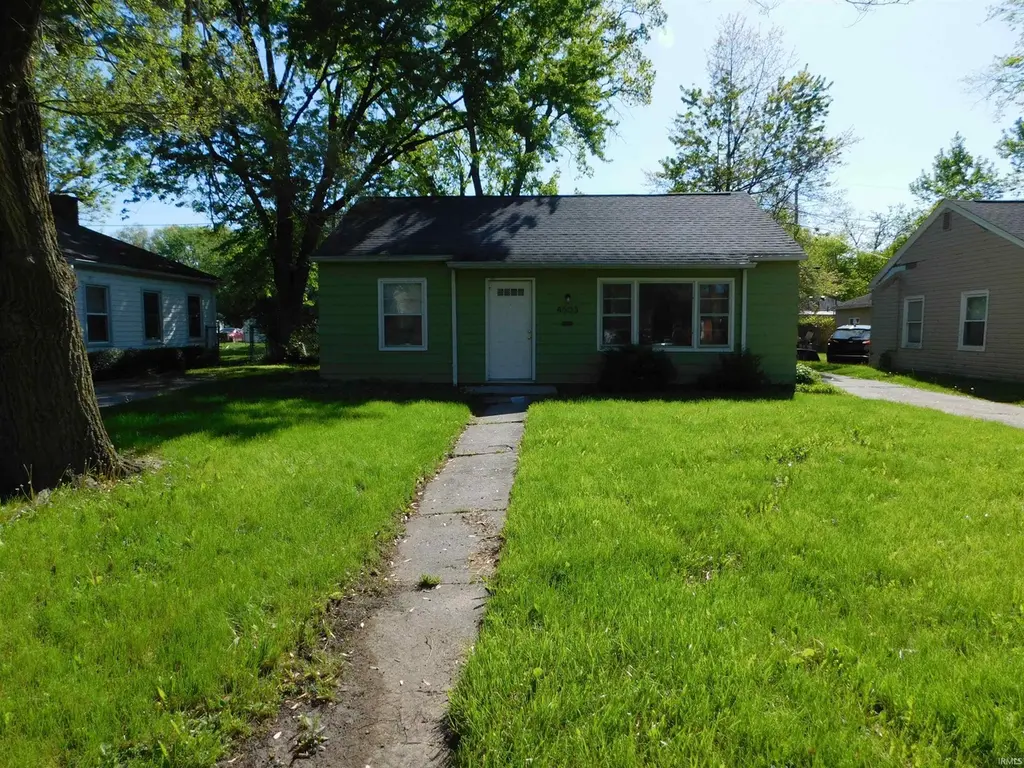
4503 Standish Dr · Fort Wayne, IN
Flood risk 1/10 · Minimal
- FEMA flood zone
- X (unshaded)
- Chance of flooding over 30 yrs
- 0.0%
- Est. flood insurance / yr
- $507 – $1,088
Fire risk 1/10 · Minimal
- Est. fire insurance / yr
- $717 – $1,331
Heat risk 3/10 · Minor
- Hot days now (above 100°F)
- 7 days/yr
- Hot days in 30 yrs
- 17 days/yr
Wind risk 2/10 · Minimal
- Chance of severe wind over 30 yrs
- —
Air-quality risk 3/10 · Minor
- Unhealthy air days now
- 2 days/yr
- Unhealthy air days in 30 yrs
- 3 days/yr
Risk factors via First Street. Map © Google.
Why this score? — see what drove the D+ grade
The composite is a weighted blend of 9 inputs, each scored 0–100. Each bar is that input's sub-score; the figure is the points it added to the 100-point composite (weight × sub-score).
- Cash flow +16.9/30.0
- ARV discount +7.5/15.0
- DSCR +5.3/10.0
- 1% rule +4.7/10.0
- Livability +4.2/5.0
- Rent growth +3.7/5.0
- Schools +3.6/10.0
- Condition / age +2.5/5.0
- Appreciation +0.0/10.0
$119,000
🖨 Deal sheet (PDF) 📄 Offer letter ✓ Due diligence
Listing remarks MLS
Great Rental home. Very Long Term Tenant. Great layout with two living spaces, large 2 car Garage, fenced in back yard. Tear-Off Roof, Furnace, Water Heater all new in thelast 5yrs. Start making money instantly!
Key facts
- 6,273 sq ft lot
- Parking
- Built 1950
Property features AI
Exterior
- Parking: 1 open parking space
- Utilities: Public water; Public sewer
- Home design: Residential income property; Single-story; Other property subtype
- Construction: Aluminum siding; Slab foundation
- Exterior features: Level lot; Chain-link fencing
Interior
- Flooring: Vinyl
- Bathrooms: 1 full bathroom; 3 main-level bathrooms
- Heating & cooling: Forced air heating (natural gas); Window air conditioning units
- Interior features: Vinyl flooring
- Laundry & utility: Washer hookup
Neighborhood map
What this means for you Summary
Snapshot
- This is a 3-bed/1.0-bath single-family listed at $119k.
Deal economics
- At list price, monthly cash flow is $79 ($947/yr) — positive.
- The deal already cash-flows at list — no discount required.
- To meet the 1% rule (rent ≥ 1% of price), the offer needs to be $116k (2.9% below list).
- Recommended offer: $115k (3.0% below list) — sets the bar for market timing.
- Cap rate 7.1% vs local median 4.7% in Fort Wayne — top-decile yield for the area; either an underpriced asset or a hidden risk that comps aren't pricing in. Stress-test before assuming the spread holds.
Location & tenants
- Location reads 84/100 on livability (#6 in IN, #676 nationally) — a professional / high-income tenant draw. Strengths: amenities A+, commute A+, cost of living A+; Watch: crime C-, employment D+.
- East Allen County Schools (suburban): math 36% / reading 47% proficiency, ranked #122 of 301 in IN (top 40%) — families likely to look elsewhere, expect single-tenant / working-renter base with shorter leases.
- Zoned schools: Southwick Elementary School (606 students, 89% FRL); Paul Harding Jr High School (math 11% / reading 25%, grade F, #279 of 330 statewide, top 86%, 430 students, 88% FRL); New Haven Jr/Sr High School (math 21% / reading 50%, grade F, #263 of 369 statewide, top 72%, 1,494 students, 67% FRL) — zoned schools average 81% FRL vs 43% district-wide (38 pts higher); higher-poverty schools than district average — tighter screening recommended.
- Zoned-school proficiency averages 27% at this address vs 42% district-wide (-15 pts) — the specific schools serving this property underperform the East Allen County Schools average; the district grade overstates school quality for this exact location.
- Market conditions: Rents rising fast (+4.9%/yr); 133 active listings in the ZIP; 22 comparable units currently listed for rent nearby; rentals at typical pace (median 23d on market — plan ~3-4 weeks tenant-placement turnaround); 1,861 units permitted in Allen County in 2024 (576 in 5+ unit buildings).
Forward outlook
- Local home prices are declining (-3.0%/yr); year-one equity from $823 of loan paydown is wiped out by about $4k of value loss. Plan a longer hold.
- Allen County population projected at +10% by 2050 — modest demand growth; plan on rents tracking national, not racing it.
Negotiation context
- It's been on market 51 days — a 3% lower offer ($115k) is reasonable based on typical stale-listing flexibility.
- 4 sale attempts since 6y ago with the ask held roughly flat each time — persistent listings suggest the price (not the market) is what's stuck; bring a comps-based counter.
- Current owner paid $49k; list at $119k implies a 143% gain — meaningful room to come down on a strong offer.
Risks & watch-outs
- Watch-outs: built in 1950 — expect roof / HVAC / electrical / plumbing capex.
Questions for the listing agent
- It's been on market 51 days. Have you received any prior offers? Is the seller open to a 3% concession, seller financing, or rate buy-down credit?
- Built in 1950 — when were the roof, HVAC, electrical panel, plumbing, and water heater last replaced?
- Is there a deadline driving the sale (1031 exchange, divorce, estate, relocation)? That informs how much negotiation room exists.
- Schools are D-rated, which usually means shorter tenancies and higher turnover. Who's the typical renter profile here, and what's been the actual vacancy rate?
- The area grade is low — what's the realistic commute time and amenity access for the typical tenant pool here? Any planned neighborhood developments (good or bad) we should know about?
- What's the average days-on-market for RENTAL listings here right now (not sales)? A rising rental-DOM trend means longer vacancies and softer asking-rent achievability than the comps imply.
- What's the recent tenant-quality profile in this submarket — average credit score on applications, eviction rate, late-payment / NSF rate, and stable-employment percentage? A property-management company in the area should have these aggregated.
- How much new for-sale + rental construction is in the pipeline within 1–3 miles? Heavy new supply typically softens prices + rents 12–24 months out; constrained supply supports both.
Investment metrics
- 1% rule
- 0.97% ✗
- Cap rate
- 7.09%
- Cash-on-cash
- 2.84%
- DSCR
- 1.13
- GRM
- 8.6
CMA / ARV
- ARV (median comp)
- $73,475
- List price
- $119,000
- Delta
- 61.96%
- Verdict
- OVERPRICED
- Comps
- 4 within 1.0 mi
Show comp detail 12 sales within ~0.75 mi
| Address | Dist | Beds/Ba | Sqft | Sold | Price | $/sf | Match |
|---|---|---|---|---|---|---|---|
| 4505 Plaza Dr | 0.10mi | 3/1.0 | 1,184 (+1%) | 2mo | $79,000 | $67 | 91 |
| 4915 Plaza Dr | 0.30mi | 3/1.0 | 1,088 (-7%) | 4mo | $155,000 | $142 | 71 |
| 4502 Winter St | 0.44mi | 3/1.0 | 1,107 (-6%) | 0mo | $145,000 | $131 | 70 |
| 4926 Plaza Dr | 0.31mi | 3/2.0 | 1,315 (+12%) | 1mo | $229,900 | $175 | 60 |
| 4921 Devonshire Dr | 0.60mi | 3/2.5 | 1,192 (+2%) | 5mo | $135,000 | $113 | 59 |
| 1515 E Rudisill Blvd | 0.71mi | 3/1.0 | 1,125 (-4%) | 2mo | $114,900 | $102 | 58 |
| 4310 Lillie St | 0.44mi | 3/1.0 | 1,290 (+10%) | 6mo | $120,000 | $93 | 58 |
| 4523 Bowser Ave | 0.60mi | 3/2.0 | 1,225 (+4%) | 6mo | $150,000 | $122 | 56 |
| 4126 Bowser Ave | 0.73mi | 3/1.0 | 1,096 (-6%) | 3mo | $130,000 | $119 | 52 |
| 4765 Bowser Ave | 0.59mi | 4/2.0 (+1) | 1,287 (+10%) | 5mo | $165,000 | $128 | 42 |
| 4425 Holton Ave | 0.54mi | 2/1.0 (-1) | 996 (-15%) | 5mo | $55,000 | $55 | 41 |
| 5006 Hessen Cassel Rd | 0.64mi | 3/1.5 | 1,344 (+15%) | 5mo | $195,000 | $145 | 39 |
Match score weights: distance 35% · size 25% · config 20% · recency 20%. Top-matched comps best support the ARV.
Projected returns pro-forma
-3.0% appreciation · 4.93% rent growth · sell at horizon
- IRR
- -9.6%
- Equity multiple
- 0.64×
- Total profit
- $-11,942
- Equity at exit
- $17,743
- IRR
- 2.3%
- Equity multiple
- 1.18×
- Total profit
- $5,942
- Equity at exit
- $10,289
Cash invested: $33,320 (down + closing). Projections, not guarantees.
Landlord ↔ Tenant lean methodology
- Overall (STATE)
- 90 Strongly Landlord-Friendly
- State Indiana
- 90 Strongly Landlord-Friendly · R+11
- County
- — inherits STATE
- City
- — inherits STATE
ZIP-level market 46806
- Home prices YoY
- -33.6%
- Rents YoY
- 4.9%
- Active inventory
- 133
- Price-to-rent
- 8.6×
Monthly cashflow live
- Estimated rent
- $1,156 high interval (Pro) →
- Mortgage (P&I)
- −$624
- Tax from tax record
- −$160 /mo · $1,926/yr
- Insurance
- −$50
- HOA
- −$0
- Vacancy / Maint / Mgmt
- −$243
- Net cashflow
- $79
Break-even live
Sensitivity live
| Price | -10% $146 | -5% $113 | +0% $79 | +5% $45 | +10% $12 |
|---|---|---|---|---|---|
| Rent | -10% $-12 | -5% $33 | +0% $79 | +5% $125 | +10% $170 |
| Rate | -1.0pp $139 | -0.5pp $109 | base $79 | +0.5pp $48 | +1.0pp $17 |
UW: 25.0% down · 7.5% · 30yr · 1.5% tax · 5.0% vac · 8.0% maint · 8.0% mgmt
Financing live
Cash to close
- Down payment
- $29,750
- Closing costs
- $3,570
- Reserves months
- —
- Total cash needed
- —
Loan-product check · same deal, 3 products live
Conventional
25% down · 7.5% · 30yr
- Down + closing
- —
- Monthly P&I
- —
- Monthly cashflow
- —
- DSCR
- —
- Eligible?
- —
Personal DTI + credit; lowest rate.
DSCR
20% down · 8.5% · 30yr
- Down + closing
- —
- Monthly P&I
- —
- Monthly cashflow
- —
- DSCR
- —
- Eligible?
- —
No personal income docs; deal must DSCR.
Hard money
10% down · 12.0% · 12mo
- Down + closing
- —
- Monthly P&I
- —
- Monthly cashflow
- —
- DSCR
- —
- Eligible?
- —
Short-term bridge; refi at stabilization.
Rent comps 22 comps
| Address | Beds | Baths | Sqft | Rent | $/sqft | DOM | Units | Dist |
|---|---|---|---|---|---|---|---|---|
| 4325 Werling Dr Fort Wayne, IN | 1.0–3.0 | 1.0–2.0 | 923 | $1,164 | $1.26 | 45d | 1 | 0.18mi |
| 4705 S Anthony Blvd Fort Wayne, IN | 3.0 | 1.0 | 1110 | $1,050 | $0.95 | 15d | 1 | 0.31mi |
| 3932 Winter St Fort Wayne, IN | 2.0 | 1.0 | 750 | $875 | $1.17 | 45d | 1 | 0.64mi |
| 4129 Bowser Ave Fort Wayne, IN | 3.0 | 1.5 | 850 | $1,250 | $1.47 | 23d | 1 | 0.72mi |
| 4014 Oliver St Fort Wayne, IN | 3.0 | 1.0 | 936 | $1,050 | $1.12 | 15d | 1 | 0.85mi |
| 3410 S Anthony Blvd Fort Wayne, IN | 3.0 | 1.0 | 900 | $1,200 | $1.33 | 45d | 1 | 0.85mi |
| 4522 Spatz Ave Fort Wayne, IN | 2.0 | 1.0 | 840 | $950 | $1.13 | 45d | 1 | 0.88mi |
| 3702 Trace Cir Fort Wayne, IN | 2.0–4.0 | 2.0 | 1571 | $1,903 | $1.21 | 45d | 6 | 0.92mi |
| 4405 S Park Dr Fort Wayne, IN | 2.0 | 1.0 | 1440 | $1,175 | $0.82 | 15d | 1 | 0.93mi |
| 2754 E Paulding Rd Fort Wayne, IN | 1.0–3.0 | 1.0–2.5 | 997 | $1,089 | $1.09 | 15d | 14 | 0.93mi |
| 1023 Hamilton Ave Fort Wayne, IN | 3.0 | 1.0 | 1152 | $1,075 | $0.93 | 15d | 1 | 1.05mi |
| 2903 Queen St Fort Wayne, IN | 3.0 | 2.0 | 1460 | $1,200 | $0.82 | 45d | 1 | 1.14mi |
| 3009 Holton Ave Fort Wayne, IN | 3.0 | 1.0 | 1212 | $1,400 | $1.16 | 15d | 1 | 1.15mi |
| 4121 Monroe St Fort Wayne, IN | 2.0 | 1.0 | 725 | $1,100 | $1.52 | 15d | 1 | 1.17mi |
| 2720 Queen St Fort Wayne, IN | 3.0 | 2.0 | 1316 | $1,395 | $1.06 | 15d | 1 | 1.22mi |
| 4655 Avondale Dr Fort Wayne, IN | 2.0 | 1.0 | 768 | $875 | $1.14 | 45d | 1 | 1.24mi |
| 1024 Colerick St Fort Wayne, IN | 4.0 | 1.0 | 1388 | $1,065 | $0.77 | 23d | 1 | 1.31mi |
| 4331 Lafayette St Fort Wayne, IN | 2.0 | 1.0 | 810 | $925 | $1.14 | 15d | 1 | 1.32mi |
| 1004 Fayette Dr Fort Wayne, IN | 1.0–2.0 | 1.0 | 679 | $1,199 | $1.76 | 15d | 18 | 1.36mi |
| 4126 Lafayette St Fort Wayne, IN | 2.0 | 1.0 | 775 | $1,275 | $1.65 | 45d | 1 | 1.37mi |
| 3801 Lafayette St Fort Wayne, IN | 2.0 | 1.0 | 1116 | $995 | $0.89 | 15d | 1 | 1.43mi |
| 4018 S Clinton St Fort Wayne, IN | 3.0 | 1.0 | 860 | $1,000 | $1.16 | 23d | 1 | 1.48mi |
Listing history 22 events
-
2026-06-21days on market $119,000 Active 51 DOM
-
2026-06-18days on market $119,000 Active 48 DOM
-
2026-06-17days on market $119,000 Active 47 DOM
-
2026-06-16days on market $119,000 Active 46 DOM
-
2026-06-15days on market $119,000 Active 45 DOM
-
2026-06-14days on market $119,000 Active 43 DOM
-
2026-06-13pricedays on market $119,000 Active 42 DOM
-
2026-06-10days on market $125,000 Active 40 DOM
-
2026-06-09days on market $125,000 Active 39 DOM
-
2026-06-08days on market $125,000 Active 38 DOM
-
2026-06-07days on market $125,000 Active 37 DOM
-
2026-06-03days on market $125,000 Active 33 DOM
-
2026-06-02days on market $125,000 Active 32 DOM
-
2026-06-01days on market $125,000 Active 31 DOM
-
2026-05-31days on market $125,000 Active 30 DOM
-
2026-05-30days on market $125,000 Active 29 DOM
-
2026-05-01$125,000 Active 111-char remark
-
2024-06-29historical $1,100
-
2024-05-23$1,100
-
2020-08-25soldstatus $49,000
Show marketing remark (211 chars)
Great Rental home. Very Long Term Tenant. Great layout with two living spaces, large 2 car Garage, fenced in back yard. Tear-Off Roof, Furnace, Water Heater all new in thelast 5yrs. Start making money instantly!
-
2020-07-30$54,900
Show marketing remark (211 chars)
Great Rental home. Very Long Term Tenant. Great layout with two living spaces, large 2 car Garage, fenced in back yard. Tear-Off Roof, Furnace, Water Heater all new in thelast 5yrs. Start making money instantly!
-
2020-07-30$54,900
Show marketing remark (211 chars)
Great Rental home. Very Long Term Tenant. Great layout with two living spaces, large 2 car Garage, fenced in back yard. Tear-Off Roof, Furnace, Water Heater all new in thelast 5yrs. Start making money instantly!
ⓘ Source: listings_history table (triggers on properties + properties_extension) + one-shot
backfill from property_details.listing_events for pre-trigger history.
Tax reassessment forecast IN · Partial reset (capped growth)
- Current annual tax
- $1,926 · $160/mo
- Projected year-2 tax
- $1,926 · $160/mo
- Expected delta
- $0/yr ($0/mo · 0.0%)
ⓘ Screening estimate from a state-policy table — verify with the county assessor before closing.
Climate risk First Street
- Flood 1/10 Low FEMA zone X (unshaded) · 0% chance over 30 yrs
- Wildfire 1/10 Low
- Heat 3/10 Moderate 7 d/yr ≥100°F today · 17 d/yr by 30 yrs out
- Wind 2/10 Low
- Air quality 3/10 Moderate 2 unhealthy d/yr today · 3 by 30 yrs out
Nearby sold comps map
Loading sold comps map…
Walkable amenities ~0.75 mi
Loading nearby amenities…
Taxation est. · year 1
- Rental income
- $13,870
- − Mortgage interest
- −$6,666
- − Property taxes
- −$1,926
- − Insurance
- −$595
- − Repairs & maintenance
- −$1,110
- − Management
- −$1,110
- − Depreciation
- −$3,462
- Taxable loss
- −$998
- Est. tax savings @ 24.0%
- +$240
- After-tax cash flow
- $1,187/yr
For passive investors: Depreciation is non-cash, so a rental often shows a tax loss while cash-flowing — sheltering income. Rental losses are passive: they offset passive income freely, and up to $25,000/yr can offset ordinary (W-2) income if you actively participate and your MAGI is under $100k (phasing out to $0 by $150k); unused losses carry forward. On sale, claimed depreciation is recaptured at up to 25%, and gains may owe capital-gains tax (a 1031 exchange can defer both). Figures are a year-1 estimate at your 24.0% rate — not tax advice; consult a CPA.
Schools (NCES district)
- District
- East Allen County Schools
- NCES district ID
- 1802850
- Math proficiency
- 36% ▼ -8.00%
- Reading proficiency
- 47% ▼ -4.00%
- Median HH income
- $50,524
- Composite
- 35.75/100
- National rank
- #4849
- State rank
- #122 of 301 in IN
Livability — Fort Wayne
- Score
- 84/100
- State rank
- #6
- US rank
- #676
Category grades
Schools grade is shown separately in the Schools card above.
Census & demographics
- Census place
- Fort Wayne, IN
- County
- Allen County · 326,813 people
- Metro
- Fort Wayne, IN
- Population (ZIP)
- 26,425
- Household income
- $47,895
- Rent vs Own
- Severe rent burden
- 1184.0
Population outlook (Allen County) Hauer SSP2
- Today (2025)
- 394,020 people
- By 2030
- 405,128 · +2.8%
- By 2040
- 423,476 · +7.5%
- By 2050
- 435,137 · +10.4%
- By 2075
- 450,293 · +14.3%
- By 2100
- 424,101 · +7.6%
Race, ethnicity, and origin ACS 2023
- Neighborhood character
- Highly diverse neighborhood (Simpson 0.74)
- Race & ethnicity
- Black 37% Hispanic / Latino 26% White 21% Asian 12% Two or more races 11% Native American 2%
- Hispanic origin (detail)
- Mexican 18% Puerto Rican 1%
- Common ancestry
- Italian 1% Romanian 1% Lithuanian 1%
- Foreign-born
- 19% · Canada, Philippines, South Korea
- Languages at home
- 71% English-only · Spanish 19% Other Asian/Pacific 9%
Political lean MEDSL · Allen
- 2024 margin
- R (+12.5) · D 42.9% · R 55.4% · Other 1.7%
- 2008→2024 swing
- -8.1pp toward R · 2008: -4.3pp · 2024: -12.5pp
- All cycles
- 2024: R+12.5 2020: R+11.2 2016: R+19.6 2012: R+16.8 2008: R+4.3
Not yet ingested
- Civics
- —
Market trends
- HPI YoY
- ▼ -148.00%
- Current HPI
- 291.8198
- Rent YoY
- ▲ 4.93%
- Metro
- Fort Wayne, IN
- State GDP YoY
- ▲ 2.90%
- F500 in state
- 18
Industry mix (Fortune 500 HQ in IN)
| Industry | F500 HQs | Revenue |
|---|---|---|
| Industrial Machinery | 2 | $37B |
|
||
| Healthcare | 1 | $177B |
|
||
| Pharmaceuticals | 1 | $45B |
|
||
| Metals / Steel | 1 | $18B |
|
||
| Agriculture | 1 | $17B |
|
||
| Packaging | 1 | $12B |
|
||
Price history
+116.8% since first listed7 events — show timeline
- 2026-06-11 Price Changed $119,000 IRMLS
- 2026-05-01 Listed $125,000 IRMLS
- 2024-06-29 Rental Removed $1,100 APPFOLIO
- 2024-05-23 Listed for Rent $1,100 APPFOLIO
- 2020-08-25 Sold (MLS) $49,000 IRMLS
- 2020-07-30 Listed $54,900 IRMLS
- 2020-07-30 Listed $54,900 IRMLS
Property tax history
+10.2%/yrLatest (2024): $1,926 · +15.2% YoY. Source: county tax records.
Cash-flow waterfall
monthlySold comps — $/sqft
last 12 mo · ≤1 miLoading sold comps…