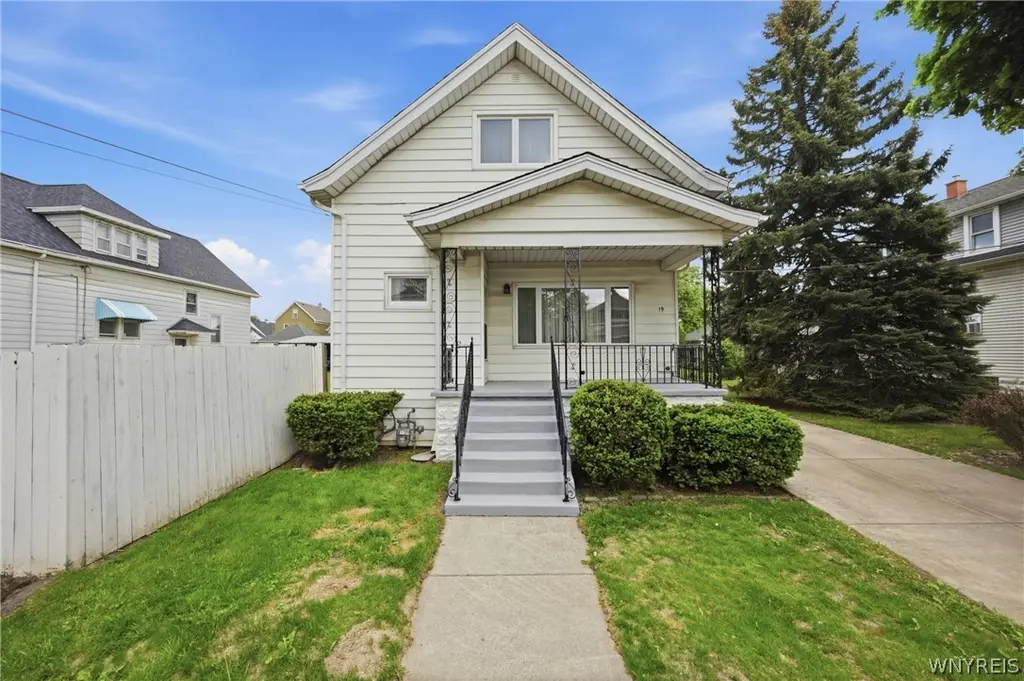
19 Reo Ave · Cheektowaga, NY
Flood risk 1/10 · Minimal
- FEMA flood zone
- X (unshaded)
- Chance of flooding over 30 yrs
- 0.0%
- Est. flood insurance / yr
- $507 – $1,088
Fire risk 1/10 · Minimal
- Est. fire insurance / yr
- $691 – $1,283
Heat risk 3/10 · Minor
- Hot days now (above 93°F)
- 7 days/yr
- Hot days in 30 yrs
- 15 days/yr
Wind risk 1/10 · Minimal
- Chance of severe wind over 30 yrs
- —
Air-quality risk 3/10 · Minor
- Unhealthy air days now
- 2 days/yr
- Unhealthy air days in 30 yrs
- 3 days/yr
Risk factors via First Street. Map © Google.
Why this score? — see what drove the C- grade
The composite is a weighted blend of 9 inputs, each scored 0–100. Each bar is that input's sub-score; the figure is the points it added to the 100-point composite (weight × sub-score).
- ARV discount +15.0/15.0
- Cash flow +10.8/30.0
- Appreciation +6.0/10.0
- 1% rule +4.6/10.0
- Livability +4.2/5.0
- DSCR +3.1/10.0
- Schools +2.8/10.0
- Rent growth +2.5/5.0
- Condition / age +2.5/5.0
$155,900
🖨 Deal sheet (PDF) 📄 Offer letter ✓ Due diligence
Listing remarks
Welcome to 19 Reo Avenue! This long-time family-owned home has been lovingly maintained for generations. This property sits on a double lot and features spacious living areas with 3 bedrooms plus 2 bonus rooms, offering the potential for an additional bedroom and office. There is plenty of room to spread out and make it your own. This property also features hardwood flooring and leaded glass window. Additionally, a 2 1/2-car garage provides plenty of off-street parking. Even though this is an Estate Sale, records show that the roof was replaced in 2022 and the hot water tank in 2019. This property is located in the Cheektowaga Central School District and Cheektowaga Town Park neighborhood,
Key facts
- Hardwood flooring
- Off street parking
- Double lot
Tags
Property features AI
Finance
- HOA & community: Community pool access
Exterior
- Parking: Detached garage with electricity; Detached 2-car garage
- Utilities: Cable available; Public water (connected); Sewer connected; Circuit breaker electric service
- Home design: Single-story listing (home has multiple levels of living space); Aluminum siding; Asphalt roof; Block foundation; Resale property; City street frontage; Rectangular residential lot near public transit
- Construction: Aluminum siding construction; Asphalt roof; Block foundation; Existing (not new construction)
- Exterior features: Concrete driveway; Partial fencing; Fence; Open porch
Interior
- Kitchen: Electric oven; Electric range; Eat-in kitchen layout
- Bedrooms: One main-level bedroom; Two second-level bedrooms
- Flooring: Carpet; Hardwood; Laminate; Vinyl; Varied flooring
- Bathrooms: One full bathroom (main level)
- Heating & cooling: Gas heating; Baseboard heating; Window air conditioning units
- Interior features: Drapes and window treatments; Cedar closet(s); Eat-in kitchen; Bonus room; Full basement with sump pump
- Laundry & utility: Gas water heater
Neighborhood map
What this means for you Summary
Snapshot
- This is a 3-bed/1.0-bath single-family listed at $156k.
Deal economics
- At list price, monthly cash flow is $-72 ($-867/yr) — negative.
- To cash-flow at today's rent, offer at most $143k (8.2% below list).
- To meet the 1% rule (rent ≥ 1% of price), the offer needs to be $150k (3.5% below list).
- Recommended offer: $143k (8.2% below list) — sets the bar for cash-flow.
- Cap rate 5.7% vs local median 3.8% in Cheektowaga — top-decile yield for the area; either an underpriced asset or a hidden risk that comps aren't pricing in. Stress-test before assuming the spread holds.
Location & tenants
- Location reads 84/100 on livability (#54 in NY, #811 nationally) — a professional / high-income tenant draw. Strengths: commute A+, housing A+, health & safety A+; Watch: crime C-.
- Cheektowaga Central School District (urban): math 30% / reading 37% proficiency, ranked #564 of 590 in NY (top 96%) — families likely to look elsewhere, expect single-tenant / working-renter base with shorter leases.
- Zoned schools: Union East Elementary School (math 19% / reading 36%, grade F, #1,777 of 2,108 statewide, top 84%, 895 students, 65% FRL); Cheektowaga Middle School (math 10% / reading 36%, grade F, #646 of 729 statewide, top 89%, 627 students, 68% FRL); Cheektowaga High School (math 92% / reading 70%, grade A, #495 of 1,100 statewide, top 46%, 705 students, 68% FRL) — zoned schools average 67% FRL vs 51% district-wide (16 pts higher); higher-poverty schools than district average — tighter screening recommended.
- Market conditions: 173 active listings in the ZIP; 18 comparable units currently listed for rent nearby; rentals at typical pace (median 19d on market — plan ~3-4 weeks tenant-placement turnaround); lower-income renter base — watch delinquency; 1,244 units permitted in Erie County in 2024 (563 in 5+ unit buildings).
- At $1,504/mo this rent would consume 50% of the median local household income ($36k/yr) (locally 1804% of renters already pay >50% of income on rent) — very limited rent-growth headroom before tenants either downsize or default.
Forward outlook
- In year one you build about $4k of equity ($1k loan paydown + $3k appreciation (2.0% local appreciation)).
- At projected returns (2.0% appreciation + 3.0% rent growth), your $44k cash investment doubles in ~9 years — after that, you're playing with house money.
- By year 8, paydown + projected appreciation supports a ~$32k cash-out refi (75% LTV) — recoverable capital for the next deal without selling this one.
Negotiation context
- Only 10 days on market — expect competitive offers; lowballing is unlikely to land.
Risks & watch-outs
- Watch-outs: property tax is 2.9% of price; built in 1906 — expect roof / HVAC / electrical / plumbing capex.
Questions for the listing agent
- What do current leases actually rent for vs. the listed asking? Can we see a recent rent roll and the last 12 months of T-12 income?
- Built in 1906 — when were the roof, HVAC, electrical panel, plumbing, and water heater last replaced?
- Property tax is high relative to price — has the assessment been appealed recently, and will the sale trigger a re-assessment?
- Is there a deadline driving the sale (1031 exchange, divorce, estate, relocation)? That informs how much negotiation room exists.
- Schools are B-rated — typically a magnet for longer-tenancy family renters. What's the average tenant stay here, and is there a school-zone premium baked into asking?
- What's the average days-on-market for RENTAL listings here right now (not sales)? A rising rental-DOM trend means longer vacancies and softer asking-rent achievability than the comps imply.
- What's the recent tenant-quality profile in this submarket — average credit score on applications, eviction rate, late-payment / NSF rate, and stable-employment percentage? A property-management company in the area should have these aggregated.
- How much new for-sale + rental construction is in the pipeline within 1–3 miles? Heavy new supply typically softens prices + rents 12–24 months out; constrained supply supports both.
Investment metrics
- 1% rule
- 0.96% ✗
- Cap rate
- 5.74%
- Cash-on-cash
- -1.99%
- DSCR
- 0.91
- GRM
- 8.6
CMA / ARV
- ARV (on-the-fly)
- $216,920
- Comps found
- 12
Show comp detail 12 sales within ~0.75 mi
| Address | Dist | Beds/Ba | Sqft | Sold | Price | $/sf | Match |
|---|---|---|---|---|---|---|---|
| 32 Wildy Ave | 0.43mi | 3/2.0 | 1,267 (-1%) | 1mo | $210,000 | $166 | 74 |
| 105 Hoerner Ave | 0.38mi | 3/1.0 | 1,367 (+7%) | 2mo | $90,000 | $66 | 69 |
| 64 Westchester Dr | 0.32mi | 2/1.0 (-1) | 1,194 (-6%) | 2mo | $190,000 | $159 | 67 |
| 16 Kemp Ave | 0.39mi | 3/1.0 | 1,152 (-10%) | 0mo | $275,000 | $239 | 65 |
| 32 Eden Ln | 0.53mi | 3/2.0 | 1,326 (+4%) | 2mo | $225,000 | $170 | 63 |
| 62 Haller Ave | 0.33mi | 3/2.0 | 1,397 (+10%) | 4mo | $125,000 | $89 | 61 |
| 232 Boll St | 0.74mi | 3/1.0 | 1,224 (-4%) | 1mo | $240,000 | $196 | 58 |
| 1003 Walden Ave | 0.56mi | 3/1.0 | 1,130 (-11%) | 0mo | $70,000 | $62 | 55 |
| 25 Mcnaughton Ave | 0.43mi | 3/2.0 | 1,437 (+13%) | 4mo | $255,000 | $177 | 52 |
| 115 Southern Pkwy | 0.65mi | 2/1.0 (-1) | 1,195 (-6%) | 4mo | $215,000 | $180 | 51 |
| 85 Cathedral Ln | 0.69mi | 2/1.0 (-1) | 1,137 (-11%) | 1mo | $275,000 | $242 | 44 |
| 102 Francis Ave | 0.73mi | 3/1.0 | 1,130 (-11%) | 4mo | $165,000 | $146 | 43 |
Match score weights: distance 35% · size 25% · config 20% · recency 20%. Top-matched comps best support the ARV.
Projected returns pro-forma
2.05% appreciation · 3.0% rent growth · sell at horizon
- IRR
- 2.8%
- Equity multiple
- 1.15×
- Total profit
- $6,614
- Equity at exit
- $61,906
- IRR
- 6.7%
- Equity multiple
- 1.92×
- Total profit
- $40,166
- Equity at exit
- $89,465
Cash invested: $43,652 (down + closing). Projections, not guarantees.
Landlord ↔ Tenant lean methodology
- Overall (STATE)
- 15 Strongly Tenant-Friendly
- State New York
- 15 Strongly Tenant-Friendly · D+10
- County
- — inherits STATE
- City
- — inherits STATE
ZIP-level market 14211
- Home prices YoY
- 0.6%
- Active inventory
- 173
- Price-to-rent
- 8.6×
Monthly cashflow live
- Estimated rent
- $1,504 high interval (Pro) →
- Mortgage (P&I)
- −$818
- Tax from tax record
- −$378 /mo · $4,532/yr
- Insurance
- −$65
- HOA
- −$0
- Vacancy / Maint / Mgmt
- −$316
- Net cashflow
- $-72
Break-even live
Sensitivity live
| Price | -10% $16 | -5% $-28 | +0% $-72 | +5% $-116 | +10% $-160 |
|---|---|---|---|---|---|
| Rent | -10% $-191 | -5% $-132 | +0% $-72 | +5% $-13 | +10% $47 |
| Rate | -1.0pp $6 | -0.5pp $-33 | base $-72 | +0.5pp $-113 | +1.0pp $-154 |
UW: 25.0% down · 7.5% · 30yr · 1.5% tax · 5.0% vac · 8.0% maint · 8.0% mgmt
Financing live
Cash to close
- Down payment
- $38,975
- Closing costs
- $4,677
- Reserves months
- —
- Total cash needed
- —
Loan-product check · same deal, 3 products live
Conventional
25% down · 7.5% · 30yr
- Down + closing
- —
- Monthly P&I
- —
- Monthly cashflow
- —
- DSCR
- —
- Eligible?
- —
Personal DTI + credit; lowest rate.
DSCR
20% down · 8.5% · 30yr
- Down + closing
- —
- Monthly P&I
- —
- Monthly cashflow
- —
- DSCR
- —
- Eligible?
- —
No personal income docs; deal must DSCR.
Hard money
10% down · 12.0% · 12mo
- Down + closing
- —
- Monthly P&I
- —
- Monthly cashflow
- —
- DSCR
- —
- Eligible?
- —
Short-term bridge; refi at stabilization.
Rent comps 18 comps
| Address | Beds | Baths | Sqft | Rent | $/sqft | DOM | Units | Dist |
|---|---|---|---|---|---|---|---|---|
| 1202 Walden Ave Unit 3 Buffalo, NY | 3.0 | 1.0 | 1500 | $1,400 | $0.93 | 19d | 1 | 0.18mi |
| 143 Reo Ave Buffalo, NY | 3.0 | 2.0 | 1143 | $1,600 | $1.40 | 13d | 1 | 0.24mi |
| 24 Euclid Ave Buffalo, NY | 3.0 | 2.0 | 1150 | $1,700 | $1.48 | 45d | 1 | 0.50mi |
| 979 Walden Ave Buffalo, NY | 4.0 | 3.0 | 1793 | $2,000 | $1.12 | 3d | 1 | 0.60mi |
| 11 Kaufman Dr Buffalo, NY | 2.0 | 1.0 | 900 | $1,500 | $1.67 | 45d | 1 | 0.75mi |
| 50 Pine Ridge Ter Unit 3 Cheektowaga, NY | 2.0 | 1.0 | 900 | $1,400 | $1.56 | 19d | 1 | 0.77mi |
| 65 Domedion Ave Buffalo, NY | 3.0 | 1.0 | 1632 | $1,500 | $0.92 | 3d | 1 | 0.85mi |
| 14 Rutland Ave Buffalo, NY | 4.0 | 1.0 | 1430 | $2,200 | $1.54 | 12d | 1 | 0.89mi |
| 67 Moeller St Unit UPPER Buffalo, NY | 3.0 | 1.0 | 960 | $1,000 | $1.04 | 5d | 1 | 1.18mi |
| 67 Moeller St Unit LOWER Buffalo, NY | 3.0 | 1.0 | 960 | $1,200 | $1.25 | 25d | 1 | 1.18mi |
| 2935 Genesee St Unit Up Buffalo, NY | 2.0 | 1.0 | 1400 | $1,400 | $1.00 | 12d | 1 | 1.24mi |
| 85 Blake St Unit 1 Buffalo, NY | 4.0 | 2.0 | 1022 | $1,000 | $0.98 | 45d | 1 | 1.28mi |
| 103 Preston Rd Unit Lower Cheektowaga, NY | 2.0 | 1.0 | 882 | $1,300 | $1.47 | 5d | 1 | 1.28mi |
| 1777 Broadway Unit 2 Buffalo, NY | 3.0 | 1.0 | 1300 | $1,200 | $0.92 | 45d | 1 | 1.30mi |
| 61 Courtland Ave Unit Lower Buffalo, NY | 2.0 | 1.0 | 1000 | $1,300 | $1.30 | 45d | 1 | 1.31mi |
| 47 Awood Pl Buffalo, NY | 3.0 | 1.0 | 1840 | $1,500 | $0.82 | 3d | 1 | 1.36mi |
| 216 Newburgh Ave Buffalo, NY | 2.0 | 1.0 | 1690 | $1,150 | $0.68 | 25d | 1 | 1.38mi |
| 249 Newburgh Ave Unit 2 Buffalo, NY | 2.0 | 1.0 | 930 | $1,300 | $1.40 | 45d | 1 | 1.40mi |
Listing history 9 events
-
2026-06-13statusdays on market $155,900 Pending 10 DOM
-
2026-06-10days on market $155,900 Active 9 DOM
-
2026-06-09days on market $155,900 Active 8 DOM
-
2026-06-08days on market $155,900 Active 7 DOM
-
2026-06-07days on market $155,900 Active 6 DOM
-
2026-06-05days on market $155,900 Active 3 DOM
-
2026-06-03days on market $155,900 Active 2 DOM
-
2026-06-02remarks 699-char remark
-
2026-06-02$155,900 Active 1 DOM
ⓘ Source: listings_history table (triggers on properties + properties_extension) + one-shot
backfill from property_details.listing_events for pre-trigger history.
Tax reassessment forecast NY · Partial reset (capped growth)
- Current annual tax
- $4,532 · $378/mo
- Projected year-2 tax
- $4,532 · $378/mo
- Expected delta
- $0/yr ($0/mo · 0.0%)
ⓘ Screening estimate from a state-policy table — verify with the county assessor before closing.
Climate risk First Street
- Flood 1/10 Low FEMA zone X (unshaded) · 0% chance over 30 yrs
- Wildfire 1/10 Low
- Heat 3/10 Moderate 7 d/yr ≥93°F today · 15 d/yr by 30 yrs out
- Wind 1/10 Low
- Air quality 3/10 Moderate 2 unhealthy d/yr today · 3 by 30 yrs out
Nearby sold comps map
Loading sold comps map…
Walkable amenities ~0.75 mi
Loading nearby amenities…
Taxation est. · year 1
- Rental income
- $18,045
- − Mortgage interest
- −$8,733
- − Property taxes
- −$4,532
- − Insurance
- −$780
- − Repairs & maintenance
- −$1,444
- − Management
- −$1,444
- − Depreciation
- −$4,535
- Taxable loss
- −$3,422
- Est. tax savings @ 24.0%
- +$821
- After-tax cash flow
- $-45/yr
For passive investors: Depreciation is non-cash, so a rental often shows a tax loss while cash-flowing — sheltering income. Rental losses are passive: they offset passive income freely, and up to $25,000/yr can offset ordinary (W-2) income if you actively participate and your MAGI is under $100k (phasing out to $0 by $150k); unused losses carry forward. On sale, claimed depreciation is recaptured at up to 25%, and gains may owe capital-gains tax (a 1031 exchange can defer both). Figures are a year-1 estimate at your 24.0% rate — not tax advice; consult a CPA.
Schools (NCES district)
- District
- Cheektowaga Central School District
- NCES district ID
- 3607230
- Math proficiency
- 30% ▼ -7.00%
- Reading proficiency
- 37% ▲ 1.00%
- Median HH income
- $43,401
- Composite
- 28.45/100
- National rank
- #6753
- State rank
- #564 of 590 in NY
Livability — Cheektowaga
- Score
- 84/100
- State rank
- #54
- US rank
- #811
Category grades
Schools grade is shown separately in the Schools card above.
Census & demographics
- Census place
- Cheektowaga, NY
- County
- Erie County · 714,559 people
- City population
- 55,470
- Metro
- Buffalo-Cheektowaga, NY
- Population (ZIP)
- 24,663
- Household income
- $36,300
- Rent vs Own
- Severe rent burden
- 1804.0
Population outlook (Erie County) Hauer SSP2
- Today (2025)
- 933,037 people
- By 2030
- 935,181 · +0.2%
- By 2040
- 928,531 · -0.5%
- By 2050
- 905,725 · -2.9%
- By 2075
- 834,037 · -10.6%
- By 2100
- 708,033 · -24.1%
Race, ethnicity, and origin ACS 2023
- Neighborhood character
- Diverse neighborhood (Simpson 0.60)
- Race & ethnicity
- Black 59% Asian 20% Hispanic / Latino 9% White 9% Two or more races 5%
- Hispanic origin (detail)
- Puerto Rican 6%
- Common ancestry
- Romanian 4%
- Foreign-born
- 17% · Canada, Philippines, Vietnam
- Languages at home
- 74% English-only · Other Indo-European 14% Spanish 6% Other Asian/Pacific 1%
Political lean MEDSL · Erie
- 2024 margin
- Lean D (+9.7) · D 54.8% · R 45.2%
- 2008→2024 swing
- -7.9pp toward R · 2008: 17.5pp · 2024: 9.7pp
- All cycles
- 2024: D+9.7 2020: D+14.7 2016: D+4.8 2012: D+15.6 2008: D+17.5
Not yet ingested
- Civics
- —
Market trends
- HPI YoY
- ▲ 2.05%
- Current HPI
- 357.6438
- Rent YoY
- —
- Metro
- Buffalo-Cheektowaga, NY
- State GDP YoY
- ▲ 2.60%
- F500 in state
- 92
Industry mix (Fortune 500 HQ in NY)
| Industry | F500 HQs | Revenue |
|---|---|---|
| Financial Services | 10 | $950B |
|
||
| Consumer Goods | 9 | $162B |
|
||
| Insurance | 4 | $225B |
|
||
| Telecommunications | 2 | $144B |
|
||
| Pharmaceuticals | 2 | $112B |
|
||
| Media / Entertainment | 2 | $69B |
|
||
Price history
1 event — show timeline
- 2026-06-01 Listed $155,900 WNYREIS
Property tax history
+6.4%/yrLatest (2025): $4,532 · +19.0% YoY. Source: county tax records.
Cash-flow waterfall
monthlySold comps — $/sqft
last 12 mo · ≤1 miLoading sold comps…