 Duplex
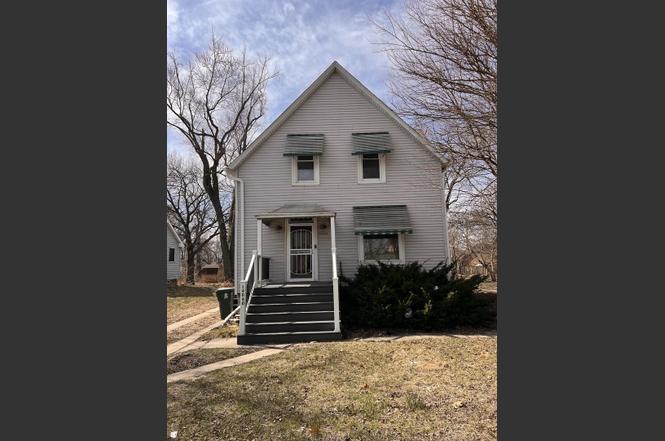
14040 Lincoln Ave · Dolton, IL
Flood risk 1/10 · Minimal
- FEMA flood zone
- X (unshaded)
- Chance of flooding over 30 yrs
- 0.0%
- Est. flood insurance / yr
- $473 – $860
Fire risk 1/10 · Minimal
- Est. fire insurance / yr
- $804 – $1,492
Heat risk 3/10 · Minor
- Hot days now (above 101°F)
- 7 days/yr
- Hot days in 30 yrs
- 15 days/yr
Wind risk 2/10 · Minimal
- Chance of severe wind over 30 yrs
- —
Air-quality risk 4/10 · Minor
- Unhealthy air days now
- 4 days/yr
- Unhealthy air days in 30 yrs
- 5 days/yr
Risk factors via First Street. Map © Google.
Why this score? — see what drove the B- grade
The composite is a weighted blend of 9 inputs, each scored 0–100. Each bar is that input's sub-score; the figure is the points it added to the 100-point composite (weight × sub-score).
- Cash flow +29.5/30.0
- DSCR +10.0/10.0
- 1% rule +9.4/10.0
- ARV discount +7.5/15.0
- Rent growth +4.9/5.0
- Livability +3.7/5.0
- Condition / age +2.5/5.0
- Schools +0.7/10.0
- Appreciation +0.0/10.0
$269,900
🖨 Deal sheet (PDF) 📄 Offer letter ✓ Due diligence
Multi-family units
County records classify this as Multi-Family (2-4 Unit). Listing-text estimate: 2 units. confirmed
Listing remarks MLS
Rehab this former vintage beauty. Burst pipes wreaked havoc on this home, it will need a lot of work. Two units including a main level connected with full basement with two bedrooms + another two bedroom unit on top level. Huge yard with 3 car garage. Great location across from the library. Working with experienced SS attorney.
Key facts
- Fully renovated
- Modern layouts
- New carpet
Tags
Property features AI
Finance
- Financial info: Special Service Area: No
Exterior
- Parking: Detached garage with 3 garage spaces (3 total parking spaces)
- Utilities: Water from Lake Michigan / public water; Public sewer
- Home design: Two-to-four unit property (2 units); Fee simple ownership; Originally built over 100 years ago; Rehab in 2025; Built before 1978
- Construction: Vinyl siding; Rehabilitated in 2025
- Exterior features: Lot dimensions approximately 50 x 248; Approximately 0.25–0.49 acre lot; School bus service; Interstate access
Interior
- Kitchen: Each unit includes stove, refrigerator, and microwave
- Bedrooms: 4 bedrooms total; Unit 1 (1st floor): 2 bedrooms; Unit 2 (2nd floor): 2 bedrooms
- Bathrooms: 2 full bathrooms total; Unit 1: 1 full bathroom; Unit 2: 1 full bathroom
- Heating & cooling: Natural gas heating
- Interior features: 11 total rooms; Full unfinished walk-out basement
- Laundry & utility: Tenants pay electric, gas, and heat
Neighborhood map
What this means for you Summary
Snapshot
- This is a 2 × 2.0-bed/1.0-bath units multifamily listed at $270k.
Deal economics
- At list price, monthly cash flow is $963 ($12k/yr) — positive. Per door: $481/mo.
- The deal already cash-flows at list — no discount required.
- Meets the 1% rule at list price ($4k rent vs $270k).
- Recommended offer: $238k (12.0% below list) — sets the bar for market timing.
Location & tenants
- Location reads 74/100 on livability (#263 in IL, #4,883 nationally) — a middle-class / working-renter tenant base. Strengths: commute A+, cost of living A+, housing A+; Watch: employment C-, health & safety C-, crime D-.
- Thornton Twp Hsd 205 (suburban): math 7% / reading 8% proficiency, ranked #594 of 620 in IL (top 96%) — low school quality limits family demand, transient renter base, plan for 1-2y turnover.
- Zoned schools: Lincoln Elementary School (math 24% / reading 24%, grade F, #850 of 2,056 statewide, top 45%, 342 students, 0% FRL); Lincoln Junior High School (150 students, 0% FRL); Thornridge High School (math 8% / reading 8%, grade F, #589 of 693 statewide, top 86%, 1,057 students, 0% FRL).
- Market conditions: Rents rising fast (+9.7%/yr); 129 active listings in the ZIP; 6 comparable units currently listed for rent nearby; rentals at typical pace (median 27d on market — plan ~3-4 weeks tenant-placement turnaround); 6,272 units permitted in Cook County in 2024 (4,658 in 5+ unit buildings).
- At $3,894/mo this rent would consume 81% of the median local household income ($58k/yr) (locally 919% of renters already pay >50% of income on rent) — very limited rent-growth headroom before tenants either downsize or default.
Forward outlook
- Local home prices are declining (-3.0%/yr); year-one equity from $2k of loan paydown is wiped out by about $8k of value loss. Plan a longer hold.
- At projected returns (-3.0% appreciation + 8.0% rent growth), your $76k cash investment doubles in ~6 years — after that, you're playing with house money.
Negotiation context
- It's been on market 348 days — a 12% lower offer ($238k) is reasonable based on typical stale-listing flexibility.
- 5 sale attempts since 15y ago; this cycle's ask has dropped $30k (10%) from the opening price — seller is motivated, your offer sets the floor, not the list.
- Current owner paid $40k; list at $270k implies a 575% gain — meaningful room to come down on a strong offer.
Risks & watch-outs
- Watch-outs: property tax is 2.6% of price; built in 1888 — expect roof / HVAC / electrical / plumbing capex.
Questions for the listing agent
- It's been on market 348 days. Have you received any prior offers? Is the seller open to a 12% concession, seller financing, or rate buy-down credit?
- Can we see the unit-by-unit rent roll, current vacancy, and any below-market leases? What's the average tenancy length?
- What capital expenditures (roof, boiler, parking lot, exteriors) have been made in the last 5 years, and what's planned in the next 2?
- Built in 1888 — when were the roof, HVAC, electrical panel, plumbing, and water heater last replaced?
- Property tax is high relative to price — has the assessment been appealed recently, and will the sale trigger a re-assessment?
- Why hasn't it sold? Are there any deal-killer items the seller is aware of (foundation, flood, title, zoning, code violations)?
- Is there a deadline driving the sale (1031 exchange, divorce, estate, relocation)? That informs how much negotiation room exists.
- Schools are F-rated, which usually means shorter tenancies and higher turnover. Who's the typical renter profile here, and what's been the actual vacancy rate?
- Crime grade is D in this area — have there been break-ins, vandalism, or insurance claims at this property in the last 3 years? What carrier currently insures it and at what premium?
- What's the average days-on-market for RENTAL listings here right now (not sales)? A rising rental-DOM trend means longer vacancies and softer asking-rent achievability than the comps imply.
- What's the recent tenant-quality profile in this submarket — average credit score on applications, eviction rate, late-payment / NSF rate, and stable-employment percentage? A property-management company in the area should have these aggregated.
- How much new apartment / multifamily construction is in the pipeline within 1–3 miles? Heavy new supply (>2% of stock underway) typically softens rents 12–24 months out; light construction supports rent growth.
Investment metrics
- 1% rule
- 1.44% ✓
- Cap rate
- 10.57%
- Cash-on-cash
- 15.29%
- DSCR
- 1.68
- GRM
- 5.8
CMA / ARV
No comps found within radius.
Projected returns pro-forma
-3.0% appreciation · 8.0% rent growth · sell at horizon
- IRR
- 12.0%
- Equity multiple
- 1.51×
- Total profit
- $38,377
- Equity at exit
- $40,243
- IRR
- 24.9%
- Equity multiple
- 3.74×
- Total profit
- $206,901
- Equity at exit
- $23,336
Cash invested: $75,572 (down + closing). Projections, not guarantees.
Landlord ↔ Tenant lean methodology
- Overall (STATE)
- 43 Moderately Tenant-Leaning
- State Illinois
- 43 Moderately Tenant-Leaning · D+7
- County
- — inherits STATE
- City
- — inherits STATE
ZIP-level market 60419
- Home prices YoY
- -25.7%
- Rents YoY
- 9.7%
- Active inventory
- 129
- Price-to-rent
- 11.6×
Monthly cashflow live
- Estimated rent
- $3,894 high interval (Pro) →
- Mortgage (P&I)
- −$1,415
- Tax from tax record
- −$586 /mo · $7,027/yr
- Insurance
- −$112
- HOA
- −$0
- Vacancy / Maint / Mgmt
- −$818
- Net cashflow
- $963
Break-even live
Sensitivity live
| Price | -10% $1,116 | -5% $1,039 | +0% $963 | +5% $886 | +10% $810 |
|---|---|---|---|---|---|
| Rent | -10% $655 | -5% $809 | +0% $963 | +5% $1,117 | +10% $1,270 |
| Rate | -1.0pp $1,099 | -0.5pp $1,031 | base $963 | +0.5pp $893 | +1.0pp $822 |
2-unit breakdown (identical units grouped — click to expand)
| Units | Beds | Baths | Est. rent |
|---|---|---|---|
| 2× units | 2.0 | 1 | $3,894 |
| #1 | 2.0 | 1 | $1,947 |
| #2 | 2.0 | 1 | $1,947 |
| Total (2 units) | $3,894 | ||
UW: 25.0% down · 7.5% · 30yr · 1.5% tax · 5.0% vac · 8.0% maint · 8.0% mgmt
Financing live
Cash to close
- Down payment
- $67,475
- Closing costs
- $8,097
- Reserves months
- —
- Total cash needed
- —
Loan-product check · same deal, 3 products live
Conventional
25% down · 7.5% · 30yr
- Down + closing
- —
- Monthly P&I
- —
- Monthly cashflow
- —
- DSCR
- —
- Eligible?
- —
Personal DTI + credit; lowest rate.
DSCR
20% down · 8.5% · 30yr
- Down + closing
- —
- Monthly P&I
- —
- Monthly cashflow
- —
- DSCR
- —
- Eligible?
- —
No personal income docs; deal must DSCR.
Hard money
10% down · 12.0% · 12mo
- Down + closing
- —
- Monthly P&I
- —
- Monthly cashflow
- —
- DSCR
- —
- Eligible?
- —
Short-term bridge; refi at stabilization.
Rent comps 6 comps
| Address | Beds | Baths | Sqft | Rent | $/sqft | DOM | Units | Dist |
|---|---|---|---|---|---|---|---|---|
| 14124 Manor Ave Dolton, IL | 3.0 | 2.0 | 1440 | $2,390 | $1.66 | 26d | 1 | 0.33mi |
| 19 E 140th Ct Riverdale, IL | 3.0 | 2.0 | 2076 | $2,231 | $1.07 | 9d | 1 | 0.60mi |
| 13903 S State St Riverdale, IL | 4.0 | 1.5 | 2300 | $2,650 | $1.15 | 26d | 1 | 0.68mi |
| 13708 S Wentworth Ave Riverdale, IL | 3.0 | 1.5 | 1500 | $2,200 | $1.47 | 24d | 1 | 1.02mi |
| 14505 Minerva Ave Dolton, IL | 4.0 | 2.0 | 2100 | $2,500 | $1.19 | 26d | 1 | 1.13mi |
| 14916 Langley Ave Dolton, IL | 3.0 | 1.5 | 1418 | $2,500 | $1.76 | 26d | 1 | 1.21mi |
Listing history 32 events
-
2026-06-21days on market $269,900 Active 348 DOM
-
2026-06-18days on market $269,900 Active 345 DOM
-
2026-06-17days on market $269,900 Active 344 DOM
-
2026-06-16days on market $269,900 Active 343 DOM
-
2026-06-15days on market $269,900 Active 342 DOM
-
2026-06-13days on market $269,900 Active 340 DOM
-
2026-06-13days on market $269,900 Active 339 DOM
-
2026-06-09days on market $269,900 Active 336 DOM
-
2026-06-08days on market $269,900 Active 335 DOM
-
2026-06-07days on market $269,900 Active 334 DOM
-
2026-06-04days on market $269,900 Active 331 DOM
-
2026-06-03days on market $269,900 Active 330 DOM
-
2026-06-02days on market $269,900 Active 329 DOM
-
2026-06-01days on market $269,900 Active 328 DOM
-
2026-05-31days on market $269,900 Active 327 DOM
-
2026-05-08status Active
-
2026-04-24historical Contingent - Continue to Show
-
2026-03-20price $269,900
-
2025-08-10price $290,000
-
2025-07-08$300,000 Active
-
2023-06-29soldstatus $40,000
-
2023-06-01soldstatus $40,000 Closed 329-char remark
Show marketing remark (329 chars)
Rehab this former vintage beauty. Burst pipes wreaked havoc on this home, it will need a lot of work. Two units including a main level connected with full basement with two bedrooms + another two bedroom unit on top level. Huge yard with 3 car garage. Great location across from the library. Working with experienced SS attorney.
-
2023-04-09historical Contingent - Continue to Show 329-char remark
Show marketing remark (329 chars)
Rehab this former vintage beauty. Burst pipes wreaked havoc on this home, it will need a lot of work. Two units including a main level connected with full basement with two bedrooms + another two bedroom unit on top level. Huge yard with 3 car garage. Great location across from the library. Working with experienced SS attorney.
-
2023-04-04price $40,000 329-char remark
Show marketing remark (329 chars)
Rehab this former vintage beauty. Burst pipes wreaked havoc on this home, it will need a lot of work. Two units including a main level connected with full basement with two bedrooms + another two bedroom unit on top level. Huge yard with 3 car garage. Great location across from the library. Working with experienced SS attorney.
-
2023-03-28$50,000 Active 329-char remark
Show marketing remark (329 chars)
Rehab this former vintage beauty. Burst pipes wreaked havoc on this home, it will need a lot of work. Two units including a main level connected with full basement with two bedrooms + another two bedroom unit on top level. Huge yard with 3 car garage. Great location across from the library. Working with experienced SS attorney.
-
2011-10-21historical
-
2011-10-11New
-
2011-10-11historical
-
2011-08-01price Price Change
-
2011-07-13price Price Change
-
2011-05-17price Price Change
-
2011-03-03New
ⓘ Source: listings_history table (triggers on properties + properties_extension) + one-shot
backfill from property_details.listing_events for pre-trigger history.
Tax reassessment forecast IL · Partial reset (capped growth)
- Current annual tax
- $7,027 · $586/mo
- Projected year-2 tax
- $7,027 · $586/mo
- Expected delta
- $0/yr ($0/mo · 0.0%)
ⓘ Screening estimate from a state-policy table — verify with the county assessor before closing.
Climate risk First Street
- Flood 1/10 Low FEMA zone X (unshaded) · 0% chance over 30 yrs
- Wildfire 1/10 Low
- Heat 3/10 Moderate 7 d/yr ≥101°F today · 15 d/yr by 30 yrs out
- Wind 2/10 Low
- Air quality 4/10 Moderate 4 unhealthy d/yr today · 5 by 30 yrs out
Nearby sold comps map
Loading sold comps map…
Walkable amenities ~0.75 mi
Loading nearby amenities…
Taxation est. · year 1
- Rental income
- $46,728
- − Mortgage interest
- −$15,119
- − Property taxes
- −$7,027
- − Insurance
- −$1,350
- − Repairs & maintenance
- −$3,738
- − Management
- −$3,738
- − Depreciation
- −$7,852
- Taxable income
- $7,904
- Est. tax owed @ 24.0%
- −$1,897
- After-tax cash flow
- $9,657/yr
For passive investors: Depreciation is non-cash, so a rental often shows a tax loss while cash-flowing — sheltering income. Rental losses are passive: they offset passive income freely, and up to $25,000/yr can offset ordinary (W-2) income if you actively participate and your MAGI is under $100k (phasing out to $0 by $150k); unused losses carry forward. On sale, claimed depreciation is recaptured at up to 25%, and gains may owe capital-gains tax (a 1031 exchange can defer both). Figures are a year-1 estimate at your 24.0% rate — not tax advice; consult a CPA.
Schools (NCES district)
- District
- Thornton Twp Hsd 205
- NCES district ID
- 1738970
- Math proficiency
- 7% ▬ 0.00%
- Reading proficiency
- 8% ▼ -2.00%
- Median HH income
- $43,392
- Composite
- 6.92/100
- National rank
- #9976
- State rank
- #594 of 620 in IL
Livability — Dolton
- Score
- 74/100
- State rank
- #263
- US rank
- #4883
Category grades
Schools grade is shown separately in the Schools card above.
Census & demographics
- Census place
- Dolton, IL
- County
- Cook County · 4,486,803 people
- City population
- 20,825
- Metro
- Chicago-Naperville-Elgin, IL-IN-WI
- Population (ZIP)
- 20,825
- Household income
- $57,887
- Rent vs Own
- Severe rent burden
- 919.0
Population outlook (Cook County) Hauer SSP2
- Today (2025)
- 5,347,519 people
- By 2030
- 5,357,703 · +0.2%
- By 2040
- 5,324,924 · -0.4%
- By 2050
- 5,230,762 · -2.2%
- By 2075
- 4,785,735 · -10.5%
- By 2100
- 4,188,836 · -21.7%
Race, ethnicity, and origin ACS 2023
- Neighborhood character
- Predominantly Black (91%)
- Race & ethnicity
- Black 91% White 4% Two or more races 3% Hispanic / Latino 1%
- Common ancestry
- Romanian 1% Hispanic 1%
- Foreign-born
- 3% · Canada
- Languages at home
- 95% English-only · French/Haitian/Cajun 2% Spanish 1%
Political lean MEDSL · Cook
- 2024 margin
- Solid D (+42.0) · D 70.4% · R 28.4% · Other 1.2%
- 2008→2024 swing
- -11.4pp toward R · 2008: 53.4pp · 2024: 42.0pp
- All cycles
- 2024: D+42.0 2020: D+50.3 2016: D+53.0 2012: D+49.4 2008: D+53.4
Not yet ingested
- Civics
- —
Market trends
- HPI YoY
- ▼ -66.88%
- Current HPI
- 193.2346
- Rent YoY
- ▲ 9.65%
- Metro
- Chicago-Naperville-Elgin, IL-IN-WI
- State GDP YoY
- ▲ 1.59%
- F500 in state
- 60
Industry mix (Fortune 500 HQ in IL)
| Industry | F500 HQs | Revenue |
|---|---|---|
| Insurance | 4 | $201B |
|
||
| Consumer Goods | 4 | $87B |
|
||
| Industrial Machinery | 3 | $64B |
|
||
| Healthcare | 2 | $55B |
|
||
| Retail / Pharmacy | 1 | $148B |
|
||
| Agriculture / Food | 1 | $86B |
|
||
Price history
+439.8% since first listed17 events — show timeline
- 2026-05-08 Relisted — MRED as Distributed by MLS Grid
- 2026-04-24 Contingent — MRED as Distributed by MLS Grid
- 2026-03-20 Price Changed $269,900 MRED as Distributed by MLS Grid
- 2025-08-10 Price Changed $290,000 MRED as Distributed by MLS Grid
- 2025-07-08 Listed $300,000 MRED as Distributed by MLS Grid
- 2023-06-29 Sold (Public Records) $40,000 Public Records
- 2023-06-01 Sold (MLS) $40,000 MRED as Distributed by MLS Grid
- 2023-04-09 Contingent — MRED as Distributed by MLS Grid
- 2023-04-04 Price Changed $40,000 MRED as Distributed by MLS Grid
- 2023-03-28 Listed $50,000 MRED as Distributed by MLS Grid
- 2011-10-21 Listing Removed — MRED as Distributed by MLS Grid
- 2011-10-11 Listed — MRED as Distributed by MLS Grid
- 2011-10-11 Listing Removed — MRED as Distributed by MLS Grid
- 2011-08-01 Price Changed — MRED as Distributed by MLS Grid
- 2011-07-13 Price Changed — MRED as Distributed by MLS Grid
- 2011-05-17 Price Changed — MRED as Distributed by MLS Grid
- 2011-03-03 Listed — MRED as Distributed by MLS Grid
Property tax history
+0.8%/yrLatest (2023): $7,027 · +6.0% YoY. Source: county tax records.
Cash-flow waterfall
monthlySold comps — $/sqft
last 12 mo · ≤1 miLoading sold comps…