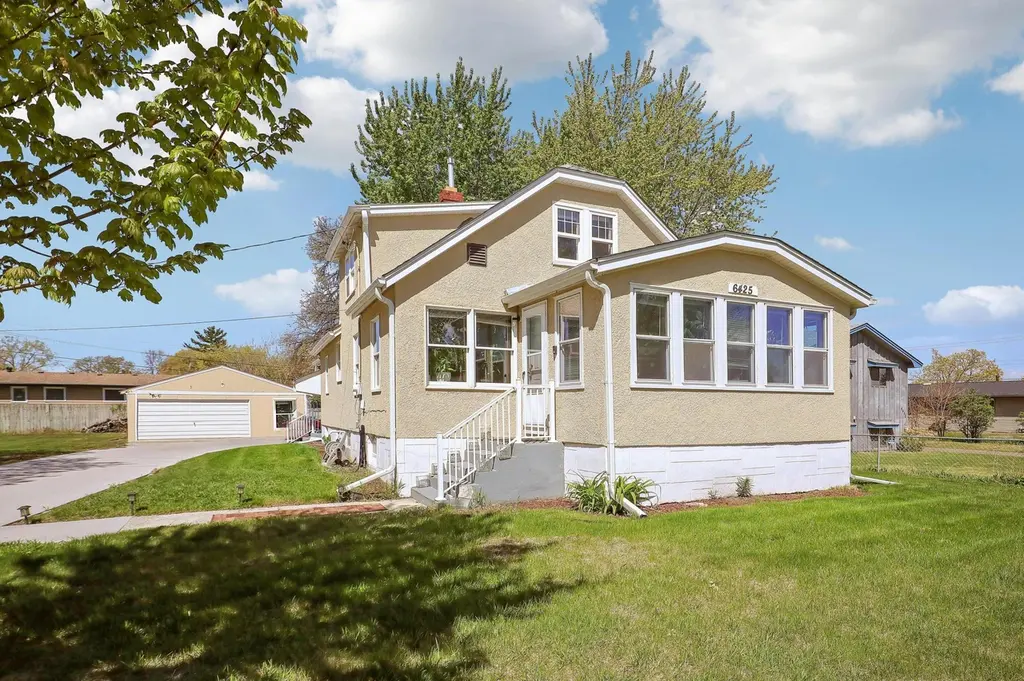
6425 Fremont Ave N · Brooklyn Center, MN
Flood risk 1/10 · Minimal
- FEMA flood zone
- X (unshaded)
- Chance of flooding over 30 yrs
- 0.0%
- Est. flood insurance / yr
- $473 – $860
Fire risk 1/10 · Minimal
- Est. fire insurance / yr
- $888 – $1,650
Heat risk 2/10 · Minimal
- Hot days now (above 99°F)
- 7 days/yr
- Hot days in 30 yrs
- 14 days/yr
Wind risk 2/10 · Minimal
- Chance of severe wind over 30 yrs
- —
Air-quality risk 2/10 · Minimal
- Unhealthy air days now
- 2 days/yr
- Unhealthy air days in 30 yrs
- 2 days/yr
Risk factors via First Street. Map © Google.
Why this score? — see what drove the D grade
The composite is a weighted blend of 9 inputs, each scored 0–100. Each bar is that input's sub-score; the figure is the points it added to the 100-point composite (weight × sub-score).
- Cash flow +15.3/30.0
- ARV discount +9.8/15.0
- DSCR +4.7/10.0
- 1% rule +4.0/10.0
- Livability +3.7/5.0
- Rent growth +2.5/5.0
- Condition / age +2.5/5.0
- Schools +1.9/10.0
- Appreciation +0.0/10.0
$319,000
🖨 Deal sheet (PDF) 📄 Offer letter ✓ Due diligence
Listing remarks MLS
LOCATION! LOCATION ! 4ba, 2 ba, oversized 2 car garage, huge lot, full of charm, located just minutes from the majer Hwys.Short commute to Downtown Minneapolis. Beautifly restore, former farm house. Hardwood floors, new carpet, Separate mud room. Laundry on main floor. Great for living and entertaining . Offering the peaceful setting in the middle of the city. Truly great opportunity in fantastic location. This one wont last. Please call for private viewing right away !
Key facts
- Huge city lot
- Main-floor bedroom
- Separate mudroom
Tags
Property features AI
Exterior
- Parking: Concrete driveway; Detached 2-car garage
- Utilities: City water connected; City sewer connected; Natural gas
- Home design: Residential property; Two levels; Sun room; Entry includes a mud room
- Construction: Block foundation; Block basement; Asphalt pitched roof
- Exterior features: Patio; Stone and stucco exterior; Storage shed; No fencing; Light to medium tree coverage; Public transit within six blocks; City street frontage with curbs and paved streets; public maintained road
Interior
- Kitchen: Kitchen with window; Range; Refrigerator; Dishwasher
- Bedrooms: 4 bedrooms total; Upper-level bedrooms include Bedroom 3 (11x11) and Bedroom 4 (11x9); Main-level bedrooms include a bedroom (10x11) and Bedroom 2 (11x9); Main floor primary bedroom
- Flooring: Hardwood floors
- Bathrooms: Main floor full bathroom; Upper-level 3/4 bathroom
- Heating & cooling: Hot water heating; Window unit(s) for cooling
- Interior features: Sun room; Informal dining area / kitchen dining; Main floor primary bedroom; Main floor bedroom; Main floor laundry; Patio; Hardwood floors; Washer/Dryer hookup
- Laundry & utility: Main-level laundry room with sink and washer hookup; Washer included; Dryer included
Neighborhood map
What this means for you Summary
Snapshot
- This is a 4-bed/2.0-bath single-family listed at $319k.
Deal economics
- At list price, monthly cash flow is $120 ($1k/yr) — positive.
- The deal already cash-flows at list — no discount required.
- To meet the 1% rule (rent ≥ 1% of price), the offer needs to be $288k (9.7% below list).
- Recommended offer: $288k (9.7% below list) — sets the bar for 1% rule.
- Cap rate 6.7% vs local median 5.0% in Brooklyn Center — top-decile yield for the area; either an underpriced asset or a hidden risk that comps aren't pricing in. Stress-test before assuming the spread holds.
Location & tenants
- Location reads 73/100 on livability (#253 in MN) — a middle-class / working-renter tenant base. Strengths: commute A+, housing A+, cost of living A-; Watch: schools D+, crime F, amenities F.
- Brooklyn Center School District (suburban): math 14% / reading 22% proficiency, ranked #425 of 467 in MN (top 91%) — low school quality limits family demand, transient renter base, plan for 1-2y turnover; 64% free/reduced lunch — lower-income household profile, screen leases tightly.
- Market conditions: 92 active listings in the ZIP; 2 comparable units currently listed for rent nearby; solid renter incomes; 4,651 units permitted in Hennepin County in 2024 (2,443 in 5+ unit buildings).
- At $2,882/mo this rent would consume 46% of the median local household income ($76k/yr) (locally 659% of renters already pay >50% of income on rent) — very limited rent-growth headroom before tenants either downsize or default.
Forward outlook
- Local home prices are declining (-3.0%/yr); year-one equity from $2k of loan paydown is wiped out by about $10k of value loss. Plan a longer hold.
- Hennepin County population projected at +30% by 2050 — long-run rental-demand tailwind backs the buy-and-hold thesis.
Negotiation context
- Only 6 days on market — expect competitive offers; lowballing is unlikely to land.
- 6 sale attempts since 23y ago with the ask held roughly flat each time — persistent listings suggest the price (not the market) is what's stuck; bring a comps-based counter.
- Current owner paid $258k; 24% above their basis — modest negotiation headroom, anchor on the comps not their cost.
Risks & watch-outs
- Watch-outs: built in 1910 — expect roof / HVAC / electrical / plumbing capex.
Questions for the listing agent
- Built in 1910 — when were the roof, HVAC, electrical panel, plumbing, and water heater last replaced?
- Is there a deadline driving the sale (1031 exchange, divorce, estate, relocation)? That informs how much negotiation room exists.
- Schools are D-rated, which usually means shorter tenancies and higher turnover. Who's the typical renter profile here, and what's been the actual vacancy rate?
- Crime grade is F in this area — have there been break-ins, vandalism, or insurance claims at this property in the last 3 years? What carrier currently insures it and at what premium?
- The area grade is low — what's the realistic commute time and amenity access for the typical tenant pool here? Any planned neighborhood developments (good or bad) we should know about?
- What's the average days-on-market for RENTAL listings here right now (not sales)? A rising rental-DOM trend means longer vacancies and softer asking-rent achievability than the comps imply.
- What's the recent tenant-quality profile in this submarket — average credit score on applications, eviction rate, late-payment / NSF rate, and stable-employment percentage? A property-management company in the area should have these aggregated.
- How much new for-sale + rental construction is in the pipeline within 1–3 miles? Heavy new supply typically softens prices + rents 12–24 months out; constrained supply supports both.
Investment metrics
- 1% rule
- 0.90% ✗
- Cap rate
- 6.74%
- Cash-on-cash
- 1.61%
- DSCR
- 1.07
- GRM
- 9.2
CMA / ARV
- ARV (median comp)
- $336,130
- List price
- $319,000
- Delta
- -3.31%
- Verdict
- FAIR
- Comps
- 2 within 1.0 mi
Show comp detail 1 sale within ~0.75 mi
| Address | Dist | Beds/Ba | Sqft | Sold | Price | $/sf | Match |
|---|---|---|---|---|---|---|---|
| 6139 Colfax Ave N | 0.43mi | 4/2.0 | 1,978 (-12%) | 21mo | $319,000 | $161 | 42 |
Match score weights: distance 35% · size 25% · config 20% · recency 20%. Top-matched comps best support the ARV.
Projected returns pro-forma
-3.0% appreciation · 3.0% rent growth · sell at horizon
- IRR
- -13.7%
- Equity multiple
- 0.51×
- Total profit
- $-44,055
- Equity at exit
- $47,564
- IRR
- -4.9%
- Equity multiple
- 0.68×
- Total profit
- $-28,490
- Equity at exit
- $27,581
Cash invested: $89,320 (down + closing). Projections, not guarantees.
Landlord ↔ Tenant lean methodology
- Overall (STATE)
- 46 Balanced
- State Minnesota
- 46 Balanced · D+2
- County
- — inherits STATE
- City
- — inherits STATE
ZIP-level market 55430
- Active inventory
- 92
- Price-to-rent
- 9.2×
Monthly cashflow live
- Estimated rent
- $2,882 medium interval (Pro) →
- Mortgage (P&I)
- −$1,673
- Tax from tax record
- −$351 /mo · $4,217/yr
- Insurance
- −$133
- HOA
- −$0
- Vacancy / Maint / Mgmt
- −$605
- Net cashflow
- $120
Break-even live
Sensitivity live
| Price | -10% $300 | -5% $210 | +0% $120 | +5% $29 | +10% $-61 |
|---|---|---|---|---|---|
| Rent | -10% $-108 | -5% $6 | +0% $120 | +5% $234 | +10% $347 |
| Rate | -1.0pp $280 | -0.5pp $201 | base $120 | +0.5pp $37 | +1.0pp $-47 |
UW: 25.0% down · 7.5% · 30yr · 1.5% tax · 5.0% vac · 8.0% maint · 8.0% mgmt
Financing live
Cash to close
- Down payment
- $79,750
- Closing costs
- $9,570
- Reserves months
- —
- Total cash needed
- —
Loan-product check · same deal, 3 products live
Conventional
25% down · 7.5% · 30yr
- Down + closing
- —
- Monthly P&I
- —
- Monthly cashflow
- —
- DSCR
- —
- Eligible?
- —
Personal DTI + credit; lowest rate.
DSCR
20% down · 8.5% · 30yr
- Down + closing
- —
- Monthly P&I
- —
- Monthly cashflow
- —
- DSCR
- —
- Eligible?
- —
No personal income docs; deal must DSCR.
Hard money
10% down · 12.0% · 12mo
- Down + closing
- —
- Monthly P&I
- —
- Monthly cashflow
- —
- DSCR
- —
- Eligible?
- —
Short-term bridge; refi at stabilization.
Rent comps 2 comps
| Address | Beds | Baths | Sqft | Rent | $/sqft | DOM | Units | Dist |
|---|---|---|---|---|---|---|---|---|
| 1506 71st Ave N Minneapolis, MN | 5.0 | 2.0 | 2109 | $2,999 | $1.42 | 18d | 1 | 0.84mi |
| 3119 67th Ave N Minneapolis, MN | 4.0 | 2.0 | 2056 | $3,000 | $1.46 | 45d | 1 | 1.28mi |
Listing history 31 events
-
2026-06-21days on market $319,000 Active 6 DOM
-
2026-06-18days on market $319,000 Active 3 DOM
-
2026-06-17days on market $319,000 Active 2 DOM
-
2026-06-15pricedays on market $319,000 Active 1 DOM
-
2026-06-13days on market $325,000 Active 29 DOM
-
2026-06-09days on market $325,000 Active 25 DOM
-
2026-06-08pricedays on market $325,000 Active 24 DOM
-
2026-06-07days on market $330,000 Active 23 DOM
-
2026-06-04days on market $330,000 Active 20 DOM
-
2026-06-03days on market $330,000 Active 19 DOM
-
2026-06-02days on market $330,000 Active 18 DOM
-
2026-06-01days on market $330,000 Active 17 DOM
-
2026-05-31days on market $330,000 Active 16 DOM
-
2026-05-16$340,000 Active 963-char remark
-
2026-05-12historical $340,000 963-char remark
-
2020-10-13soldstatus $258,000
-
2020-09-04soldstatus $258,000 Sold 475-char remark
Show marketing remark (475 chars)
LOCATION! LOCATION ! 4ba, 2 ba, oversized 2 car garage, huge lot, full of charm, located just minutes from the majer Hwys.Short commute to Downtown Minneapolis. Beautifly restore, former farm house. Hardwood floors, new carpet, Separate mud room. Laundry on main floor. Great for living and entertaining . Offering the peaceful setting in the middle of the city. Truly great opportunity in fantastic location. This one wont last. Please call for private viewing right away !
-
2020-06-19status Pending 475-char remark
Show marketing remark (475 chars)
LOCATION! LOCATION ! 4ba, 2 ba, oversized 2 car garage, huge lot, full of charm, located just minutes from the majer Hwys.Short commute to Downtown Minneapolis. Beautifly restore, former farm house. Hardwood floors, new carpet, Separate mud room. Laundry on main floor. Great for living and entertaining . Offering the peaceful setting in the middle of the city. Truly great opportunity in fantastic location. This one wont last. Please call for private viewing right away !
-
2020-06-12historical Contingent - Inspection 475-char remark
Show marketing remark (475 chars)
LOCATION! LOCATION ! 4ba, 2 ba, oversized 2 car garage, huge lot, full of charm, located just minutes from the majer Hwys.Short commute to Downtown Minneapolis. Beautifly restore, former farm house. Hardwood floors, new carpet, Separate mud room. Laundry on main floor. Great for living and entertaining . Offering the peaceful setting in the middle of the city. Truly great opportunity in fantastic location. This one wont last. Please call for private viewing right away !
-
2020-06-06$259,900 Active 475-char remark
Show marketing remark (475 chars)
LOCATION! LOCATION ! 4ba, 2 ba, oversized 2 car garage, huge lot, full of charm, located just minutes from the majer Hwys.Short commute to Downtown Minneapolis. Beautifly restore, former farm house. Hardwood floors, new carpet, Separate mud room. Laundry on main floor. Great for living and entertaining . Offering the peaceful setting in the middle of the city. Truly great opportunity in fantastic location. This one wont last. Please call for private viewing right away !
-
2019-12-20soldstatus $170,000
-
2019-12-16soldstatus $170,000 Sold
-
2019-11-12status Pending
-
2019-11-01status Active
-
2019-10-07historical
-
2019-09-27$180,000 Active
-
2003-03-21soldstatus $136,000
-
2003-03-10soldstatus $136,000
-
2003-02-09historical
-
2003-02-04$135,000
-
1978-02-01soldstatus $43,000
ⓘ Source: listings_history table (triggers on properties + properties_extension) + one-shot
backfill from property_details.listing_events for pre-trigger history.
Tax reassessment forecast MN · Partial reset (capped growth)
- Current annual tax
- $4,217 · $351/mo
- Projected year-2 tax
- $4,217 · $351/mo
- Expected delta
- $0/yr ($0/mo · 0.0%)
ⓘ Screening estimate from a state-policy table — verify with the county assessor before closing.
Climate risk First Street
- Flood 1/10 Low FEMA zone X (unshaded) · 0% chance over 30 yrs
- Wildfire 1/10 Low
- Heat 2/10 Low 7 d/yr ≥99°F today · 14 d/yr by 30 yrs out
- Wind 2/10 Low
- Air quality 2/10 Low 2 unhealthy d/yr today · 2 by 30 yrs out
Nearby sold comps map
Loading sold comps map…
Walkable amenities ~0.75 mi
Loading nearby amenities…
Taxation est. · year 1
- Rental income
- $34,586
- − Mortgage interest
- −$17,869
- − Property taxes
- −$4,217
- − Insurance
- −$1,595
- − Repairs & maintenance
- −$2,767
- − Management
- −$2,767
- − Depreciation
- −$9,280
- Taxable loss
- −$3,909
- Est. tax savings @ 24.0%
- +$938
- After-tax cash flow
- $2,374/yr
For passive investors: Depreciation is non-cash, so a rental often shows a tax loss while cash-flowing — sheltering income. Rental losses are passive: they offset passive income freely, and up to $25,000/yr can offset ordinary (W-2) income if you actively participate and your MAGI is under $100k (phasing out to $0 by $150k); unused losses carry forward. On sale, claimed depreciation is recaptured at up to 25%, and gains may owe capital-gains tax (a 1031 exchange can defer both). Figures are a year-1 estimate at your 24.0% rate — not tax advice; consult a CPA.
Schools (NCES district)
- District
- Brooklyn Center School District
- NCES district ID
- 2706240
- Math proficiency
- 14% ▼ -2.00%
- Reading proficiency
- 22% ▼ -3.00%
- Median HH income
- $44,797
- Composite
- 19.07/100
- National rank
- #13976
- State rank
- #425 of 467 in MN
Livability — Brooklyn Center
- Score
- 73/100
- State rank
- #253
- US rank
- #5422
Category grades
Schools grade is shown separately in the Schools card above.
Census & demographics
- Census place
- Brooklyn Center, MN
- County
- Hennepin County · 1,150,272 people
- City population
- 22,749
- Metro
- Minneapolis-St. Paul-Bloomington, MN-WI
- Population (ZIP)
- 22,749
- Household income
- $75,716
- Rent vs Own
- Severe rent burden
- 659.0
Population outlook (Hennepin County) Hauer SSP2
- Today (2025)
- 1,405,227 people
- By 2030
- 1,492,650 · +6.2%
- By 2040
- 1,660,157 · +18.1%
- By 2050
- 1,823,498 · +29.8%
- By 2075
- 2,221,283 · +58.1%
- By 2100
- 2,509,976 · +78.6%
Race, ethnicity, and origin ACS 2023
- Neighborhood character
- Highly diverse neighborhood (Simpson 0.75)
- Race & ethnicity
- White 33% Black 29% Asian 16% Hispanic / Latino 15% Two or more races 8%
- Hispanic origin (detail)
- Mexican 9%
- Common ancestry
- Portuguese 6% Swiss 3% Romanian 2%
- Foreign-born
- 22% · Canada, Vietnam
- Languages at home
- 70% English-only · Spanish 13% Other Asian/Pacific 10% Vietnamese 2%
Political lean MEDSL · Hennepin
- 2024 margin
- Solid D (+42.6) · D 70.2% · R 27.5% · Other 2.3%
- 2008→2024 swing
- +14.0pp toward D · 2008: 28.6pp · 2024: 42.6pp
- All cycles
- 2024: D+42.6 2020: D+43.2 2016: D+35.3 2012: D+27.1 2008: D+28.6
Not yet ingested
- Civics
- —
Market trends
- HPI YoY
- ▼ -163.41%
- Current HPI
- 280.4391
- Rent YoY
- —
- Metro
- Minneapolis-St. Paul-Bloomington, MN-WI
- State GDP YoY
- ▲ 2.41%
- F500 in state
- 34
Industry mix (Fortune 500 HQ in MN)
| Industry | F500 HQs | Revenue |
|---|---|---|
| Healthcare | 2 | $407B |
|
||
| Retail | 2 | $150B |
|
||
| Consumer Goods | 2 | $32B |
|
||
| Industrial Machinery | 2 | $6B |
|
||
| Agriculture | 1 | $40B |
|
||
| Healthcare / Medical Devices | 1 | $32B |
|
||
Price history
+641.9% since first listed22 events — show timeline
- 2026-06-15 Listing Removed — NORTHSTARMLS as Distributed by MLS Grid
- 2026-06-15 Listed $319,000 NORTHSTARMLS as Distributed by MLS Grid
- 2026-06-08 Price Changed $325,000 NORTHSTARMLS as Distributed by MLS Grid
- 2026-05-28 Price Changed $330,000 NORTHSTARMLS as Distributed by MLS Grid
- 2026-05-16 Listed $340,000 NORTHSTARMLS as Distributed by MLS Grid
- 2026-05-12 Coming Soon — NORTHSTARMLS as Distributed by MLS Grid
- 2020-10-13 Sold (Public Records) $258,000 Public Records
- 2020-09-04 Sold (MLS) $258,000 NORTHSTARMLS as Distributed by MLS Grid
- 2020-06-19 Pending — NORTHSTARMLS as Distributed by MLS Grid
- 2020-06-12 Contingent — NORTHSTARMLS as Distributed by MLS Grid
- 2020-06-06 Listed $259,900 NORTHSTARMLS as Distributed by MLS Grid
- 2019-12-20 Sold (Public Records) $170,000 Public Records
- 2019-12-16 Sold (MLS) $170,000 NORTHSTARMLS as Distributed by MLS Grid
- 2019-11-12 Pending — NORTHSTARMLS as Distributed by MLS Grid
- 2019-11-01 Relisted — NORTHSTARMLS as Distributed by MLS Grid
- 2019-10-07 Listing Removed — NORTHSTARMLS as Distributed by MLS Grid
- 2019-09-27 Listed $180,000 NORTHSTARMLS as Distributed by MLS Grid
- 2003-03-21 Sold (Public Records) $136,000 Public Records
- 2003-03-10 Sold (MLS) $136,000 NORTHSTARMLS as Distributed by MLS Grid
- 2003-02-09 Listing Removed — NORTHSTARMLS as Distributed by MLS Grid
- 2003-02-04 Listed $135,000 NORTHSTARMLS as Distributed by MLS Grid
- 1978-02-01 Sold (Public Records) $43,000 Public Records
Property tax history
+6.1%/yrLatest (2025): $4,217 · +6.1% YoY. Source: county tax records.
Cash-flow waterfall
monthlySold comps — $/sqft
last 12 mo · ≤1 miLoading sold comps…