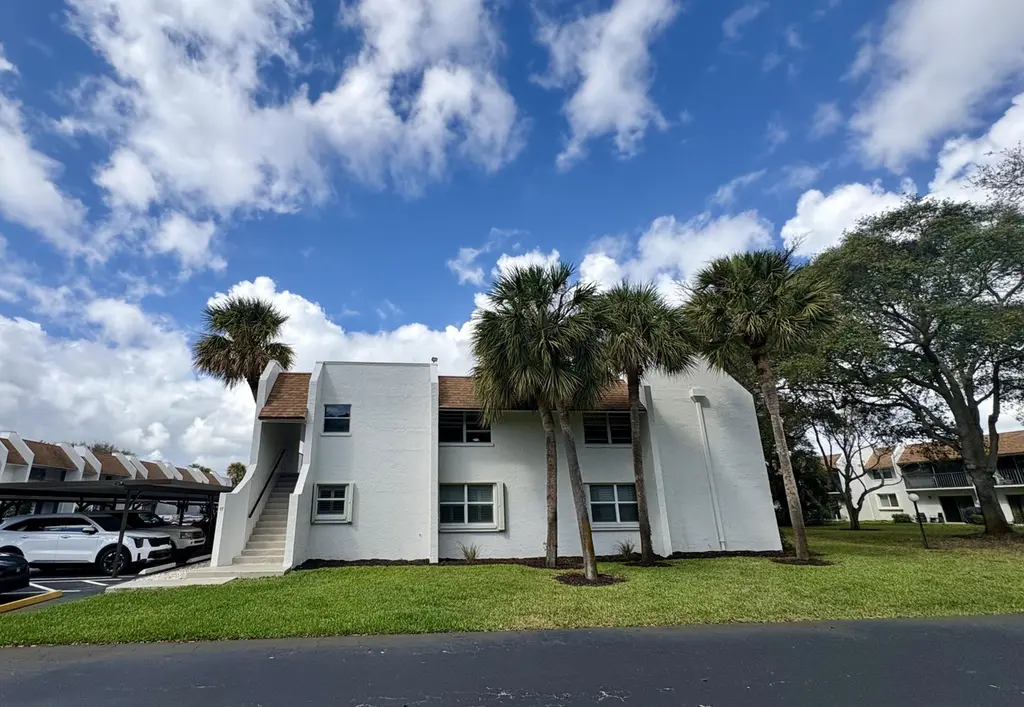
2915 SW 22nd Ave #201 · Delray Beach, FL
Flood risk 4/10 · Minor
- FEMA flood zone
- X (unshaded)
- Chance of flooding over 30 yrs
- 0.22%
- Est. flood insurance / yr
- $507 – $1,088
Fire risk 1/10 · Minimal
- Est. fire insurance / yr
- $947 – $1,759
Heat risk 10/10 · Severe
- Hot days now (above 106°F)
- 7 days/yr
- Hot days in 30 yrs
- 26 days/yr
Wind risk 10/10 · Severe
- Chance of severe wind over 30 yrs
- 99.0%
Air-quality risk 3/10 · Minor
- Unhealthy air days now
- 2 days/yr
- Unhealthy air days in 30 yrs
- 3 days/yr
Risk factors via First Street. Map © Google.
Why this score? — see what drove the C+ grade
The composite is a weighted blend of 9 inputs, each scored 0–100. Each bar is that input's sub-score; the figure is the points it added to the 100-point composite (weight × sub-score).
- Cash flow +25.2/30.0
- DSCR +8.3/10.0
- ARV discount +7.5/15.0
- 1% rule +6.6/10.0
- Schools +4.3/10.0
- Livability +3.9/5.0
- Condition / age +3.8/5.0
- Rent growth +3.0/5.0
- Appreciation +0.0/10.0
$210,000
🖨 Deal sheet (PDF) 📄 Offer letter ✓ Due diligence
Listing remarks MLS
CORNER UNIT WITH SCREENED PATIO TO A LOVELY GARDEN VIEW. NEW CARPET, TILE,PAINT & APPLIANCES.CLUBHOUSE W/HEATED POOL,EXCERCISE RM,BILLIARDS, KITCHEN,CARD RM,TENNIS COURTS.MINUTES TO SHOPPING,BEACH & I-95.
Key facts
- 2 parking spots
- Built 1984
- Listed 83 days
Property features AI
Finance
- HOA & community: Pets allowed (cats and dogs allowed; number limit applies)
Exterior
- Parking: Detached carport; Carport with 1 covered space; 2 total parking spaces (includes guest parking)
- Utilities: Public water; Public sewer; Sewer available
- Home design: Condominium; One level (living area on one level); Faces south
- Construction: CBS construction; Other roof; Built as part of a 2-story building
- Exterior features: Not waterfront; Common area accessibility
Interior
- Kitchen: Dishwasher
- Bedrooms: 2 bedrooms (main level)
- Flooring: Tile
- Bathrooms: 2 full bathrooms (main level)
- Heating & cooling: Central electric heating; Central electric air conditioning
- Interior features: Walk-in closet(s); Updated/remodeled condition; Unfurnished
- Laundry & utility: Inside laundry room
Neighborhood map
What this means for you Summary
Snapshot
- This is a 2-bed/2.0-bath condo listed at $210k. Condition is rated good.
Deal economics
- At list price, monthly cash flow is $472 ($6k/yr) — positive.
- The deal already cash-flows at list — no discount required.
- Meets the 1% rule at list price ($2k rent vs $210k).
- Recommended offer: $197k (6.0% below list) — sets the bar for market timing.
- Cap rate 9.0% vs local median 4.3% in Delray Beach — top-decile yield for the area; either an underpriced asset or a hidden risk that comps aren't pricing in. Stress-test before assuming the spread holds.
Location & tenants
- Location reads 77/100 on livability (#202 in FL, #3,160 nationally) — a middle-class / working-renter tenant base. Strengths: housing A+, health & safety A+, commute A-; Watch: cost of living C-, crime D-, amenities F.
- Palm Beach (suburban): math 46% / reading 53% proficiency, ranked #34 of 73 in FL (top 47%) — families likely to look elsewhere, expect single-tenant / working-renter base with shorter leases.
- Zoned schools: Orchard View Elementary School (math 48% / reading 47%, grade D, #1,182 of 2,144 statewide, top 55%, 596 students, 76% FRL); Boca Raton Community Middle School (math 59% / reading 61%, grade B, #135 of 571 statewide, top 24%, 1,225 students, 41% FRL); Spanish River Community High School (math 64% / reading 74%, grade B, #63 of 667 statewide, top 10%, 2,578 students, 25% FRL) — zoned schools at 47% FRL track the district average.
- Market conditions: Rents rising (+1.8%/yr); 357 active listings in the ZIP; 40 comparable units currently listed for rent nearby; rentals at typical pace (median 20d on market — plan ~3-4 weeks tenant-placement turnaround); solid renter incomes; 3,974 units permitted in Palm Beach County in 2024 (1,012 in 5+ unit buildings).
- This rent runs 37% of the median local income ($78k/yr) — at the standard rent-burdened threshold; future hikes will face affordability resistance.
Forward outlook
- Local home prices are declining (-3.0%/yr); year-one equity from $1k of loan paydown is wiped out by about $6k of value loss. Plan a longer hold.
- Palm Beach County population projected at +30% by 2050 — long-run rental-demand tailwind backs the buy-and-hold thesis.
Negotiation context
- It's been on market 83 days — a 6% lower offer ($197k) is reasonable based on typical stale-listing flexibility.
- 2 sale attempts since 21y ago; this cycle's ask has dropped $46k (18%) from the opening price — seller is motivated, your offer sets the floor, not the list.
- Current owner paid $153k; 37% above their basis — modest negotiation headroom, anchor on the comps not their cost.
Risks & watch-outs
- Climate carrying-cost: severe wind risk, 99% chance of damaging wind over 30y; extreme-heat days projected 7→26/yr by 2055 (HVAC capex compounding) — expect insurance premiums to compound above CPI over the hold.
Questions for the listing agent
- It's been on market 83 days. Have you received any prior offers? Is the seller open to a 6% concession, seller financing, or rate buy-down credit?
- Any open or pending special assessments — roof, HVAC, plumbing, elevator, façade? What's the per-unit balance and payoff schedule, and is the seller paying it off at close or rolling it to the buyer?
- Why hasn't it sold? Are there any deal-killer items the seller is aware of (foundation, flood, title, zoning, code violations)?
- Is there a deadline driving the sale (1031 exchange, divorce, estate, relocation)? That informs how much negotiation room exists.
- Schools are B-rated — typically a magnet for longer-tenancy family renters. What's the average tenant stay here, and is there a school-zone premium baked into asking?
- Crime grade is D in this area — have there been break-ins, vandalism, or insurance claims at this property in the last 3 years? What carrier currently insures it and at what premium?
- What's the average days-on-market for RENTAL listings here right now (not sales)? A rising rental-DOM trend means longer vacancies and softer asking-rent achievability than the comps imply.
- What's the recent tenant-quality profile in this submarket — average credit score on applications, eviction rate, late-payment / NSF rate, and stable-employment percentage? A property-management company in the area should have these aggregated.
- How much new apartment / multifamily construction is in the pipeline within 1–3 miles? Heavy new supply (>2% of stock underway) typically softens rents 12–24 months out; light construction supports rent growth.
Investment metrics
- 1% rule
- 1.16% ✓
- Cap rate
- 8.99%
- Cash-on-cash
- 9.63%
- DSCR
- 1.43
- GRM
- 7.2
CMA / ARV
No comps found within radius.
Projected returns pro-forma
-3.0% appreciation · 1.83% rent growth · sell at horizon
- IRR
- -3.1%
- Equity multiple
- 0.88×
- Total profit
- $-6,775
- Equity at exit
- $31,312
- IRR
- 5.2%
- Equity multiple
- 1.37×
- Total profit
- $21,590
- Equity at exit
- $18,157
Cash invested: $58,800 (down + closing). Projections, not guarantees.
Landlord ↔ Tenant lean methodology
- Overall (STATE)
- 87 Strongly Landlord-Friendly
- State Florida
- 87 Strongly Landlord-Friendly · R+3
- County
- — inherits STATE
- City
- — inherits STATE
ZIP-level market 33445
- Rents YoY
- 1.8%
- Active inventory
- 357
- Price-to-rent
- 7.2×
Monthly cashflow live
- Estimated rent
- $2,434 high interval (Pro) →
- Mortgage (P&I)
- −$1,101
- Tax est. 1.5%
- −$262 /mo · $3,150/yr
- Insurance
- −$88
- HOA
- −$0
- Vacancy / Maint / Mgmt
- −$511
- Net cashflow
- $472
Break-even live
Sensitivity live
| Price | -10% $617 | -5% $544 | +0% $472 | +5% $399 | +10% $327 |
|---|---|---|---|---|---|
| Rent | -10% $280 | -5% $376 | +0% $472 | +5% $568 | +10% $664 |
| Rate | -1.0pp $578 | -0.5pp $525 | base $472 | +0.5pp $417 | +1.0pp $362 |
UW: 25.0% down · 7.5% · 30yr · 1.5% tax · 5.0% vac · 8.0% maint · 8.0% mgmt
Financing live
Cash to close
- Down payment
- $52,500
- Closing costs
- $6,300
- Reserves months
- —
- Total cash needed
- —
Loan-product check · same deal, 3 products live
Conventional
25% down · 7.5% · 30yr
- Down + closing
- —
- Monthly P&I
- —
- Monthly cashflow
- —
- DSCR
- —
- Eligible?
- —
Personal DTI + credit; lowest rate.
DSCR
20% down · 8.5% · 30yr
- Down + closing
- —
- Monthly P&I
- —
- Monthly cashflow
- —
- DSCR
- —
- Eligible?
- —
No personal income docs; deal must DSCR.
Hard money
10% down · 12.0% · 12mo
- Down + closing
- —
- Monthly P&I
- —
- Monthly cashflow
- —
- DSCR
- —
- Eligible?
- —
Short-term bridge; refi at stabilization.
Rent comps 40 comps
| Address | Beds | Baths | Sqft | Rent | $/sqft | DOM | Units | Dist |
|---|---|---|---|---|---|---|---|---|
| 2885 SW 22nd Ave #106 Delray Beach, FL | 2.0 | 2.0 | 1136 | $2,000 | $1.76 | 5d | 1 | 0.04mi |
| 2805 SW 22nd Ave #104 Delray Beach, FL | 2.0 | 2.0 | 964 | $2,450 | $2.54 | 9d | 1 | 0.04mi |
| 2805 SW 22nd Ave #104 Delray Beach, FL | 2.0 | 2.0 | 964 | $2,500 | $2.59 | 25d | 1 | 0.04mi |
| 2825 SW 22nd Ave #201 Delray Beach, FL | 2.0 | 2.0 | 1142 | $2,150 | $1.88 | 6d | 1 | 0.05mi |
| 2955 SW 22nd Ave #2080 Delray Beach, FL | 2.0 | 2.0 | 1116 | $2,200 | $1.97 | 9d | 1 | 0.07mi |
| 2865 SW 22nd Ave #105 Delray Beach, FL | 2.0 | 2.0 | 1136 | $2,500 | $2.20 | 0d | 1 | 0.09mi |
| 2865 SW 22nd Ave #105 Delray Beach, FL | 2.0 | 2.0 | 1136 | $2,400 | $2.11 | 0d | 1 | 0.09mi |
| 2975 SW 22nd Ave #2020 Delray Beach, FL | 2.0 | 2.0 | 1096 | $2,000 | $1.82 | 22d | 1 | 0.09mi |
| 2865 SW 22nd Ave #1080 Delray Beach, FL | 2.0 | 2.0 | 1142 | $2,150 | $1.88 | 9d | 1 | 0.09mi |
| 2900 SW 22nd Ave #5110 Delray Beach, FL | 2.0 | 2.0 | 1126 | $2,200 | $1.95 | 22d | 1 | 0.18mi |
| 2900 SW 22nd Ave #5020 Delray Beach, FL | 2.0 | 2.0 | 1126 | $2,000 | $1.78 | 25d | 1 | 0.18mi |
| 2740 SW 22nd Ave #1605 Delray Beach, FL | 2.0 | 2.0 | 1013 | $2,000 | $1.97 | 9d | 1 | 0.19mi |
| 2335 SW 22nd Ave #104 Delray Beach, FL | 2.0 | 2.0 | 1120 | $2,500 | $2.23 | 25d | 1 | 0.22mi |
| 2906 SW 21st Ter Unit 31b2 Delray Beach, FL | 2.0 | 2.0 | 1120 | $2,150 | $1.92 | 25d | 1 | 0.22mi |
| 2820 SW 22nd Ave Unit 211 Delray Beach, FL | 2.0 | 2.0 | 1126 | $2,100 | $1.87 | 4d | 1 | 0.23mi |
| 2315 SW 22nd Ave #2020 Delray Beach, FL | 2.0 | 2.0 | 985 | $2,300 | $2.34 | 21d | 1 | 0.24mi |
| 1874 Heron Club Dr Delray Beach, FL | 2.0 | 1.0–2.0 | 889 | $3,593 | $4.04 | 0d | 7 | 0.24mi |
| 2660 SW 22nd Ave #1203 Delray Beach, FL | 2.0 | 2.0 | 1013 | $2,000 | $1.97 | 25d | 1 | 0.25mi |
| 2440 SW 22nd Ave #703 Delray Beach, FL | 2.0 | 2.0 | 1013 | $2,025 | $2.00 | 18d | 1 | 0.26mi |
| 2900 SW 22nd Cir Unit 5020 Delray Beach, FL | 2.0 | 2.0 | 1126 | $2,000 | $1.78 | 20d | 1 | 0.30mi |
| 2340 SW 22nd Ave #306 Delray Beach, FL | 2.0 | 2.0 | 1066 | $1,600 | $1.50 | 20d | 1 | 0.30mi |
| 3011 SW 21st Ter Delray Beach, FL | 2.0 | 2.0 | 1348 | $2,550 | $1.89 | 25d | 1 | 0.30mi |
| 2300 SW 22nd Ave #109 Delray Beach, FL | 2.0 | 2.0 | 1013 | $1,899 | $1.87 | 25d | 1 | 0.32mi |
| 2300 SW 22nd Ave #109 Delray Beach, FL | 2.0 | 2.0 | 1013 | $1,899 | $1.87 | 9d | 1 | 0.32mi |
| 3118 SW 20th Ter Unit 24A2 Delray Beach, FL | 2.0 | 2.0 | 1316 | $2,295 | $1.74 | 25d | 1 | 0.33mi |
| 3015 SW 21st Ter Unit 371B Delray Beach, FL | 2.0 | 2.0 | 1120 | $2,800 | $2.50 | 4d | 1 | 0.33mi |
| 1335 Crystal Way Unit A Delray Beach, FL | 2.0 | 2.0 | 978 | $2,400 | $2.45 | 0d | 1 | 0.42mi |
| 1523 Gallinule Dr Delray Beach, FL | 3.0 | 2.0 | 1500 | $4,400 | $2.93 | 20d | 1 | 0.47mi |
| 2044 Alta Meadows Ln #1809 Delray Beach, FL | 2.0 | 2.0 | 1302 | $3,200 | $2.46 | 25d | 1 | 0.47mi |
| 2042 Alta Meadows Ln #1712 Delray Beach, FL | 2.0 | 2.0 | 1058 | $2,750 | $2.60 | 25d | 1 | 0.49mi |
| 1495 Spring Harbor Dr Delray Beach, FL | 2.0 | 2.0 | 1175 | $2,797 | $2.38 | 14d | 1 | 0.56mi |
| 1495 Spring Harbor Dr Delray Beach, FL | 3.0 | 2.0 | 1335 | $2,874 | $2.15 | 3d | 1 | 0.56mi |
| 1495 Spring Harbor Dr Delray Beach, FL | 3.0 | 2.0 | 1335 | $3,454 | $2.59 | 19d | 1 | 0.56mi |
| 1495 Spring Harbor Dr Delray Beach, FL | 3.0 | 2.0 | 1335 | $3,082 | $2.31 | 12d | 1 | 0.56mi |
| 2736 Carnation Ct Delray Beach, FL | 3.0 | 2.0 | 1496 | $3,400 | $2.27 | 6d | 1 | 0.57mi |
| 2736 Carnation Ct Delray Beach, FL | 3.0 | 2.0 | 1496 | $3,400 | $2.27 | 23d | 1 | 0.57mi |
| 2036 Alta Meadows Ln #1407 Delray Beach, FL | 2.0 | 2.0 | 1175 | $3,300 | $2.81 | 23d | 1 | 0.57mi |
| 2756 Carnation Ct Delray Beach, FL | 2.0 | 2.0 | 1407 | $3,200 | $2.27 | 21d | 1 | 0.59mi |
| 1315 Gallinule Dr Delray Beach, FL | 3.0 | 2.0 | 1404 | $4,700 | $3.35 | 25d | 1 | 0.60mi |
| 2030 Alta Meadows Ln #1208 Delray Beach, FL | 3.0 | 2.0 | 1362 | $3,300 | $2.42 | 25d | 1 | 0.64mi |
HOA detail condo
- Monthly dues
- $0 · $0/yr
- Likely covers
- pool
- Assessments
- None detected in remarks — confirm with the listing agent.
Listing history 20 events
-
2026-06-21days on market $210,000 Active 83 DOM
-
2026-06-18days on market $210,000 Active 80 DOM
-
2026-06-17days on market $210,000 Active 79 DOM
-
2026-06-16days on market $210,000 Active 78 DOM
-
2026-06-15days on market $210,000 Active 77 DOM
-
2026-06-13days on market $210,000 Active 75 DOM
-
2026-06-09days on market $210,000 Active 71 DOM
-
2026-06-08days on market $210,000 Active 70 DOM
-
2026-06-07days on market $210,000 Active 69 DOM
-
2026-06-04days on market $210,000 Active 66 DOM
-
2026-06-03days on market $210,000 Active 65 DOM
-
2026-06-02pricedays on market $210,000 Active 64 DOM
-
2026-06-01days on market $220,000 Active 63 DOM
-
2026-05-31days on market $220,000 Active 62 DOM
-
2026-05-13price $228,000
-
2026-04-16price $239,000
-
2026-03-30$256,000 Active
-
2005-03-24soldstatus $153,000 212-char remark
Show marketing remark (212 chars)
CORNER UNIT WITH SCREENED PATIO TO A LOVELY GARDEN VIEW. NEW CARPET, TILE,PAINT & APPLIANCES.CLUBHOUSE W/HEATED POOL,EXCERCISE RM,BILLIARDS, KITCHEN,CARD RM,TENNIS COURTS.MINUTES TO SHOPPING,BEACH & I-95.
-
2005-02-10historical 212-char remark
Show marketing remark (212 chars)
CORNER UNIT WITH SCREENED PATIO TO A LOVELY GARDEN VIEW. NEW CARPET, TILE,PAINT & APPLIANCES.CLUBHOUSE W/HEATED POOL,EXCERCISE RM,BILLIARDS, KITCHEN,CARD RM,TENNIS COURTS.MINUTES TO SHOPPING,BEACH & I-95.
-
2005-01-25$160,000 212-char remark
Show marketing remark (212 chars)
CORNER UNIT WITH SCREENED PATIO TO A LOVELY GARDEN VIEW. NEW CARPET, TILE,PAINT & APPLIANCES.CLUBHOUSE W/HEATED POOL,EXCERCISE RM,BILLIARDS, KITCHEN,CARD RM,TENNIS COURTS.MINUTES TO SHOPPING,BEACH & I-95.
ⓘ Source: listings_history table (triggers on properties + properties_extension) + one-shot
backfill from property_details.listing_events for pre-trigger history.
Climate risk First Street
- Flood 4/10 Moderate FEMA zone X (unshaded) · 22% chance over 30 yrs
- Wildfire 1/10 Low
- Heat 10/10 Extreme 7 d/yr ≥106°F today · 26 d/yr by 30 yrs out
- Wind 10/10 Extreme 99% chance of damaging wind over 30 yrs
- Air quality 3/10 Moderate 2 unhealthy d/yr today · 3 by 30 yrs out
Nearby sold comps map
Loading sold comps map…
Walkable amenities ~0.75 mi
Loading nearby amenities…
Taxation est. · year 1
- Rental income
- $29,211
- − Mortgage interest
- −$11,763
- − Property taxes
- −$3,150
- − Insurance
- −$1,050
- − Repairs & maintenance
- −$2,337
- − Management
- −$2,337
- − Depreciation
- −$6,109
- Taxable income
- $2,465
- Est. tax owed @ 24.0%
- −$592
- After-tax cash flow
- $5,070/yr
For passive investors: Depreciation is non-cash, so a rental often shows a tax loss while cash-flowing — sheltering income. Rental losses are passive: they offset passive income freely, and up to $25,000/yr can offset ordinary (W-2) income if you actively participate and your MAGI is under $100k (phasing out to $0 by $150k); unused losses carry forward. On sale, claimed depreciation is recaptured at up to 25%, and gains may owe capital-gains tax (a 1031 exchange can defer both). Figures are a year-1 estimate at your 24.0% rate — not tax advice; consult a CPA.
Condition & rehab AI · 13 photos
This corner unit is in good condition with a good roof and well-maintained exterior. It needs updates to the kitchen and bathrooms to increase its value.
Repairs flagged
- Major Kitchen appliances — Old and outdated, need replacement.
- Major Bathroom fixtures — Dated and worn, need replacement.
- Major Kitchen cabinets — Old and dated, need replacement or updating.
Value-add opportunities
- Both New kitchen appliances — Modernizes the space and increases appeal.
- Both New bathroom fixtures — Enhances functionality and aesthetics.
- Both Painting exterior walls — Fresh paint improves curb appeal and value.
- Both New flooring in kitchen and bathrooms — Modernizes the space and improves functionality.
Renovation cost estimate screening
| Repair item | Severity | Est. cost |
|---|---|---|
| Kitchen appliances · Old and outdated, need replacement. | Major | $15,000–50,000 |
| Bathroom fixtures · Dated and worn, need replacement. | Major | $15,000–50,000 |
| Kitchen cabinets · Old and dated, need replacement or updating. | Major | $15,000–50,000 |
| Total estimated repair cost · 3 items | $45,000–150,000 |
Value-add ROI direction
- Both New kitchen appliances — Modernizes the space and increases appeal. ↑
- Both New bathroom fixtures — Enhances functionality and aesthetics. ↑
- Both Painting exterior walls — Fresh paint improves curb appeal and value. ↑
- Both New flooring in kitchen and bathrooms — Modernizes the space and improves functionality. ↑
ⓘ Cost ranges are severity-bucket heuristics (US national rule-of-thumb). Get contractor quotes + a written scope before underwriting a rehab budget.
Schools (NCES district)
- District
- Palm Beach
- NCES district ID
- 1201500
- Math proficiency
- 46% ▼ -16.00%
- Reading proficiency
- 53% ▼ -4.00%
- Median HH income
- $53,943
- Composite
- 42.72/100
- National rank
- #3160
- State rank
- #34 of 73 in FL
Livability — Delray Beach
- Score
- 77/100
- State rank
- #202
- US rank
- #3160
Category grades
Schools grade is shown separately in the Schools card above.
Census & demographics
- Census place
- Delray Beach, FL
- County
- Palm Beach County · 1,438,312 people
- City population
- 123,167
- Metro
- Miami-Fort Lauderdale-Pompano Beach, FL
- Population (ZIP)
- 33,122
- Household income
- $78,163
- Rent vs Own
- Severe rent burden
- 1649.0
Population outlook (Palm Beach County) Hauer SSP2
- Today (2025)
- 1,637,487 people
- By 2030
- 1,743,255 · +6.5%
- By 2040
- 1,948,712 · +19.0%
- By 2050
- 2,132,979 · +30.3%
- By 2075
- 2,530,027 · +54.5%
- By 2100
- 2,706,979 · +65.3%
Race, ethnicity, and origin ACS 2023
- Neighborhood character
- Diverse neighborhood (Simpson 0.62)
- Race & ethnicity
- White 55% Black 24% Hispanic / Latino 11% Two or more races 11% Asian 4%
- Hispanic origin (detail)
- Puerto Rican 3% Cuban 2%
- Common ancestry
- Hispanic 14% Romanian 3% Scotch-Irish 3%
- Foreign-born
- 27% · Canada, Jamaica, Dominican Republic
- Languages at home
- 66% English-only · French/Haitian/Cajun 18% Spanish 9% Other Indo-European 4%
Political lean MEDSL · Palm Beach
- 2024 margin
- Toss-up / Even · D 50.0% · R 49.2%
- 2008→2024 swing
- -22.1pp toward R · 2008: 22.9pp · 2024: 0.8pp
- All cycles
- 2024: D+0.8 2020: D+12.8 2016: D+15.3 2012: D+17.0 2008: D+22.9
Not yet ingested
- Civics
- —
Market trends
- HPI YoY
- ▼ -258.16%
- Current HPI
- 349.5505
- Rent YoY
- ▲ 1.83%
- Metro
- Miami-Fort Lauderdale-Pompano Beach, FL
- State GDP YoY
- ▲ 3.28%
- F500 in state
- 36
Industry mix (Fortune 500 HQ in FL)
| Industry | F500 HQs | Revenue |
|---|---|---|
| Industrial Technology | 2 | $29B |
|
||
| Insurance | 2 | $17B |
|
||
| Retail | 1 | $60B |
|
||
| Technology Distribution | 1 | $58B |
|
||
| Homebuilding | 1 | $35B |
|
||
| Technology Manufacturing | 1 | $35B |
|
||
Price history
+42.5% since first listed6 events — show timeline
- 2026-05-13 Price Changed $228,000 Beaches MLS
- 2026-04-16 Price Changed $239,000 Beaches MLS
- 2026-03-30 Listed $256,000 Beaches MLS
- 2005-03-24 Sold (MLS) $153,000 Beaches MLS
- 2005-02-10 Listing Removed — Beaches MLS
- 2005-01-25 Listed $160,000 Beaches MLS
Cash-flow waterfall
monthlySold comps — $/sqft
last 12 mo · ≤1 miLoading sold comps…