15610 W SR 2 Hwy Unit A-10 · Fairchild AFB, WA
Flood risk 1/10 · Minimal
- FEMA flood zone
- X (unshaded)
- Chance of flooding over 30 yrs
- 0.0%
- Est. flood insurance / yr
- $507 – $1,088
Fire risk 7/10 · Major
- Est. fire insurance / yr
- $604 – $1,122
Heat risk 3/10 · Minor
- Hot days now (above 91°F)
- 7 days/yr
- Hot days in 30 yrs
- 15 days/yr
Wind risk 1/10 · Minimal
- Chance of severe wind over 30 yrs
- —
Air-quality risk 8/10 · Major
- Unhealthy air days now
- 13 days/yr
- Unhealthy air days in 30 yrs
- 16 days/yr
Risk factors via First Street. Map © Google.
Why this score? — see what drove the B grade
The composite is a weighted blend of 9 inputs, each scored 0–100. Each bar is that input's sub-score; the figure is the points it added to the 100-point composite (weight × sub-score).
- Cash flow +30.0/30.0
- 1% rule +10.0/10.0
- DSCR +10.0/10.0
- ARV discount +7.5/15.0
- Schools +5.1/10.0
- Condition / age +4.0/5.0
- Livability +2.9/5.0
- Rent growth +2.5/5.0
- Appreciation +0.0/10.0
$79,999
🖨 Deal sheet (PDF) 📄 Offer letter ✓ Due diligence
Listing remarks
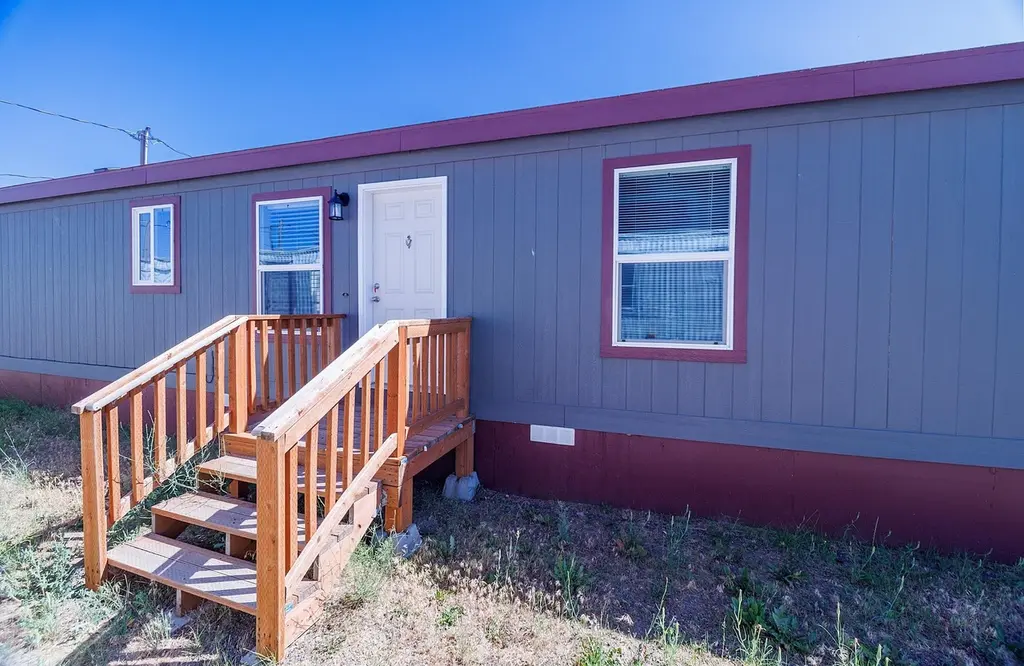
First-time homebuyer? Ready to downsize? Discover the ideal balance of city convenience and country charm in this well-maintained 2019 Broadmore manufactured home, offering 3 bedrooms and 2 bathrooms in Fairchild Community Manufactured Home Park. Designed with energy efficiency and comfort in mind, this Northwest-certified home features a smart floor plan that makes everyday living both functional and enjoyable. Location highlights: Minutes from shopping, schools, and Airway Heights, Close to Fairchild Air Force Base, Easy access to Northern Quest & Spokane Tribe casinos, Just a short drive to Downtown Spokane. Community details: Pet-friendly (2 pets up to 40 lbs each), Two parking sp
Key facts
- Smart floor plan
- Pet friendly
- 1,987 sq ft lot
Tags
Property features AI
Finance
- Financial info: $405 annual tax
- HOA & community: Located in Fairchild Comm mobile home park; Land lease: $715
Exterior
- Parking: Off-site parking; No designated on-site parking
- Utilities: High-speed internet available
- Home design: Manufactured home (Broadmore); Single-story (manufactured house)
- Construction: Wood siding; Composition roof; Block foundation; Skirted; Tie-downs; Axel removable
- Exterior features: Level, open lot; City street frontage; Paved road access; Paver block (parking surface)
Interior
- Kitchen: Free-standing range; Refrigerator
- Bedrooms: 3 bedrooms
- Heating & cooling: Electric forced-air heating
- Interior features: Free-standing range; Refrigerator
Neighborhood map
What this means for you Summary
Snapshot
- This is a 3-bed/2.0-bath manufactured listed at $80k. Condition is rated good.
Deal economics
- At list price, monthly cash flow is $862 ($10k/yr) — positive.
- The deal already cash-flows at list — no discount required.
- Meets the 1% rule at list price ($2k rent vs $80k).
- Recommended offer: $78k (3.0% below list) — sets the bar for market timing.
Location & tenants
- Location reads 58/100 on livability (#497 in WA) — a working-class tenant base; expect higher turnover. Strengths: crime A, housing B; Watch: cost of living D+, amenities F, commute F.
- Medical Lake School District (town): math 51% / reading 64% proficiency, ranked #78 of 291 in WA (top 27%) — acceptable for families but not a draw, mixed tenant base, ~2y average lease.
- Zoned schools: Hallett Elementary School (494 students, 52% FRL); Medical Lake Middle School (397 students, 45% FRL); Medical Lake High School (520 students, 40% FRL) — zoned schools average 46% FRL vs 24% district-wide (22 pts higher); higher-poverty schools than district average — tighter screening recommended.
- Market conditions: 136 active listings in the ZIP; solid renter incomes; 3,608 units permitted in Spokane County in 2024 (1,792 in 5+ unit buildings).
Forward outlook
- Local home prices are declining (-3.0%/yr); year-one equity from $553 of loan paydown is wiped out by about $2k of value loss. Plan a longer hold.
- Spokane County population projected at +13% by 2050 — modest demand growth; plan on rents tracking national, not racing it.
- At projected returns (-3.0% appreciation + 3.0% rent growth), your $22k cash investment doubles in ~3 years — after that, you're playing with house money.
Negotiation context
- It's been on market 48 days — a 3% lower offer ($78k) is reasonable based on typical stale-listing flexibility.
- 2 sale attempts with the ask held roughly flat each time — persistent listings suggest the price (not the market) is what's stuck; bring a comps-based counter.
Risks & watch-outs
- Climate carrying-cost: major wildfire risk — expect insurance premiums to compound above CPI over the hold.
Questions for the listing agent
- It's been on market 48 days. Have you received any prior offers? Is the seller open to a 3% concession, seller financing, or rate buy-down credit?
- Is there a deadline driving the sale (1031 exchange, divorce, estate, relocation)? That informs how much negotiation room exists.
- Schools are B-rated — typically a magnet for longer-tenancy family renters. What's the average tenant stay here, and is there a school-zone premium baked into asking?
- What's the average days-on-market for RENTAL listings here right now (not sales)? A rising rental-DOM trend means longer vacancies and softer asking-rent achievability than the comps imply.
- What's the recent tenant-quality profile in this submarket — average credit score on applications, eviction rate, late-payment / NSF rate, and stable-employment percentage? A property-management company in the area should have these aggregated.
- How much new for-sale + rental construction is in the pipeline within 1–3 miles? Heavy new supply typically softens prices + rents 12–24 months out; constrained supply supports both.
Investment metrics
- 1% rule
- 2.24% ✓
- Cap rate
- 19.22%
- Cash-on-cash
- 46.18%
- DSCR
- 3.05
- GRM
- 3.7
CMA / ARV
No comps found within radius.
Projected returns pro-forma
-3.0% appreciation · 3.0% rent growth · sell at horizon
- IRR
- 43.4%
- Equity multiple
- 2.87×
- Total profit
- $41,971
- Equity at exit
- $11,928
- IRR
- 49.5%
- Equity multiple
- 5.79×
- Total profit
- $107,360
- Equity at exit
- $6,917
Cash invested: $22,400 (down + closing). Projections, not guarantees.
Landlord ↔ Tenant lean methodology
- Overall (STATE)
- 28 Tenant-Leaning
- State Washington
- 28 Tenant-Leaning · D+8
- County
- — inherits STATE
- City
- — inherits STATE
ZIP-level market 99022
- Home prices YoY
- -23.9%
- Active inventory
- 136
- Price-to-rent
- 3.7×
Monthly cashflow live
- Estimated rent
- $1,791 medium interval (Pro) →
- Mortgage (P&I)
- −$420
- Tax est. 1.5%
- −$100 /mo · $1,200/yr
- Insurance
- −$33
- HOA
- −$0
- Vacancy / Maint / Mgmt
- −$376
- Net cashflow
- $862
Break-even live
Sensitivity live
| Price | -10% $917 | -5% $890 | +0% $862 | +5% $834 | +10% $807 |
|---|---|---|---|---|---|
| Rent | -10% $721 | -5% $791 | +0% $862 | +5% $933 | +10% $1,004 |
| Rate | -1.0pp $902 | -0.5pp $882 | base $862 | +0.5pp $841 | +1.0pp $820 |
UW: 25.0% down · 7.5% · 30yr · 1.5% tax · 5.0% vac · 8.0% maint · 8.0% mgmt
Financing live
Cash to close
- Down payment
- $20,000
- Closing costs
- $2,400
- Reserves months
- —
- Total cash needed
- —
Loan-product check · same deal, 3 products live
Conventional
25% down · 7.5% · 30yr
- Down + closing
- —
- Monthly P&I
- —
- Monthly cashflow
- —
- DSCR
- —
- Eligible?
- —
Personal DTI + credit; lowest rate.
DSCR
20% down · 8.5% · 30yr
- Down + closing
- —
- Monthly P&I
- —
- Monthly cashflow
- —
- DSCR
- —
- Eligible?
- —
No personal income docs; deal must DSCR.
Hard money
10% down · 12.0% · 12mo
- Down + closing
- —
- Monthly P&I
- —
- Monthly cashflow
- —
- DSCR
- —
- Eligible?
- —
Short-term bridge; refi at stabilization.
Listing history 20 events
-
2026-06-21days on market $79,999 Active 48 DOM
-
2026-06-18days on market $79,999 Active 45 DOM
-
2026-06-17days on market $79,999 Active 44 DOM
-
2026-06-16days on market $79,999 Active 43 DOM
-
2026-06-15days on market $79,999 Active 42 DOM
-
2026-06-14days on market $79,999 Active 40 DOM
-
2026-06-13days on market $79,999 Active 39 DOM
-
2026-06-10days on market $79,999 Active 37 DOM
-
2026-06-09days on market $79,999 Active 36 DOM
-
2026-06-08days on market $79,999 Active 35 DOM
-
2026-06-07days on market $79,999 Active 34 DOM
-
2026-06-05days on market $79,999 Active 31 DOM
-
2026-06-03days on market $79,999 Active 30 DOM
-
2026-06-02days on market $79,999 Active 29 DOM
-
2026-06-01days on market $79,999 Active 28 DOM
-
2026-05-31days on market $79,999 Active 27 DOM
-
2026-05-31days on market $79,999 Active 26 DOM
-
2026-05-04$79,999 Active 926-char remark
-
2026-05-01historical
-
2026-02-02$85,000 Active
ⓘ Source: listings_history table (triggers on properties + properties_extension) + one-shot
backfill from property_details.listing_events for pre-trigger history.
Climate risk First Street
- Flood 1/10 Low FEMA zone X (unshaded) · 0% chance over 30 yrs
- Wildfire 7/10 Severe
- Heat 3/10 Moderate 7 d/yr ≥91°F today · 15 d/yr by 30 yrs out
- Wind 1/10 Low
- Air quality 8/10 Severe 13 unhealthy d/yr today · 16 by 30 yrs out
Nearby sold comps map
Loading sold comps map…
Walkable amenities ~0.75 mi
Loading nearby amenities…
Taxation est. · year 1
- Rental income
- $21,493
- − Mortgage interest
- −$4,481
- − Property taxes
- −$1,200
- − Insurance
- −$400
- − Repairs & maintenance
- −$1,719
- − Management
- −$1,719
- − Depreciation
- −$2,327
- Taxable income
- $9,646
- Est. tax owed @ 24.0%
- −$2,315
- After-tax cash flow
- $8,030/yr
For passive investors: Depreciation is non-cash, so a rental often shows a tax loss while cash-flowing — sheltering income. Rental losses are passive: they offset passive income freely, and up to $25,000/yr can offset ordinary (W-2) income if you actively participate and your MAGI is under $100k (phasing out to $0 by $150k); unused losses carry forward. On sale, claimed depreciation is recaptured at up to 25%, and gains may owe capital-gains tax (a 1031 exchange can defer both). Figures are a year-1 estimate at your 24.0% rate — not tax advice; consult a CPA.
Condition & rehab AI · 12 photos
This 2019 Broadmore manufactured home is in good condition with a good condition score of 80. It is ready for a cosmetic rehab to enhance its curb appeal and interior aesthetics.
Value-add opportunities
- Both Painting exterior and interior walls — Enhances curb appeal and interior aesthetics
- Both Landscaping and curb appeal improvements — Improves curb appeal and enhances property value
- Both Add smart home features — Enhances comfort and energy efficiency
Renovation cost estimate screening
Value-add ROI direction
- Both Painting exterior and interior walls — Enhances curb appeal and interior aesthetics ↑
- Both Landscaping and curb appeal improvements — Improves curb appeal and enhances property value ↑
- Both Add smart home features — Enhances comfort and energy efficiency ↑
ⓘ Cost ranges are severity-bucket heuristics (US national rule-of-thumb). Get contractor quotes + a written scope before underwriting a rehab budget.
Schools (NCES district)
- District
- Medical Lake School District
- NCES district ID
- 5304950
- Math proficiency
- 51% ▼ -3.00%
- Reading proficiency
- 64% ▼ -3.00%
- Median HH income
- $57,496
- Composite
- 51.41/100
- National rank
- #3698
- State rank
- #78 of 291 in WA
Livability — Fairchild AFB
- Score
- 58/100
- State rank
- #497
- US rank
- #20638
Category grades
Schools grade is shown separately in the Schools card above.
Census & demographics
- County
- Spokane County · 496,401 people
- City population
- 3,016
- Metro
- Spokane-Spokane Valley, WA
- Population (ZIP)
- 8,767
- Household income
- $93,812
- Rent vs Own
- Severe rent burden
- 36.0
Population outlook (Spokane County) Hauer SSP2
- Today (2025)
- 531,314 people
- By 2030
- 549,278 · +3.4%
- By 2040
- 577,822 · +8.8%
- By 2050
- 598,188 · +12.6%
- By 2075
- 630,744 · +18.7%
- By 2100
- 622,360 · +17.1%
Race, ethnicity, and origin ACS 2023
- Neighborhood character
- Predominantly White (87%)
- Race & ethnicity
- White 87% Hispanic / Latino 7% Two or more races 4% Black 2%
- Hispanic origin (detail)
- Mexican 5%
- Common ancestry
- Italian 3% Russian 3% Lithuanian 3%
- Foreign-born
- 5% · Canada, South Korea
- Languages at home
- 93% English-only · Spanish 4% Russian/Polish/Slavic 2% German/W. Germanic 1%
Political lean MEDSL · Spokane
- 2024 margin
- Toss-up / Even · D 46.0% · R 51.0% · Other 3.0%
- 2008→2024 swing
- -3.8pp toward R · 2008: -1.1pp · 2024: -5.0pp
- All cycles
- 2024: R+5.0 2020: R+4.3 2016: R+8.3 2012: R+6.3 2008: R+1.1
Not yet ingested
- Civics
- —
Market trends
- HPI YoY
- ▼ -100.37%
- Current HPI
- 319.8943
- Rent YoY
- —
- Metro
- Spokane-Spokane Valley, WA
- State GDP YoY
- ▲ 4.65%
- F500 in state
- 22
Industry mix (Fortune 500 HQ in WA)
| Industry | F500 HQs | Revenue |
|---|---|---|
| Retail | 2 | $269B |
|
||
| Technology / Retail | 1 | $638B |
|
||
| Technology | 1 | $245B |
|
||
| Telecommunications | 1 | $38B |
|
||
| Food / Beverage | 1 | $36B |
|
||
| Automotive / Trucks | 1 | $34B |
|
||
Price history
-5.9% since first listed3 events — show timeline
- 2026-05-04 Listed $79,999 SPOKANEMLS as Distributed by MLS Grid
- 2026-05-01 Listing Removed — SPOKANEMLS as Distributed by MLS Grid
- 2026-02-02 Listed $85,000 SPOKANEMLS as Distributed by MLS Grid
Cash-flow waterfall
monthlySold comps — $/sqft
last 12 mo · ≤1 miLoading sold comps…