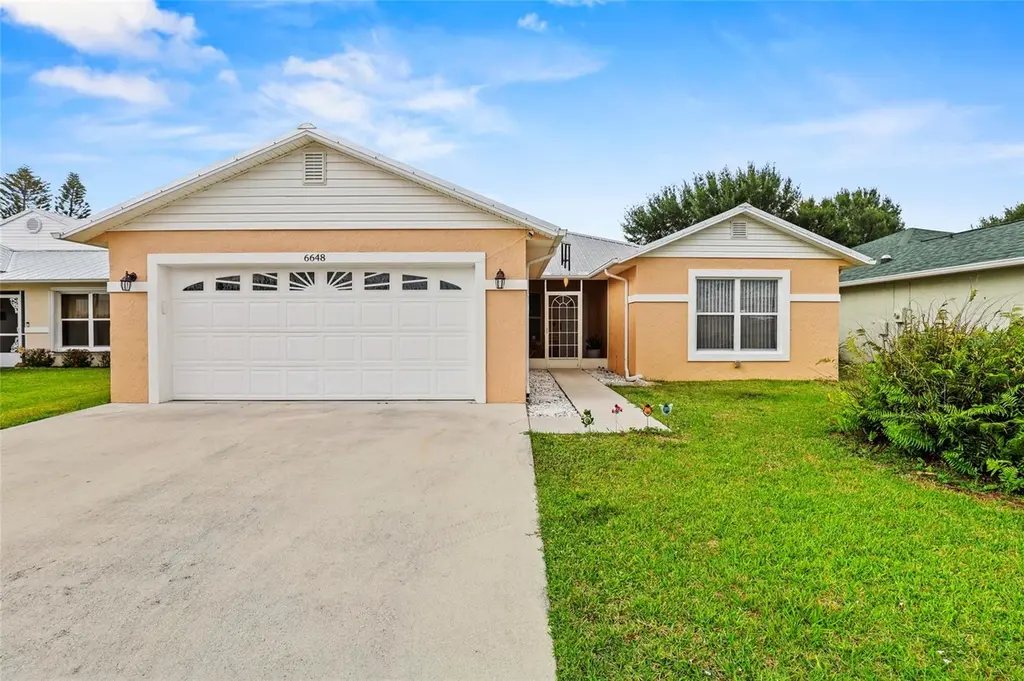
6648 Gaviota · Vero Beach South, FL
Flood risk 1/10 · Minimal
- FEMA flood zone
- X (unshaded)
- Chance of flooding over 30 yrs
- 0.0%
- Est. flood insurance / yr
- $507 – $1,088
Fire risk 4/10 · Minor
- Est. fire insurance / yr
- $947 – $1,759
Heat risk 10/10 · Severe
- Hot days now (above 107°F)
- 7 days/yr
- Hot days in 30 yrs
- 25 days/yr
Wind risk 10/10 · Severe
- Chance of severe wind over 30 yrs
- 99.0%
Air-quality risk 1/10 · Minimal
- Unhealthy air days now
- 0 days/yr
- Unhealthy air days in 30 yrs
- 0 days/yr
Risk factors via First Street. Map © Google.
Why this score? — see what drove the C- grade
The composite is a weighted blend of 9 inputs, each scored 0–100. Each bar is that input's sub-score; the figure is the points it added to the 100-point composite (weight × sub-score).
- Cash flow +21.9/30.0
- DSCR +7.0/10.0
- 1% rule +5.2/10.0
- ARV discount +4.2/15.0
- Livability +3.9/5.0
- Schools +3.7/10.0
- Rent growth +2.5/5.0
- Condition / age +2.5/5.0
- Appreciation +0.0/10.0
$209,900
🖨 Deal sheet 📄 Offer letter ✓ Due diligence
Listing remarks MLS
Welcome to this beautifully updated 3-bedroom, 2-bath home located in the up-and-coming area of Fort Pierce within a desirable 55+ community. This move-in ready property features a newer roof (2021), newer A/C (2020), and newer water heater for added peace of mind. Inside, you’ll find stylish porcelain tile flooring throughout, fully renovated tiled bathrooms and showers, quartz countertops, and newer stainless steel appliances in the kitchen. The bright and functional layout offers modern comfort with tasteful upgrades throughout. Enjoy the Florida lifestyle from the large screened-in patio and covered porch—perfect for relaxing or entertaining. Conveniently located near shopping, dining, and major roadways, this home is ideal for year-round living or a seasonal getaway in one of Fort Pierce’s growing areas.
Key facts
- Quartz countertops
- Newer a c
- Newer roof
Tags
Property features AI
Finance
- Financial info: Property is on a land lease (monthly land lease in effect, expires 2027)
- HOA & community: Senior community; Pets allowed (restrictions may apply)
Exterior
- Parking: Attached 2-car garage; Concrete driveway; Two covered parking spaces
- Utilities: Public water; Public sewer; Electricity connected; Cable available; Phone available
- Home design: Single-family residence; One-story; Resale property; Faces east
- Construction: Block/CBS construction; Shingle roof
- Exterior features: Covered patio; Screened patio; Patio; Not waterfront
Interior
- Kitchen: Dishwasher; Electric range; Microwave; Refrigerator
- Bedrooms: Three bedrooms on the main level
- Flooring: Tile
- Bathrooms: Two full bathrooms
- Heating & cooling: Central heating; Central air conditioning
- Interior features: Split bedroom layout
- Laundry & utility: Inside laundry; Electric water heater
Neighborhood map
What this means for you Summary
Snapshot
- This is a 2-bed/2.0-bath single-family listed at $210k.
Deal economics
- At list price, monthly cash flow is $331 ($4k/yr) — positive.
- The deal already cash-flows at list — no discount required.
- Meets the 1% rule at list price ($2k rent vs $210k).
- Recommended offer: $207k (1.5% below list) — sets the bar for market timing.
- Cap rate 8.2% vs local median 4.3% in Vero Beach South — top-decile yield for the area; either an underpriced asset or a hidden risk that comps aren't pricing in. Stress-test before assuming the spread holds.
Location & tenants
- Location reads 78/100 on livability (#163 in FL, #2,445 nationally) — a middle-class / working-renter tenant base. Strengths: commute A+, housing A+, health & safety A; Watch: amenities F.
- St. Lucie (urban): math 40% / reading 48% proficiency, ranked #51 of 73 in FL (top 70%) — families likely to look elsewhere, expect single-tenant / working-renter base with shorter leases.
- Market conditions: 292 active listings in the ZIP; 1 comparable units currently listed for rent nearby; 4,868 units permitted in St. Lucie County in 2024 (268 in 5+ unit buildings).
- This rent runs 41% of the median local income ($63k/yr) — at the standard rent-burdened threshold; future hikes will face affordability resistance.
Forward outlook
- Local home prices are declining (-3.0%/yr); year-one equity from $1k of loan paydown is wiped out by about $6k of value loss. Plan a longer hold.
- St. Lucie County population projected at +20% by 2050 — long-run rental-demand tailwind backs the buy-and-hold thesis.
Negotiation context
- It's been on market 30 days — a 2% lower offer ($207k) is reasonable based on typical stale-listing flexibility.
- 7 sale attempts since 5y ago with the ask held roughly flat each time — persistent listings suggest the price (not the market) is what's stuck; bring a comps-based counter.
- Current owner paid $166k; 26% above their basis — modest negotiation headroom, anchor on the comps not their cost.
Risks & watch-outs
- Climate carrying-cost: severe wind risk, 99% chance of damaging wind over 30y; extreme-heat days projected 7→25/yr by 2055 (HVAC capex compounding) — expect insurance premiums to compound above CPI over the hold.
Questions for the listing agent
- Is there a deadline driving the sale (1031 exchange, divorce, estate, relocation)? That informs how much negotiation room exists.
- What's the average days-on-market for RENTAL listings here right now (not sales)? A rising rental-DOM trend means longer vacancies and softer asking-rent achievability than the comps imply.
- What's the recent tenant-quality profile in this submarket — average credit score on applications, eviction rate, late-payment / NSF rate, and stable-employment percentage? A property-management company in the area should have these aggregated.
- How much new for-sale + rental construction is in the pipeline within 1–3 miles? Heavy new supply typically softens prices + rents 12–24 months out; constrained supply supports both.
Investment metrics
- 1% rule
- 1.02% ✓
- Cap rate
- 8.18%
- Cash-on-cash
- 6.75%
- DSCR
- 1.30
- GRM
- 8.2
CMA / ARV
- ARV (on-the-fly)
- $195,396
- Comps found
- 7
Show comp detail 7 sales within ~0.75 mi
| Address | Dist | Beds/Ba | Sqft | Sold | Price | $/sf | Match |
|---|---|---|---|---|---|---|---|
| 6631 Nuevo Lagos | 0.04mi | 3/2.0 (+1) | 1,714 (0%) | 21mo | $175,000 | $102 | 76 |
| 6655 Alemendra St | 0.14mi | 2/2.0 | 1,530 (-11%) | 2mo | $175,000 | $114 | 74 |
| 6449 Alemendra St | 0.32mi | 3/2.5 (+1) | 1,753 (+2%) | 5mo | $309,000 | $176 | 70 |
| 6539 Yedra Ave | 0.32mi | 2/2.5 | 1,839 (+7%) | 2mo | $309,000 | $168 | 69 |
| 14374 Azucena Court Ct | 0.27mi | 2/2.0 | 1,599 (-7%) | 9mo | $175,000 | $109 | 69 |
| 14126 Cisne Cir | 0.24mi | 2/2.0 | 1,487 (-13%) | 7mo | $150,000 | $101 | 61 |
| 14434 Azucena Ct | 0.30mi | 2/2.0 | 1,487 (-13%) | 24mo | $170,000 | $114 | 44 |
Match score weights: distance 35% · size 25% · config 20% · recency 20%. Top-matched comps best support the ARV.
Projected returns pro-forma
-3.0% appreciation · 3.0% rent growth · sell at horizon
- IRR
- -5.9%
- Equity multiple
- 0.78×
- Total profit
- $-12,984
- Equity at exit
- $31,297
- IRR
- 3.7%
- Equity multiple
- 1.27×
- Total profit
- $15,706
- Equity at exit
- $18,148
Cash invested: $58,772 (down + closing). Projections, not guarantees.
Landlord ↔ Tenant lean methodology
- Overall (STATE)
- 87 Strongly Landlord-Friendly
- State Florida
- 87 Strongly Landlord-Friendly · R+3
- County
- — inherits STATE
- City
- — inherits STATE
ZIP-level market 34951
- Home prices YoY
- -23.6%
- Active inventory
- 292
- Price-to-rent
- 8.2×
Monthly cashflow live
- Estimated rent
- $2,140 medium interval (Pro) →
- Mortgage (P&I)
- −$1,101
- Tax from tax record
- −$172 /mo · $2,058/yr
- Insurance
- −$87
- HOA
- −$0
- Vacancy / Maint / Mgmt
- −$449
- Net cashflow
- $331
Break-even live
UW: 25.0% down · 7.5% · 30yr · 1.5% tax · 5.0% vac · 8.0% maint · 8.0% mgmt
Financing live
Cash to close
- Down payment
- $52,475
- Closing costs
- $6,297
- Reserves months
- —
- Total cash needed
- —
Loan-product check · same deal, 3 products live
Conventional
25% down · 7.5% · 30yr
- Down + closing
- —
- Monthly P&I
- —
- Monthly cashflow
- —
- DSCR
- —
- Eligible?
- —
Personal DTI + credit; lowest rate.
DSCR
20% down · 8.5% · 30yr
- Down + closing
- —
- Monthly P&I
- —
- Monthly cashflow
- —
- DSCR
- —
- Eligible?
- —
No personal income docs; deal must DSCR.
Hard money
10% down · 12.0% · 12mo
- Down + closing
- —
- Monthly P&I
- —
- Monthly cashflow
- —
- DSCR
- —
- Eligible?
- —
Short-term bridge; refi at stabilization.
Rent comps 1 comps
| Address | Beds | Baths | Sqft | Rent | $/sqft | DOM | Units | Dist |
|---|---|---|---|---|---|---|---|---|
| 6765 Spanish Lakes Blvd Fort Pierce, FL | 2.0 | 2.0 | 1368 | $2,500 | $1.83 | 23d | 1 | 0.33mi |
Listing history 34 events
-
2026-06-18days on market $209,900 Active 30 DOM
-
2026-06-17days on market $209,900 Active 29 DOM
-
2026-06-16days on market $209,900 Active 28 DOM
-
2026-06-15days on market $209,900 Active 27 DOM
-
2026-06-14days on market $209,900 Active 25 DOM
-
2026-06-13days on market $209,900 Active 24 DOM
-
2026-06-10days on market $209,900 Active 22 DOM
-
2026-06-09days on market $209,900 Active 21 DOM
-
2026-06-08days on market $209,900 Active 20 DOM
-
2026-06-07days on market $209,900 Active 19 DOM
-
2026-06-05days on market $209,900 Active 16 DOM
-
2026-06-03days on market $209,900 Active 15 DOM
-
2026-06-02days on market $209,900 Active 14 DOM
-
2026-06-01days on market $209,900 Active 13 DOM
-
2026-05-31days on market $209,900 Active 12 DOM
-
2026-05-30days on market $209,900 Active 11 DOM
-
2026-05-21$209,900 Active 838-char remark
Show marketing remark (838 chars)
Welcome to this beautifully updated 3-bedroom, 2-bath home located in the up-and-coming area of Fort Pierce within a desirable 55+ community. This move-in ready property features a newer roof (2021), newer A/C (2020), and newer water heater for added peace of mind. Inside, you’ll find stylish porcelain tile flooring throughout, fully renovated tiled bathrooms and showers, quartz countertops, and newer stainless steel appliances in the kitchen. The bright and functional layout offers modern comfort with tasteful upgrades throughout. Enjoy the Florida lifestyle from the large screened-in patio and covered porch—perfect for relaxing or entertaining. Conveniently located near shopping, dining, and major roadways, this home is ideal for year-round living or a seasonal getaway in one of Fort Pierce’s growing areas.
-
2026-05-19$209,900 Active
-
2026-03-16historical
-
2025-09-15price $210,000
-
2025-08-22price $220,000
-
2025-08-01price $225,000
-
2025-07-17$230,000 Active
-
2022-03-04soldstatus $166,000
-
2022-03-02soldstatus $166,000 Closed
-
2022-03-02soldstatus $166,000 Closed
-
2022-01-18status Pending
-
2022-01-18status Pending
-
2022-01-10status Active
-
2022-01-10status Active
-
2022-01-03status Pending
-
2022-01-03status Pending
-
2021-12-28$162,000 Active
-
2021-12-28$162,000 Active
ⓘ Source: listings_history table (triggers on properties + properties_extension) + one-shot
backfill from property_details.listing_events for pre-trigger history.
Tax reassessment forecast FL · Resets to sale price
- Current annual tax
- $2,058 · $172/mo
- Projected year-2 tax
- $2,058 · $172/mo
- Expected delta
- $0/yr ($0/mo · 0.0%)
ⓘ Screening estimate from a state-policy table — verify with the county assessor before closing.
Climate risk First Street
- Flood 1/10 Low FEMA zone X (unshaded) · 0% chance over 30 yrs
- Wildfire 4/10 Moderate
- Heat 10/10 Extreme 7 d/yr ≥107°F today · 25 d/yr by 30 yrs out
- Wind 10/10 Extreme 99% chance of damaging wind over 30 yrs
- Air quality 1/10 Low 0 unhealthy d/yr today · 0 by 30 yrs out
Nearby sold comps map
Loading sold comps map…
Walkable amenities ~0.75 mi
Loading nearby amenities…
Taxation est. · year 1
- Rental income
- $25,675
- − Mortgage interest
- −$11,758
- − Property taxes
- −$2,058
- − Insurance
- −$1,050
- − Repairs & maintenance
- −$2,054
- − Management
- −$2,054
- − Depreciation
- −$6,106
- Taxable income
- $595
- Est. tax owed @ 24.0%
- −$143
- After-tax cash flow
- $3,824/yr
For passive investors: Depreciation is non-cash, so a rental often shows a tax loss while cash-flowing — sheltering income. Rental losses are passive: they offset passive income freely, and up to $25,000/yr can offset ordinary (W-2) income if you actively participate and your MAGI is under $100k (phasing out to $0 by $150k); unused losses carry forward. On sale, claimed depreciation is recaptured at up to 25%, and gains may owe capital-gains tax (a 1031 exchange can defer both). Figures are a year-1 estimate at your 24.0% rate — not tax advice; consult a CPA.
Schools (NCES district)
- District
- St. Lucie
- NCES district ID
- 1201770
- Math proficiency
- 40% ▼ -11.00%
- Reading proficiency
- 48% ▼ -4.00%
- Median HH income
- $44,737
- Composite
- 37.28/100
- National rank
- #4449
- State rank
- #51 of 73 in FL
Livability — Vero Beach South
- Score
- 78/100
- State rank
- #163
- US rank
- #2445
Category grades
Schools grade is shown separately in the Schools card above.
Census & demographics
- County
- Saint Lucie County · 337,150 people
- Metro
- Port St. Lucie, FL
- Population (ZIP)
- 17,148
- Household income
- $63,122
- Rent vs Own
- Severe rent burden
- 140.0
Population outlook (St. Lucie County) Hauer SSP2
- Today (2025)
- 338,016 people
- By 2030
- 355,687 · +5.2%
- By 2040
- 385,521 · +14.1%
- By 2050
- 406,106 · +20.1%
- By 2075
- 441,054 · +30.5%
- By 2100
- 436,885 · +29.2%
Race, ethnicity, and origin ACS 2023
- Neighborhood character
- Predominantly White (74%)
- Race & ethnicity
- White 74% Black 13% Hispanic / Latino 8% Two or more races 7% Asian 2%
- Hispanic origin (detail)
- Mexican 2% Puerto Rican 2% Cuban 2%
- Common ancestry
- Romanian 3% Italian 2% Lithuanian 2%
- Foreign-born
- 10% · Canada, Jamaica, Vietnam
- Languages at home
- 88% English-only · Spanish 7% French/Haitian/Cajun 3% Vietnamese 1%
Political lean MEDSL · St. Lucie
- 2024 margin
- Lean R (+9.1) · D 45.1% · R 54.2%
- 2008→2024 swing
- -21.2pp toward R · 2008: 12.1pp · 2024: -9.1pp
- All cycles
- 2024: R+9.1 2020: R+1.6 2016: R+2.5 2012: D+7.9 2008: D+12.1
Not yet ingested
- Civics
- —
Market trends
- HPI YoY
- ▼ -106.06%
- Current HPI
- 343.1376
- Rent YoY
- —
- Metro
- Port St. Lucie, FL
- State GDP YoY
- ▲ 3.28%
- F500 in state
- 36
Industry mix (Fortune 500 HQ in FL)
| Industry | F500 HQs | Revenue |
|---|---|---|
| Industrial Technology | 2 | $29B |
|
||
| Insurance | 2 | $17B |
|
||
| Retail | 1 | $60B |
|
||
| Technology Distribution | 1 | $58B |
|
||
| Homebuilding | 1 | $35B |
|
||
| Technology Manufacturing | 1 | $35B |
|
||
Price history
+29.6% since first listed18 events — show timeline
- 2026-05-21 Listed $209,900 Stellar MLS as Distributed by MLS Grid
- 2026-05-19 Listed $209,900 Beaches MLS
- 2026-03-16 Listing Removed — Beaches MLS
- 2025-09-15 Price Changed $210,000 Beaches MLS
- 2025-08-22 Price Changed $220,000 Beaches MLS
- 2025-08-01 Price Changed $225,000 Beaches MLS
- 2025-07-17 Listed $230,000 Beaches MLS
- 2022-03-04 Sold (Public Records) $166,000 Public Records
- 2022-03-02 Sold (MLS) $166,000 MCRTC
- 2022-03-02 Sold (MLS) $166,000 Beaches MLS
- 2022-01-18 Pending — Beaches MLS
- 2022-01-18 Pending — MCRTC
- 2022-01-10 Relisted — Beaches MLS
- 2022-01-10 Relisted — MCRTC
- 2022-01-03 Pending — MCRTC
- 2022-01-03 Pending — Beaches MLS
- 2021-12-28 Listed $162,000 MCRTC
- 2021-12-28 Listed $162,000 Beaches MLS
Property tax history
+10.5%/yrLatest (2025): $2,058 · +3.8% YoY. Source: county tax records.
Cash-flow waterfall
monthlySold comps — $/sqft
last 12 mo · ≤1 miLoading sold comps…