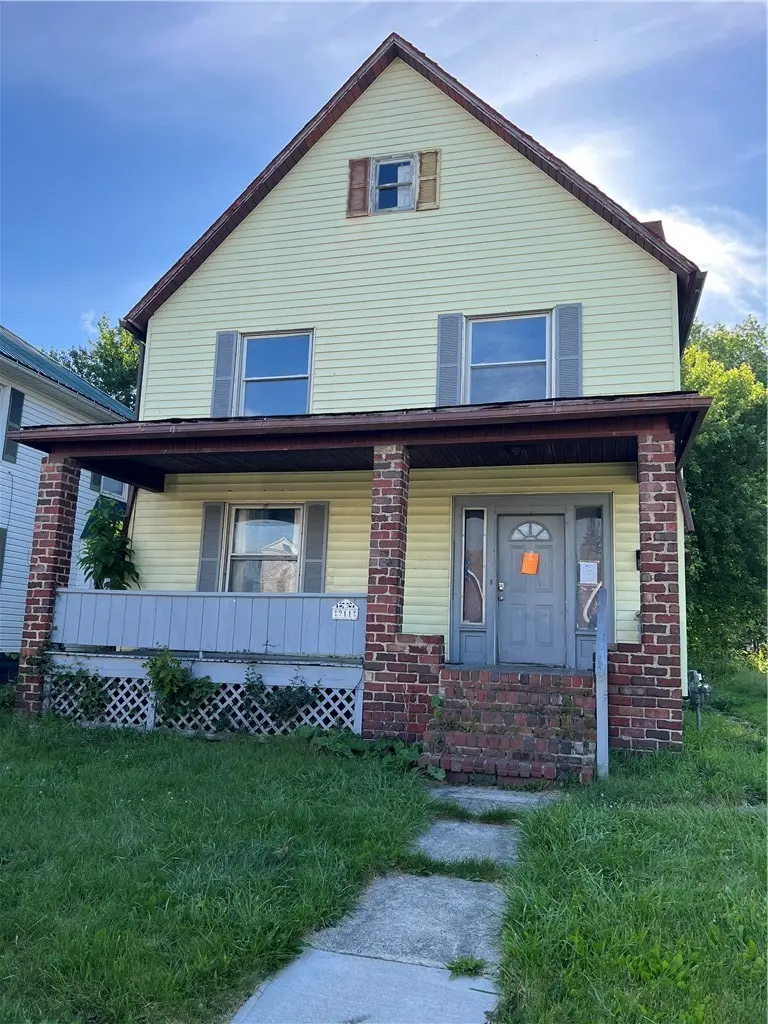
211 Cedar Ave · Sharon, PA
Flood risk 1/10 · Minimal
- FEMA flood zone
- X (unshaded)
- Chance of flooding over 30 yrs
- 0.0%
- Est. flood insurance / yr
- $507 – $1,088
Fire risk 1/10 · Minimal
- Est. fire insurance / yr
- $511 – $949
Heat risk 3/10 · Minor
- Hot days now (above 97°F)
- 7 days/yr
- Hot days in 30 yrs
- 17 days/yr
Wind risk 1/10 · Minimal
- Chance of severe wind over 30 yrs
- —
Air-quality risk 3/10 · Minor
- Unhealthy air days now
- 2 days/yr
- Unhealthy air days in 30 yrs
- 6 days/yr
Risk factors via First Street. Map © Google.
Why this score? — see what drove the B+ grade
The composite is a weighted blend of 9 inputs, each scored 0–100. Each bar is that input's sub-score; the figure is the points it added to the 100-point composite (weight × sub-score).
- Cash flow +30.0/30.0
- ARV discount +15.0/15.0
- 1% rule +10.0/10.0
- DSCR +10.0/10.0
- Livability +3.2/5.0
- Rent growth +2.5/5.0
- Schools +2.5/10.0
- Condition / age +2.5/5.0
- Appreciation +0.0/10.0
$59,900
🖨 Deal sheet (PDF) 📄 Offer letter ✓ Due diligence
Listing remarks
Large four+ bedroom with walk up third floor. Cozy kitchen with eat in area, dining room, large living room, large formal entry. Four bedrooms, full bath, and a walk up third floor. Large front porch.
Key facts
- Cozy kitchen
- Large formal entry
- Eat in area
Tags
Property features AI
Finance
- HOA & community: Public transportation nearby
Exterior
- Parking: Off-street parking for 2 vehicles
- Utilities: Public water; Public sewer
- Home design: Three-story frame home with vinyl siding; Asphalt roof; Resale property
- Construction: Frame construction with vinyl siding; Asphalt roof
- Exterior features: Lot approximately 40 x 110; Public transportation access nearby
Interior
- Kitchen: Main-level kitchen (8x12)
- Bedrooms: Three upper-level bedrooms (12x12, 12x12, 12x14) and an additional upper-level room/space (12x16); Bonus room on upper level (20x24)
- Flooring: Carpet; Vinyl
- Bathrooms: One full bathroom
- Heating & cooling: Forced air gas heating
- Interior features: Decorative fireplace (1); Carpet and vinyl flooring; Full walk-up basement
Neighborhood map
What this means for you Summary
Snapshot
- This is a 4-bed/1.0-bath single-family listed at $60k.
Deal economics
- At list price, monthly cash flow is $618 ($7k/yr) — positive.
- The deal already cash-flows at list — no discount required.
- Meets the 1% rule at list price ($1k rent vs $60k).
Location & tenants
- Location reads 65/100 on livability (#1,100 in PA) — a middle-class / working-renter tenant base. Strengths: cost of living A+, housing A+, health & safety A+; Watch: schools D+, crime F, amenities F.
- Sharon City SD (suburban): math 20% / reading 42% proficiency, ranked #446 of 539 in PA (top 83%) — families likely to look elsewhere, expect single-tenant / working-renter base with shorter leases; 67% free/reduced lunch — lower-income household profile, screen leases tightly.
- Market conditions: 74 active listings in the ZIP; 62 units permitted in Mercer County in 2024 (0 in 5+ unit buildings).
- This rent runs 34% of the median local income ($46k/yr) — at the standard rent-burdened threshold; future hikes will face affordability resistance.
Forward outlook
- Local home prices are declining (-3.0%/yr); year-one equity from $414 of loan paydown is wiped out by about $2k of value loss. Plan a longer hold.
- Mercer County population projected at -22% by 2050 — secular population decline; favor cash flow + early exit over multi-decade hold.
- At projected returns (-3.0% appreciation + 3.0% rent growth), your $17k cash investment doubles in ~3 years — after that, you're playing with house money.
Negotiation context
- Only 9 days on market — expect competitive offers; lowballing is unlikely to land.
Risks & watch-outs
- Watch-outs: built in 1900 — expect roof / HVAC / electrical / plumbing capex.
Questions for the listing agent
- Built in 1900 — when were the roof, HVAC, electrical panel, plumbing, and water heater last replaced?
- Is there a deadline driving the sale (1031 exchange, divorce, estate, relocation)? That informs how much negotiation room exists.
- Schools are D-rated, which usually means shorter tenancies and higher turnover. Who's the typical renter profile here, and what's been the actual vacancy rate?
- Crime grade is F in this area — have there been break-ins, vandalism, or insurance claims at this property in the last 3 years? What carrier currently insures it and at what premium?
- What's the average days-on-market for RENTAL listings here right now (not sales)? A rising rental-DOM trend means longer vacancies and softer asking-rent achievability than the comps imply.
- What's the recent tenant-quality profile in this submarket — average credit score on applications, eviction rate, late-payment / NSF rate, and stable-employment percentage? A property-management company in the area should have these aggregated.
- How much new for-sale + rental construction is in the pipeline within 1–3 miles? Heavy new supply typically softens prices + rents 12–24 months out; constrained supply supports both.
Investment metrics
- 1% rule
- 2.18% ✓
- Cap rate
- 18.68%
- Cash-on-cash
- 44.23%
- DSCR
- 2.97
- GRM
- 3.8
CMA / ARV
- ARV (on-the-fly)
- $82,000
- Comps found
- 4
Show comp detail 4 sales within ~0.75 mi
| Address | Dist | Beds/Ba | Sqft | Sold | Price | $/sf | Match |
|---|---|---|---|---|---|---|---|
| 140 Case Ave | 0.49mi | 3/1.5 (-1) | 1,568 (-4%) | 2mo | $155,000 | $99 | 61 |
| 639 Edgewood Rd | 0.08mi | 3/1.0 (-1) | 1,492 (-9%) | 21mo | $54,000 | $36 | 59 |
| 1055 Griswold St | 0.38mi | 3/2.0 (-1) | 1,556 (-5%) | 10mo | $70,000 | $45 | 57 |
| 590 Wengler Ave | 0.45mi | 3/1.5 (-1) | 1,400 (-15%) | 20mo | $69,900 | $50 | 31 |
Match score weights: distance 35% · size 25% · config 20% · recency 20%. Top-matched comps best support the ARV.
Projected returns pro-forma
-3.0% appreciation · 3.0% rent growth · sell at horizon
- IRR
- 41.2%
- Equity multiple
- 2.77×
- Total profit
- $29,683
- Equity at exit
- $8,931
- IRR
- 47.4%
- Equity multiple
- 5.57×
- Total profit
- $76,622
- Equity at exit
- $5,179
Cash invested: $16,772 (down + closing). Projections, not guarantees.
Landlord ↔ Tenant lean methodology
- Overall (STATE)
- 62 Landlord-Friendly
- State Pennsylvania
- 62 Landlord-Friendly · EVEN
- County
- — inherits STATE
- City
- — inherits STATE
ZIP-level market 16146
- Active inventory
- 74
- Price-to-rent
- 3.8×
Monthly cashflow live
- Estimated rent
- $1,306 medium interval (Pro) →
- Mortgage (P&I)
- −$314
- Tax from tax record
- −$75 /mo · $896/yr
- Insurance
- −$25
- HOA
- −$0
- Vacancy / Maint / Mgmt
- −$274
- Net cashflow
- $618
Break-even live
Sensitivity live
| Price | -10% $652 | -5% $635 | +0% $618 | +5% $601 | +10% $584 |
|---|---|---|---|---|---|
| Rent | -10% $515 | -5% $567 | +0% $618 | +5% $670 | +10% $721 |
| Rate | -1.0pp $648 | -0.5pp $633 | base $618 | +0.5pp $603 | +1.0pp $587 |
UW: 25.0% down · 7.5% · 30yr · 1.5% tax · 5.0% vac · 8.0% maint · 8.0% mgmt
Financing live
Cash to close
- Down payment
- $14,975
- Closing costs
- $1,797
- Reserves months
- —
- Total cash needed
- —
Loan-product check · same deal, 3 products live
Conventional
25% down · 7.5% · 30yr
- Down + closing
- —
- Monthly P&I
- —
- Monthly cashflow
- —
- DSCR
- —
- Eligible?
- —
Personal DTI + credit; lowest rate.
DSCR
20% down · 8.5% · 30yr
- Down + closing
- —
- Monthly P&I
- —
- Monthly cashflow
- —
- DSCR
- —
- Eligible?
- —
No personal income docs; deal must DSCR.
Hard money
10% down · 12.0% · 12mo
- Down + closing
- —
- Monthly P&I
- —
- Monthly cashflow
- —
- DSCR
- —
- Eligible?
- —
Short-term bridge; refi at stabilization.
Listing history 8 events
-
2026-06-19days on market $59,900 Active 9 DOM
-
2026-06-18days on market $59,900 Active 8 DOM
-
2026-06-17days on market $59,900 Active 7 DOM
-
2026-06-16days on market $59,900 Active 6 DOM
-
2026-06-15days on market $59,900 Active 5 DOM
-
2026-06-14days on market $59,900 Active 3 DOM
-
2026-06-13remarks 200-char remark
-
2026-06-13$59,900 Active 2 DOM
ⓘ Source: listings_history table (triggers on properties + properties_extension) + one-shot
backfill from property_details.listing_events for pre-trigger history.
Tax reassessment forecast PA · Partial reset (capped growth)
- Current annual tax
- $896 · $75/mo
- Projected year-2 tax
- $921 · $77/mo
- Expected delta
- +$25/yr (+$2/mo · 2.8%)
ⓘ Screening estimate from a state-policy table — verify with the county assessor before closing.
Climate risk First Street
- Flood 1/10 Low FEMA zone X (unshaded) · 0% chance over 30 yrs
- Wildfire 1/10 Low
- Heat 3/10 Moderate 7 d/yr ≥97°F today · 17 d/yr by 30 yrs out
- Wind 1/10 Low
- Air quality 3/10 Moderate 2 unhealthy d/yr today · 6 by 30 yrs out
Nearby sold comps map
Loading sold comps map…
Walkable amenities ~0.75 mi
Loading nearby amenities…
Taxation est. · year 1
- Rental income
- $15,675
- − Mortgage interest
- −$3,355
- − Property taxes
- −$896
- − Insurance
- −$300
- − Repairs & maintenance
- −$1,254
- − Management
- −$1,254
- − Depreciation
- −$1,743
- Taxable income
- $6,873
- Est. tax owed @ 24.0%
- −$1,650
- After-tax cash flow
- $5,768/yr
For passive investors: Depreciation is non-cash, so a rental often shows a tax loss while cash-flowing — sheltering income. Rental losses are passive: they offset passive income freely, and up to $25,000/yr can offset ordinary (W-2) income if you actively participate and your MAGI is under $100k (phasing out to $0 by $150k); unused losses carry forward. On sale, claimed depreciation is recaptured at up to 25%, and gains may owe capital-gains tax (a 1031 exchange can defer both). Figures are a year-1 estimate at your 24.0% rate — not tax advice; consult a CPA.
Schools (NCES district)
- District
- Sharon City SD
- NCES district ID
- 4221330
- Math proficiency
- 20% ▼ -10.00%
- Reading proficiency
- 42% ▼ -8.00%
- Median HH income
- $31,081
- Composite
- 25.14/100
- National rank
- #7521
- State rank
- #446 of 539 in PA
Livability — Sharon
- Score
- 65/100
- State rank
- #1100
- US rank
- #12460
Category grades
Schools grade is shown separately in the Schools card above.
Census & demographics
- Census place
- Sharon, PA
- County
- Mercer County · 28,053 people
- City population
- 12,936
- Metro
- Youngstown-Warren-Boardman, OH-PA
- Population (ZIP)
- 12,936
- Household income
- $45,670
- Rent vs Own
- Severe rent burden
- 685.0
Population outlook (Mercer County) Hauer SSP2
- Today (2025)
- 108,341 people
- By 2030
- 104,269 · -3.8%
- By 2040
- 94,624 · -12.7%
- By 2050
- 84,891 · -21.6%
- By 2075
- 65,094 · -39.9%
- By 2100
- 47,657 · -56.0%
Race, ethnicity, and origin ACS 2023
- Neighborhood character
- Predominantly White (76%)
- Race & ethnicity
- White 76% Black 16% Two or more races 7% Hispanic / Latino 3%
- Common ancestry
- Romanian 3% Slovak 2% Iranian 1%
- Foreign-born
- 4% · Canada
- Languages at home
- 97% English-only · Russian/Polish/Slavic 1% Spanish 1% Arabic 1%
Political lean MEDSL · Mercer
- 2024 margin
- Solid R (+30.2) · D 34.5% · R 64.7%
- 2008→2024 swing
- -29.9pp toward R · 2008: -0.3pp · 2024: -30.2pp
- All cycles
- 2024: R+30.2 2020: R+26.0 2016: R+25.0 2012: R+2.5 2008: R+0.3
Not yet ingested
- Civics
- —
Market trends
- HPI YoY
- ▼ -109.55%
- Current HPI
- 155.0912
- Rent YoY
- —
- Metro
- Youngstown-Warren-Boardman, OH-PA
- State GDP YoY
- ▲ 1.68%
- F500 in state
- 34
Industry mix (Fortune 500 HQ in PA)
| Industry | F500 HQs | Revenue |
|---|---|---|
| Healthcare | 2 | $309B |
|
||
| Insurance | 2 | $27B |
|
||
| Telecommunications / Media | 1 | $124B |
|
||
| Industrial Distribution | 1 | $22B |
|
||
| Financial Services | 1 | $20B |
|
||
| Chemicals / Materials | 1 | $18B |
|
||
Price history
+3.6% since first listed3 events — show timeline
- 2026-06-10 Listed $59,900 West Penn MLS
- 2024-08-22 Sold (Public Records) $90,000 Public Records
- 2024-05-30 Sold (Public Records) $57,794 Public Records
Property tax history
-4.5%/yrLatest (2026): $896 · +0.0% YoY. Source: county tax records.
Cash-flow waterfall
monthlySold comps — $/sqft
last 12 mo · ≤1 miLoading sold comps…