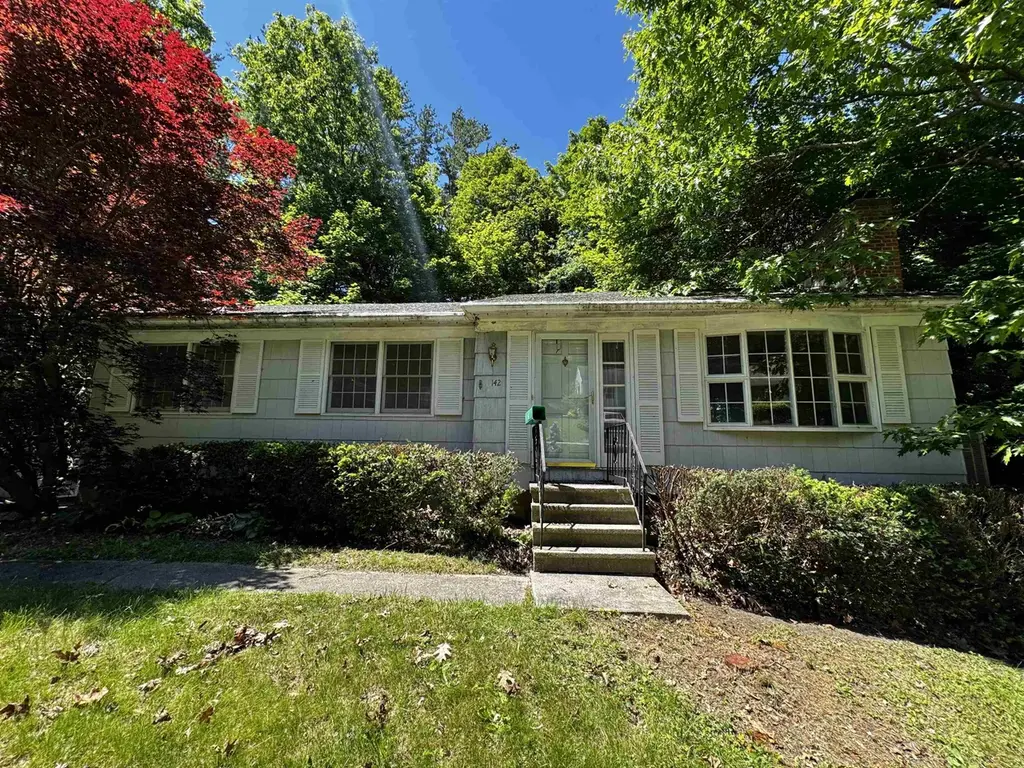
142 Pine Cir · Bennington, VT
Flood risk 1/10 · Minimal
- FEMA flood zone
- X (unshaded)
- Chance of flooding over 30 yrs
- 0.0%
- Est. flood insurance / yr
- $507 – $1,088
Fire risk 1/10 · Minimal
- Est. fire insurance / yr
- $480 – $892
Heat risk 2/10 · Minimal
- Hot days now (above 92°F)
- 7 days/yr
- Hot days in 30 yrs
- 16 days/yr
Wind risk 3/10 · Minor
- Chance of severe wind over 30 yrs
- 7.0%
Air-quality risk 2/10 · Minimal
- Unhealthy air days now
- 0 days/yr
- Unhealthy air days in 30 yrs
- 1 days/yr
Risk factors via First Street. Map © Google.
Why this score? — see what drove the C grade
The composite is a weighted blend of 9 inputs, each scored 0–100. Each bar is that input's sub-score; the figure is the points it added to the 100-point composite (weight × sub-score).
- Cash flow +17.4/30.0
- ARV discount +15.0/15.0
- DSCR +5.4/10.0
- Schools +5.0/10.0
- 1% rule +4.8/10.0
- Livability +3.2/5.0
- Rent growth +2.5/5.0
- Condition / age +2.5/5.0
- Appreciation +0.0/10.0
$225,000
🖨 Deal sheet (PDF) 📄 Offer letter ✓ Due diligence
Listing remarks
Opportunity is knocking. .. answer the door! This home in a sought-after neighborhood on an almost half acre lot is the investment you've been looking for. Close to downtown shopping and dining, as well as the award-winning Southwestern Vermont Medical Center. Features include an attached two car garage, wood floors, mini-split in living room, fireplace, wood floors, dining room, primary bedroom with ensuite 3/4 bathroom, deck, and more. All four bedrooms and two bathrooms are on one level. The walk-out basement was once partially finished and could be plenty of extra living space. Come bring this property back to life! Not eligible for most loan programs.
Key facts
- Almost half acre lot
- Fireplace
- 0.44 acre lot
Tags
Property features AI
Finance
- Other: Documents available: Deed, Other, Tax Map
- Financial info: Foreclosed / Bank-Owned / REO
Exterior
- Parking: 2-car garage
- Utilities: Public water; Public sewer; Circuit breaker electrical service; Fiber optic and high-speed internet available; Cable available; Telephone available
- Home design: Ranch-style home; Existing (built in 1970); Light blue exterior; Shingle roof
- Construction: Wood frame construction with wood siding; Built in 1970
- Exterior features: Sloping, wooded lot in town and in a neighborhood; Near shopping, public transportation, and hospital; Paved driveway; Public road frontage (approximately 100 feet)
Interior
- Kitchen: Dishwasher; Refrigerator
- Flooring: Carpet; Vinyl; Wood
- Bathrooms: 1 full bathroom; 1 three-quarter bathroom
- Heating & cooling: Oil heat; Baseboard heat; Mini split heating; Mini split cooling
- Interior features: 7 total rooms; Concrete basement with full daylight walkout, interior and exterior access, interior stairs, and storage space
Neighborhood map
What this means for you Summary
Snapshot
- This is a 4-bed/2.0-bath single-family listed at $225k.
Deal economics
- At list price, monthly cash flow is $170 ($2k/yr) — positive.
- The deal already cash-flows at list — no discount required.
- To meet the 1% rule (rent ≥ 1% of price), the offer needs to be $220k (2.1% below list).
- Recommended offer: $220k (2.1% below list) — sets the bar for 1% rule.
- Cap rate 7.2% vs local median 5.0% in Bennington — top-decile yield for the area; either an underpriced asset or a hidden risk that comps aren't pricing in. Stress-test before assuming the spread holds.
Location & tenants
- Location reads 64/100 on livability (#63 in VT) — a middle-class / working-renter tenant base. Strengths: housing A+, health & safety A+, cost of living A; Watch: employment C-, crime D, schools F.
- Market conditions: 66 active listings in the ZIP; 59 units permitted in Bennington County in 2024 (0 in 5+ unit buildings).
- This rent runs 44% of the median local income ($60k/yr) — at the standard rent-burdened threshold; future hikes will face affordability resistance.
Forward outlook
- Local home prices are declining (-3.0%/yr); year-one equity from $2k of loan paydown is wiped out by about $7k of value loss. Plan a longer hold.
- Bennington County population projected at -23% by 2050 — secular population decline; favor cash flow + early exit over multi-decade hold.
Negotiation context
- Only 12 days on market — expect competitive offers; lowballing is unlikely to land.
Questions for the listing agent
- Built in 1970 — when were the roof, HVAC, electrical panel, plumbing, and water heater last replaced?
- Is there a deadline driving the sale (1031 exchange, divorce, estate, relocation)? That informs how much negotiation room exists.
- Schools are F-rated, which usually means shorter tenancies and higher turnover. Who's the typical renter profile here, and what's been the actual vacancy rate?
- Crime grade is D in this area — have there been break-ins, vandalism, or insurance claims at this property in the last 3 years? What carrier currently insures it and at what premium?
- What's the average days-on-market for RENTAL listings here right now (not sales)? A rising rental-DOM trend means longer vacancies and softer asking-rent achievability than the comps imply.
- What's the recent tenant-quality profile in this submarket — average credit score on applications, eviction rate, late-payment / NSF rate, and stable-employment percentage? A property-management company in the area should have these aggregated.
- How much new for-sale + rental construction is in the pipeline within 1–3 miles? Heavy new supply typically softens prices + rents 12–24 months out; constrained supply supports both.
Investment metrics
- 1% rule
- 0.98% ✗
- Cap rate
- 7.20%
- Cash-on-cash
- 3.24%
- DSCR
- 1.14
- GRM
- 8.5
CMA / ARV
- ARV (on-the-fly)
- $399,726
- Comps found
- 7
Show comp detail 7 sales within ~0.75 mi
| Address | Dist | Beds/Ba | Sqft | Sold | Price | $/sf | Match |
|---|---|---|---|---|---|---|---|
| 197 Crescent Blvd | 0.11mi | 4/2.5 | 2,248 (-11%) | 12mo | $315,000 | $140 | 65 |
| 120 Imperial Ave | 0.42mi | 4/2.5 | 2,404 (-4%) | 9mo | $240,000 | $100 | 64 |
| 320 Crescent Blvd | 0.26mi | 3/1.5 (-1) | 2,391 (-5%) | 18mo | $385,000 | $161 | 57 |
| 153 Pine Cir | 0.03mi | 3/3.0 (-1) | 2,276 (-10%) | 24mo | $400,000 | $176 | 54 |
| 706 Jefferson Hts | 0.41mi | 5/4.0 (+1) | 2,244 (-11%) | 2mo | $525,000 | $234 | 48 |
| 106 Putnam St | 0.63mi | 4/3.0 | 2,308 (-8%) | 12mo | $322,000 | $140 | 43 |
| 308 Elm St | 0.73mi | 3/2.5 (-1) | 2,218 (-12%) | 2mo | $353,000 | $159 | 38 |
Match score weights: distance 35% · size 25% · config 20% · recency 20%. Top-matched comps best support the ARV.
Projected returns pro-forma
-3.0% appreciation · 3.0% rent growth · sell at horizon
- IRR
- -11.2%
- Equity multiple
- 0.59×
- Total profit
- $-25,572
- Equity at exit
- $33,548
- IRR
- -1.9%
- Equity multiple
- 0.87×
- Total profit
- $-8,130
- Equity at exit
- $19,454
Cash invested: $63,000 (down + closing). Projections, not guarantees.
Landlord ↔ Tenant lean methodology
- Overall (STATE)
- 41 Moderately Tenant-Leaning
- State Vermont
- 41 Moderately Tenant-Leaning · D+15
- County
- — inherits STATE
- City
- — inherits STATE
ZIP-level market 05201
- Home prices YoY
- -19.3%
- Active inventory
- 66
- Price-to-rent
- 8.5×
Monthly cashflow live
- Estimated rent
- $2,204 medium interval (Pro) →
- Mortgage (P&I)
- −$1,180
- Tax from tax record
- −$297 /mo · $3,565/yr
- Insurance
- −$94
- HOA
- −$0
- Vacancy / Maint / Mgmt
- −$463
- Net cashflow
- $170
Break-even live
Sensitivity live
| Price | -10% $298 | -5% $234 | +0% $170 | +5% $107 | +10% $43 |
|---|---|---|---|---|---|
| Rent | -10% $-4 | -5% $83 | +0% $170 | +5% $257 | +10% $344 |
| Rate | -1.0pp $284 | -0.5pp $227 | base $170 | +0.5pp $112 | +1.0pp $53 |
UW: 25.0% down · 7.5% · 30yr · 1.5% tax · 5.0% vac · 8.0% maint · 8.0% mgmt
Financing live
Cash to close
- Down payment
- $56,250
- Closing costs
- $6,750
- Reserves months
- —
- Total cash needed
- —
Loan-product check · same deal, 3 products live
Conventional
25% down · 7.5% · 30yr
- Down + closing
- —
- Monthly P&I
- —
- Monthly cashflow
- —
- DSCR
- —
- Eligible?
- —
Personal DTI + credit; lowest rate.
DSCR
20% down · 8.5% · 30yr
- Down + closing
- —
- Monthly P&I
- —
- Monthly cashflow
- —
- DSCR
- —
- Eligible?
- —
No personal income docs; deal must DSCR.
Hard money
10% down · 12.0% · 12mo
- Down + closing
- —
- Monthly P&I
- —
- Monthly cashflow
- —
- DSCR
- —
- Eligible?
- —
Short-term bridge; refi at stabilization.
Listing history 10 events
-
2026-06-21days on market $225,000 Active 12 DOM
-
2026-06-19days on market $225,000 Active 10 DOM
-
2026-06-18days on market $225,000 Active 9 DOM
-
2026-06-17days on market $225,000 Active 8 DOM
-
2026-06-16days on market $225,000 Active 7 DOM
-
2026-06-15days on market $225,000 Active 6 DOM
-
2026-06-14days on market $225,000 Active 4 DOM
-
2026-06-12days on market $225,000 Active 3 DOM
-
2026-06-09remarks 664-char remark
-
2026-06-09$225,000 Active 1 DOM
ⓘ Source: listings_history table (triggers on properties + properties_extension) + one-shot
backfill from property_details.listing_events for pre-trigger history.
Tax reassessment forecast VT · Partial reset (capped growth)
- Current annual tax
- $3,565 · $297/mo
- Projected year-2 tax
- $3,920 · $327/mo
- Expected delta
- +$355/yr (+$30/mo · 10.0%)
ⓘ Screening estimate from a state-policy table — verify with the county assessor before closing.
Climate risk First Street
- Flood 1/10 Low FEMA zone X (unshaded) · 0% chance over 30 yrs
- Wildfire 1/10 Low
- Heat 2/10 Low 7 d/yr ≥92°F today · 16 d/yr by 30 yrs out
- Wind 3/10 Moderate 7% chance of damaging wind over 30 yrs
- Air quality 2/10 Low 0 unhealthy d/yr today · 1 by 30 yrs out
Nearby sold comps map
Loading sold comps map…
Walkable amenities ~0.75 mi
Loading nearby amenities…
Taxation est. · year 1
- Rental income
- $26,446
- − Mortgage interest
- −$12,603
- − Property taxes
- −$3,565
- − Insurance
- −$1,125
- − Repairs & maintenance
- −$2,116
- − Management
- −$2,116
- − Depreciation
- −$6,545
- Taxable loss
- −$1,624
- Est. tax savings @ 24.0%
- +$390
- After-tax cash flow
- $2,433/yr
For passive investors: Depreciation is non-cash, so a rental often shows a tax loss while cash-flowing — sheltering income. Rental losses are passive: they offset passive income freely, and up to $25,000/yr can offset ordinary (W-2) income if you actively participate and your MAGI is under $100k (phasing out to $0 by $150k); unused losses carry forward. On sale, claimed depreciation is recaptured at up to 25%, and gains may owe capital-gains tax (a 1031 exchange can defer both). Figures are a year-1 estimate at your 24.0% rate — not tax advice; consult a CPA.
Schools (NCES district)
No district data.
Livability — Bennington
- Score
- 64/100
- State rank
- #63
- US rank
- #14446
Category grades
Schools grade is shown separately in the Schools card above.
Census & demographics
- Census place
- Bennington, VT
- County
- Bennington County · 14,998 people
- City population
- 14,998
- Metro
- Bennington, VT
- Population (ZIP)
- 14,998
- Household income
- $59,798
- Rent vs Own
- Severe rent burden
- 982.0
Population outlook (Bennington County) Hauer SSP2
- Today (2025)
- 34,407 people
- By 2030
- 32,975 · -4.2%
- By 2040
- 29,711 · -13.6%
- By 2050
- 26,638 · -22.6%
- By 2075
- 21,318 · -38.0%
- By 2100
- 16,086 · -53.2%
Race, ethnicity, and origin ACS 2023
- Neighborhood character
- Predominantly White (92%)
- Race & ethnicity
- White 92% Two or more races 4% Hispanic / Latino 3%
- Common ancestry
- Lithuanian 10% Slovak 7% Romanian 3%
- Foreign-born
- 2% · Canada
- Languages at home
- 96% English-only · Spanish 2% Other Indo-European 1%
Political lean MEDSL · Bennington
- 2024 margin
- Strong D (+22.5) · D 60.0% · R 37.5% · Other 2.6%
- 2008→2024 swing
- -10.9pp toward R · 2008: 33.4pp · 2024: 22.5pp
- All cycles
- 2024: D+22.5 2020: D+27.3 2016: D+22.1 2012: D+33.3 2008: D+33.4
Not yet ingested
- Civics
- —
Market trends
- HPI YoY
- ▼ -60.78%
- Current HPI
- 254.5149
- Rent YoY
- —
- Metro
- Bennington, VT
- State GDP YoY
- —
- F500 in state
- 0
Price history
1 event — show timeline
- 2026-06-09 Listed $225,000 PrimeMLS
Property tax history
+8.1%/yrLatest (2024): $3,565 · +38.5% YoY. Source: county tax records.
Cash-flow waterfall
monthlySold comps — $/sqft
last 12 mo · ≤1 miLoading sold comps…