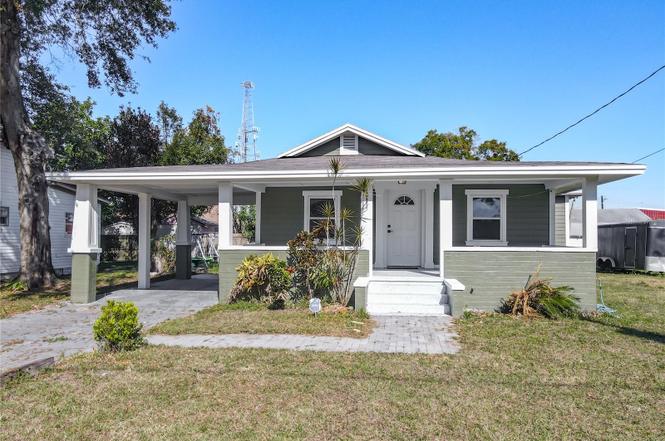
1223 Sycamore St · Lakeland, FL
Flood risk 1/10 · Minimal
- FEMA flood zone
- X (unshaded)
- Chance of flooding over 30 yrs
- 0.0%
- Est. flood insurance / yr
- $507 – $1,088
Fire risk 2/10 · Minimal
- Est. fire insurance / yr
- $947 – $1,759
Heat risk 8/10 · Major
- Hot days now (above 108°F)
- 7 days/yr
- Hot days in 30 yrs
- 23 days/yr
Wind risk 9/10 · Severe
- Chance of severe wind over 30 yrs
- 99.0%
Air-quality risk 2/10 · Minimal
- Unhealthy air days now
- 1 days/yr
- Unhealthy air days in 30 yrs
- 2 days/yr
Risk factors via First Street. Map © Google.
Why this score? — see what drove the D grade
The composite is a weighted blend of 9 inputs, each scored 0–100. Each bar is that input's sub-score; the figure is the points it added to the 100-point composite (weight × sub-score).
- Appreciation +10.0/10.0
- Cash flow +8.5/30.0
- ARV discount +7.5/15.0
- Rent growth +4.0/5.0
- Livability +3.9/5.0
- Schools +3.5/10.0
- Condition / age +2.5/5.0
- 1% rule +2.3/10.0
- DSCR +2.3/10.0
$210,000
🖨 Deal sheet (PDF) 📄 Offer letter ✓ Due diligence
Listing remarks MLS
HOME SOLD AS IS. NEEDS EXTENSIVE WORK MUST HAVE PROOF OF FUNDS LETTER WITH OFFER
Key facts
- Updated electrical
- Inside laundry area
- Central air and heat
Tags
Property features AI
Finance
- Other: Unfurnished; No home warranty; No lease restrictions indicated
- HOA & community: No association fees
Exterior
- Parking: Has a 1-car carport; No driveway/garage listed
- Utilities: Public water; Public sewer; Cable available
- Home design: Single-family residence; One story; Faces west; Residential property
- Construction: Frame construction; Shingle roof; Crawlspace foundation; Built area and living area per public records
- Exterior features: Deck; Patio; Porch; Screened porch; Private mailbox; Located within city limits; Asphalt/paved road access
Interior
- Kitchen: No appliances included
- Bedrooms: 4 bedrooms
- Flooring: Laminate flooring
- Bathrooms: 1 full bathroom
- Heating & cooling: Central heating; Central air
- Interior features: Eat-in kitchen; Thermostat; Inside utility room
- Laundry & utility: Laundry inside
Neighborhood map
What this means for you Summary
Snapshot
- This is a 2-bed/1.0-bath single-family listed at $210k.
Deal economics
- At list price, monthly cash flow is $-183 ($-2k/yr) — negative.
- To cash-flow at today's rent, offer at most $178k (15.4% below list).
- To meet the 1% rule (rent ≥ 1% of price), the offer needs to be $153k (27.0% below list).
- Recommended offer: $153k (27.0% below list) — sets the bar for 1% rule.
Location & tenants
- Location reads 77/100 on livability (#206 in FL, #3,179 nationally) — a middle-class / working-renter tenant base. Strengths: cost of living A+, housing A+, health & safety A+; Watch: employment D+, amenities F, commute F.
- Polk (suburban): math 39% / reading 43% proficiency, ranked #62 of 73 in FL (top 85%) — families likely to look elsewhere, expect single-tenant / working-renter base with shorter leases.
- Zoned schools: Scott Lake Elementary School (math 67% / reading 56%, grade B, #634 of 2,144 statewide, top 30%, 727 students, 36% FRL); Southwest Middle School (math 25% / reading 32%, grade F, #482 of 571 statewide, top 85%, 801 students, 63% FRL); Kathleen Senior High School (math 19% / reading 31%, grade F, #501 of 667 statewide, top 75%, 2,051 students, 59% FRL).
- Market conditions: Rents rising fast (+6.1%/yr); 74 active listings in the ZIP; 35 comparable units currently listed for rent nearby; rentals at typical pace (median 16d on market — plan ~3-4 weeks tenant-placement turnaround); lower-income renter base — watch delinquency; 10,384 units permitted in Polk County in 2024 (1,716 in 5+ unit buildings).
- At $1,534/mo this rent would consume 49% of the median local household income ($37k/yr) (locally 700% of renters already pay >50% of income on rent) — very limited rent-growth headroom before tenants either downsize or default.
Forward outlook
- In year one you build about $22k of equity ($1k loan paydown + $21k appreciation (10.0% local appreciation)).
- Polk County population projected at +33% by 2050 — long-run rental-demand tailwind backs the buy-and-hold thesis.
- By year 2, paydown + projected appreciation supports a ~$36k cash-out refi (75% LTV) — recoverable capital for the next deal without selling this one.
Negotiation context
- It's been on market 107 days — a 9% lower offer ($191k) is reasonable based on typical stale-listing flexibility.
- 3 sale attempts since 14y ago; this cycle's ask has dropped $55k (21%) from the opening price — seller is motivated, your offer sets the floor, not the list.
- Current owner paid $7k; list at $210k implies a 2797% gain — meaningful room to come down on a strong offer.
Risks & watch-outs
- Watch-outs: built in 1922 — expect roof / HVAC / electrical / plumbing capex.
- Climate carrying-cost: severe wind risk, 99% chance of damaging wind over 30y; extreme-heat days projected 7→23/yr by 2055 (HVAC capex compounding) — expect insurance premiums to compound above CPI over the hold.
Questions for the listing agent
- What do current leases actually rent for vs. the listed asking? Can we see a recent rent roll and the last 12 months of T-12 income?
- It's been on market 107 days. Have you received any prior offers? Is the seller open to a 27% concession, seller financing, or rate buy-down credit?
- Built in 1922 — when were the roof, HVAC, electrical panel, plumbing, and water heater last replaced?
- Why hasn't it sold? Are there any deal-killer items the seller is aware of (foundation, flood, title, zoning, code violations)?
- Is there a deadline driving the sale (1031 exchange, divorce, estate, relocation)? That informs how much negotiation room exists.
- The area grade is low — what's the realistic commute time and amenity access for the typical tenant pool here? Any planned neighborhood developments (good or bad) we should know about?
- What's the average days-on-market for RENTAL listings here right now (not sales)? A rising rental-DOM trend means longer vacancies and softer asking-rent achievability than the comps imply.
- What's the recent tenant-quality profile in this submarket — average credit score on applications, eviction rate, late-payment / NSF rate, and stable-employment percentage? A property-management company in the area should have these aggregated.
- How much new for-sale + rental construction is in the pipeline within 1–3 miles? Heavy new supply typically softens prices + rents 12–24 months out; constrained supply supports both.
Investment metrics
- 1% rule
- 0.73% ✗
- Cap rate
- 5.25%
- Cash-on-cash
- -3.74%
- DSCR
- 0.83
- GRM
- 11.4
CMA / ARV
No comps found within radius.
Projected returns pro-forma
10.0% appreciation · 6.14% rent growth · sell at horizon
- IRR
- 22.5%
- Equity multiple
- 2.83×
- Total profit
- $107,698
- Equity at exit
- $189,185
- IRR
- 20.9%
- Equity multiple
- 6.75×
- Total profit
- $337,813
- Equity at exit
- $407,984
Cash invested: $58,800 (down + closing). Projections, not guarantees.
Landlord ↔ Tenant lean methodology
- Overall (STATE)
- 87 Strongly Landlord-Friendly
- State Florida
- 87 Strongly Landlord-Friendly · R+3
- County
- — inherits STATE
- City
- — inherits STATE
ZIP-level market 33815
- Home prices YoY
- 12.6%
- Rents YoY
- 6.1%
- Active inventory
- 74
- Price-to-rent
- 11.4×
Monthly cashflow live
- Estimated rent
- $1,534 high interval (Pro) →
- Mortgage (P&I)
- −$1,101
- Tax from tax record
- −$206 /mo · $2,473/yr
- Insurance
- −$88
- HOA
- −$0
- Vacancy / Maint / Mgmt
- −$322
- Net cashflow
- $-183
Break-even live
Sensitivity live
| Price | -10% $-64 | -5% $-124 | +0% $-183 | +5% $-243 | +10% $-302 |
|---|---|---|---|---|---|
| Rent | -10% $-304 | -5% $-244 | +0% $-183 | +5% $-122 | +10% $-62 |
| Rate | -1.0pp $-77 | -0.5pp $-130 | base $-183 | +0.5pp $-237 | +1.0pp $-293 |
UW: 25.0% down · 7.5% · 30yr · 1.5% tax · 5.0% vac · 8.0% maint · 8.0% mgmt
Financing live
Cash to close
- Down payment
- $52,500
- Closing costs
- $6,300
- Reserves months
- —
- Total cash needed
- —
Loan-product check · same deal, 3 products live
Conventional
25% down · 7.5% · 30yr
- Down + closing
- —
- Monthly P&I
- —
- Monthly cashflow
- —
- DSCR
- —
- Eligible?
- —
Personal DTI + credit; lowest rate.
DSCR
20% down · 8.5% · 30yr
- Down + closing
- —
- Monthly P&I
- —
- Monthly cashflow
- —
- DSCR
- —
- Eligible?
- —
No personal income docs; deal must DSCR.
Hard money
10% down · 12.0% · 12mo
- Down + closing
- —
- Monthly P&I
- —
- Monthly cashflow
- —
- DSCR
- —
- Eligible?
- —
Short-term bridge; refi at stabilization.
Rent comps 35 comps
| Address | Beds | Baths | Sqft | Rent | $/sqft | DOM | Units | Dist |
|---|---|---|---|---|---|---|---|---|
| 1149 Sycamore St Unit 1149 Lakeland, FL | 2.0 | 2.0 | 970 | $1,700 | $1.75 | 25d | 1 | 0.10mi |
| 1335 W Walnut St Lakeland, FL | 3.0 | 2.0 | 1626 | $1,800 | $1.11 | 5d | 1 | 0.13mi |
| 1139 Olive St Lakeland, FL | 2.0 | 2.0 | 984 | $1,725 | $1.75 | 5d | 1 | 0.13mi |
| 510 Dade Ave Lakeland, FL | 2.0 | 1.0 | 936 | $1,149 | $1.23 | 16d | 1 | 0.14mi |
| 512 Dade Ave Lakeland, FL | 2.0 | 1.0 | 936 | $1,149 | $1.23 | 25d | 1 | 0.15mi |
| 518 Pinewood Ave Lakeland, FL | 2.0 | 1.0 | 891 | $1,175 | $1.32 | 25d | 1 | 0.15mi |
| 1238 Herschell St Lakeland, FL | 2.0 | 1.0 | 1323 | $1,300 | $0.98 | 25d | 1 | 0.21mi |
| 515 Oregon Ave Lakeland, FL | 3.0 | 2.0 | 1024 | $1,500 | $1.46 | 5d | 1 | 0.31mi |
| 1040 Ruby St Lakeland, FL | 3.0 | 2.0 | 1110 | $1,595 | $1.44 | 12d | 1 | 0.36mi |
| 1618 Wayman St Lakeland, FL | 3.0 | 1.0 | 994 | $1,750 | $1.76 | 25d | 1 | 0.38mi |
| 1246 Dorothy St Lakeland, FL | 3.0 | 2.0 | 1484 | $2,300 | $1.55 | 25d | 1 | 0.46mi |
| 1206 W Highland St Lakeland, FL | 2.0 | 1.0 | 972 | $1,495 | $1.54 | 25d | 1 | 0.59mi |
| 815 N Davis Ave Lakeland, FL | 3.0 | 2.0 | 960 | $1,450 | $1.51 | 25d | 1 | 0.91mi |
| 101 Lake Hunter Dr #8 Lakeland, FL | 2.0 | 1.0 | 905 | $1,400 | $1.55 | 25d | 1 | 0.92mi |
| 806 N Swindell Ave Lakeland, FL | 3.0 | 2.0 | 995 | $1,450 | $1.46 | 25d | 1 | 0.96mi |
| 809 Adams St Lakeland, FL | 3.0 | 1.0 | 1164 | $1,525 | $1.31 | 16d | 1 | 1.02mi |
| 1005 S New York Ave Unit 9 Lakeland, FL | 1.0 | 1.0 | 900 | $1,150 | $1.28 | 16d | 1 | 1.13mi |
| 1005 S New York Ave Unit 6 Lakeland, FL | 2.0 | 1.0 | 900 | $1,275 | $1.42 | 16d | 1 | 1.13mi |
| 2117 Ivey Ln Lakeland, FL | 3.0 | 1.0 | 1160 | $1,980 | $1.71 | 25d | 1 | 1.17mi |
| 1105 Jewel Ave Lakeland, FL | 2.0 | 1.0 | 987 | $1,200 | $1.22 | 25d | 1 | 1.21mi |
| 850 Martin L King Jr Ave Lakeland, FL | 3.0 | 1.0 | 1222 | $1,495 | $1.22 | 25d | 1 | 1.22mi |
| 1545 King Ave Lakeland, FL | 2.0 | 2.0 | 1020 | $1,450 | $1.42 | 5d | 1 | 1.22mi |
| 2259 Chestnut Woods Dr Lakeland, FL | 2.0 | 1.0 | 1001 | $1,400 | $1.40 | 16d | 1 | 1.24mi |
| 302 W Park St Lakeland, FL | 3.0 | 2.0 | 1100 | $2,200 | $2.00 | 16d | 1 | 1.25mi |
| 1128 Neville Ave Lakeland, FL | 3.0 | 2.0 | 1245 | $1,900 | $1.53 | 16d | 1 | 1.25mi |
| 125 N Kentucky Ave #307 Lakeland, FL | 1.0 | 1.5 | 911 | $3,550 | $3.90 | 25d | 1 | 1.27mi |
| 270 E Bay St Lakeland, FL | 2.0 | 1.0–2.0 | 892 | $1,725 | $1.93 | 5d | 6 | 1.29mi |
| 2463 Chestnut Woods Dr Lakeland, FL | 2.0 | 1.0 | 910 | $1,500 | $1.65 | 25d | 1 | 1.29mi |
| 1137 Edith Ave Lakeland, FL | 3.0 | 1.0 | 1100 | $1,800 | $1.64 | 5d | 1 | 1.36mi |
| 1061 S Tennessee Ave Lakeland, FL | 2.0 | 2.5 | 1100 | $2,100 | $1.91 | 16d | 1 | 1.40mi |
| 2559 Chestnut Woods Dr Lakeland, FL | 2.0 | 1.0 | 1001 | $1,500 | $1.50 | 16d | 1 | 1.40mi |
| 1031 N Florence Ave Unit NA Lakeland, FL | 3.0 | 2.0 | 1100 | $1,495 | $1.36 | 16d | 1 | 1.42mi |
| 1514 Alice Ave Lakeland, FL | 3.0 | 2.0 | 924 | $1,250 | $1.35 | 16d | 1 | 1.44mi |
| 600 E Bay St Lakeland, FL | 3.0 | 1.0–2.0 | 914 | $2,166 | $2.37 | 5d | 29 | 1.48mi |
| 519 Charles St Unit 1 Lakeland, FL | 2.0 | 1.5 | 1000 | $1,795 | $1.79 | 25d | 1 | 1.49mi |
Listing history 12 events
-
2026-05-31status $210,000 Pending 107 DOM
-
2026-05-21status Active
-
2026-05-12status Pending
-
2026-05-08price $210,000
-
2026-04-10price $219,000
-
2026-03-21price $229,000
-
2026-02-27price $249,000
-
2026-02-03price $259,000
-
2026-02-03$265,000 Active
-
2012-04-13soldstatus $7,250 81-char remark
Show marketing remark (81 chars)
HOME SOLD AS IS. NEEDS EXTENSIVE WORK MUST HAVE PROOF OF FUNDS LETTER WITH OFFER
-
2012-03-02$7,500 81-char remark
Show marketing remark (81 chars)
HOME SOLD AS IS. NEEDS EXTENSIVE WORK MUST HAVE PROOF OF FUNDS LETTER WITH OFFER
-
1994-05-01soldstatus $11,513
ⓘ Source: listings_history table (triggers on properties + properties_extension) + one-shot
backfill from property_details.listing_events for pre-trigger history.
Tax reassessment forecast FL · Resets to sale price
- Current annual tax
- $2,473 · $206/mo
- Projected year-2 tax
- $2,473 · $206/mo
- Expected delta
- $0/yr ($0/mo · 0.0%)
ⓘ Screening estimate from a state-policy table — verify with the county assessor before closing.
Climate risk First Street
- Flood 1/10 Low FEMA zone X (unshaded) · 0% chance over 30 yrs
- Wildfire 2/10 Low
- Heat 8/10 Severe 7 d/yr ≥108°F today · 23 d/yr by 30 yrs out
- Wind 9/10 Extreme 99% chance of damaging wind over 30 yrs
- Air quality 2/10 Low 1 unhealthy d/yr today · 2 by 30 yrs out
Nearby sold comps map
Loading sold comps map…
Walkable amenities ~0.75 mi
Loading nearby amenities…
Taxation est. · year 1
- Rental income
- $18,407
- − Mortgage interest
- −$11,763
- − Property taxes
- −$2,473
- − Insurance
- −$1,050
- − Repairs & maintenance
- −$1,473
- − Management
- −$1,473
- − Depreciation
- −$6,109
- Taxable loss
- −$5,934
- Est. tax savings @ 24.0%
- +$1,424
- After-tax cash flow
- $-773/yr
For passive investors: Depreciation is non-cash, so a rental often shows a tax loss while cash-flowing — sheltering income. Rental losses are passive: they offset passive income freely, and up to $25,000/yr can offset ordinary (W-2) income if you actively participate and your MAGI is under $100k (phasing out to $0 by $150k); unused losses carry forward. On sale, claimed depreciation is recaptured at up to 25%, and gains may owe capital-gains tax (a 1031 exchange can defer both). Figures are a year-1 estimate at your 24.0% rate — not tax advice; consult a CPA.
Schools (NCES district)
- District
- Polk
- NCES district ID
- 1201590
- Math proficiency
- 39% ▼ -11.00%
- Reading proficiency
- 43% ▼ -4.00%
- Median HH income
- $43,979
- Composite
- 34.74/100
- National rank
- #5132
- State rank
- #62 of 73 in FL
Livability — Lakeland
- Score
- 77/100
- State rank
- #206
- US rank
- #3179
Category grades
Schools grade is shown separately in the Schools card above.
Census & demographics
- Census place
- Lakeland, FL
- County
- Polk County · 740,051 people
- City population
- 277,690
- Metro
- Lakeland-Winter Haven, FL
- Population (ZIP)
- 13,975
- Household income
- $37,487
- Rent vs Own
- Severe rent burden
- 700.0
Population outlook (Polk County) Hauer SSP2
- Today (2025)
- 752,975 people
- By 2030
- 804,621 · +6.9%
- By 2040
- 906,117 · +20.3%
- By 2050
- 1,000,476 · +32.9%
- By 2075
- 1,197,520 · +59.0%
- By 2100
- 1,271,518 · +68.9%
Race, ethnicity, and origin ACS 2023
- Neighborhood character
- Diverse neighborhood (Simpson 0.67)
- Race & ethnicity
- White 43% Black 27% Hispanic / Latino 26% Two or more races 10% Asian 1%
- Hispanic origin (detail)
- Mexican 12% Puerto Rican 10%
- Common ancestry
- Romanian 1% German 1% Lithuanian 1%
- Foreign-born
- 11% · Canada, Jamaica, China
- Languages at home
- 75% English-only · Spanish 23% German/W. Germanic 1%
Political lean MEDSL · Polk
- 2024 margin
- Strong R (+20.7) · D 39.2% · R 59.9%
- 2008→2024 swing
- -14.6pp toward R · 2008: -6.1pp · 2024: -20.7pp
- All cycles
- 2024: R+20.7 2020: R+14.4 2016: R+14.1 2012: R+6.8 2008: R+6.1
Not yet ingested
- Civics
- —
Market trends
- HPI YoY
- ▲ 47.45%
- Current HPI
- 424.0956
- Rent YoY
- ▲ 6.14%
- Metro
- Lakeland-Winter Haven, FL
- State GDP YoY
- ▲ 3.28%
- F500 in state
- 36
Industry mix (Fortune 500 HQ in FL)
| Industry | F500 HQs | Revenue |
|---|---|---|
| Industrial Technology | 2 | $29B |
|
||
| Insurance | 2 | $17B |
|
||
| Retail | 1 | $60B |
|
||
| Technology Distribution | 1 | $58B |
|
||
| Homebuilding | 1 | $35B |
|
||
| Technology Manufacturing | 1 | $35B |
|
||
Price history
+1724.0% since first listed11 events — show timeline
- 2026-05-21 Relisted — Stellar MLS as Distributed by MLS Grid
- 2026-05-12 Pending — Stellar MLS as Distributed by MLS Grid
- 2026-05-08 Price Changed $210,000 Stellar MLS as Distributed by MLS Grid
- 2026-04-10 Price Changed $219,000 Stellar MLS as Distributed by MLS Grid
- 2026-03-21 Price Changed $229,000 Stellar MLS as Distributed by MLS Grid
- 2026-02-27 Price Changed $249,000 Stellar MLS as Distributed by MLS Grid
- 2026-02-03 Price Changed $259,000 Stellar MLS as Distributed by MLS Grid
- 2026-02-03 Listed $265,000 Stellar MLS as Distributed by MLS Grid
- 2012-04-13 Sold (MLS) $7,250 Stellar MLS as Distributed by MLS Grid
- 2012-03-02 Listed $7,500 Stellar MLS as Distributed by MLS Grid
- 1994-05-01 Sold (Public Records) $11,513 Public Records
Property tax history
+12.0%/yrLatest (2025): $2,473 · -3.4% YoY. Source: county tax records.
Cash-flow waterfall
monthlySold comps — $/sqft
last 12 mo · ≤1 miLoading sold comps…