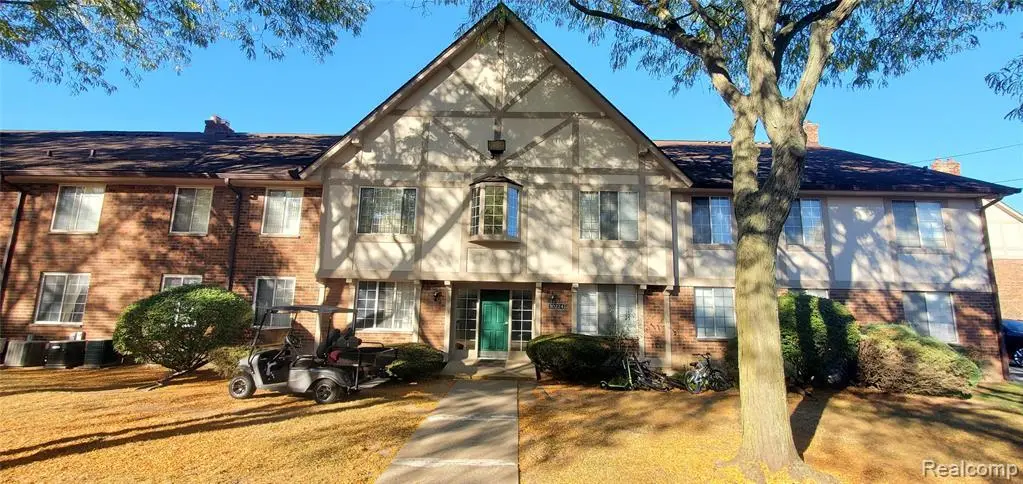
30224 Southfield Rd · Southfield, MI
Flood risk 1/10 · Minimal
- FEMA flood zone
- X (unshaded)
- Chance of flooding over 30 yrs
- 0.0%
- Est. flood insurance / yr
- $473 – $860
Fire risk 1/10 · Minimal
- Est. fire insurance / yr
- $784 – $1,456
Heat risk 3/10 · Minor
- Hot days now (above 97°F)
- 7 days/yr
- Hot days in 30 yrs
- 15 days/yr
Wind risk 2/10 · Minimal
- Chance of severe wind over 30 yrs
- —
Air-quality risk 4/10 · Minor
- Unhealthy air days now
- 3 days/yr
- Unhealthy air days in 30 yrs
- 6 days/yr
Risk factors via First Street. Map © Google.
Why this score? — see what drove the C+ grade
The composite is a weighted blend of 9 inputs, each scored 0–100. Each bar is that input's sub-score; the figure is the points it added to the 100-point composite (weight × sub-score).
- Cash flow +22.1/30.0
- ARV discount +11.6/15.0
- 1% rule +9.5/10.0
- DSCR +7.1/10.0
- Rent growth +3.7/5.0
- Livability +3.6/5.0
- Condition / age +2.5/5.0
- Schools +2.4/10.0
- Appreciation +0.0/10.0
$109,900
🖨 Deal sheet (PDF) 📄 Offer letter ✓ Due diligence
Listing remarks MLS
Welcome to this charming first-level condo featuring 2 spacious bedrooms and 2 bathrooms. Recently updated with fresh paint, new bedroom flooring, stylish new bathroom vanities, updated light fixtures, and many more improvements, this Condo is move-in ready while still offering room for your personal touch. Located just moments away from shopping, dining, and essential amenities, this condo combines comfort and convenience. Enjoy easy access to local shops, restaurants, and entertainment options, making it a perfect choice for those seeking a vibrant lifestyle. Don't miss this opportunity to own a beautifully refreshed condo with great potential. Schedule your showing today! All measurements are approximate. Buyer to verify all information.
Key facts
- $302 HOA
- Built 1966
- Listed 37 days
Property features AI
Finance
- Other: Listed in the Balmoral Club Condo subdivision
- HOA & community: Homeowners association with a $302 monthly fee
Exterior
- Parking: No garage; Assigned parking
- Utilities: Public water; Public sewer
- Home design: Condominium; Residential property; Two levels; Ground-level entry
- Construction: Built with other construction materials; Block foundation
- Exterior features: Paved road access; No pets allowed
Interior
- Bathrooms: Two full bathrooms
- Heating & cooling: Forced air heating (natural gas); No central cooling
- Interior features: Interior entry basement; Unfinished basement; Five total rooms
Neighborhood map
What this means for you Summary
Snapshot
- This is a 2-bed/2.0-bath condo listed at $110k.
Deal economics
- At list price, monthly cash flow is $177 ($2k/yr) — positive.
- The deal already cash-flows at list — no discount required.
- Meets the 1% rule at list price ($2k rent vs $110k).
- Recommended offer: $107k (3.0% below list) — sets the bar for market timing.
- Cap rate 8.2% vs local median 4.6% in Southfield — top-decile yield for the area; either an underpriced asset or a hidden risk that comps aren't pricing in. Stress-test before assuming the spread holds.
Location & tenants
- Location reads 72/100 on livability (#248 in MI) — a middle-class / working-renter tenant base. Strengths: commute A+, cost of living A+, housing A+; Watch: health & safety D, crime F, amenities F.
- Southfield Public School District (urban): math 17% / reading 37% proficiency, ranked #392 of 540 in MI (top 73%) — low school quality limits family demand, transient renter base, plan for 1-2y turnover.
- Zoned schools: Vandenberg Elementary School (math 17% / reading 27%, grade F, #1,035 of 1,397 statewide, top 77%, 306 students, 69% FRL) — zoned schools average 69% FRL vs 52% district-wide (17 pts higher); higher-poverty schools than district average — tighter screening recommended.
- Market conditions: Rents rising fast (+4.8%/yr); 96 active listings in the ZIP; 23 comparable units currently listed for rent nearby; rentals at typical pace (median 22d on market — plan ~3-4 weeks tenant-placement turnaround); solid renter incomes; 2,614 units permitted in Oakland County in 2024 (721 in 5+ unit buildings).
Forward outlook
- Local home prices are declining (-3.0%/yr); year-one equity from $760 of loan paydown is wiped out by about $3k of value loss. Plan a longer hold.
- Oakland County population projected at +10% by 2050 — modest demand growth; plan on rents tracking national, not racing it.
- At projected returns (-3.0% appreciation + 4.8% rent growth), your $31k cash investment doubles in ~10 years — after that, you're playing with house money.
Negotiation context
- It's been on market 37 days — a 3% lower offer ($107k) is reasonable based on typical stale-listing flexibility.
- 20 sale attempts since 24y ago with the ask held roughly flat each time — persistent listings suggest the price (not the market) is what's stuck; bring a comps-based counter.
Questions for the listing agent
- It's been on market 37 days. Have you received any prior offers? Is the seller open to a 3% concession, seller financing, or rate buy-down credit?
- Built in 1966 — when were the roof, HVAC, electrical panel, plumbing, and water heater last replaced?
- What does the HOA fee cover, when was the last increase, and are there any pending special assessments or reserve-fund shortfalls?
- Any open or pending special assessments — roof, HVAC, plumbing, elevator, façade? What's the per-unit balance and payoff schedule, and is the seller paying it off at close or rolling it to the buyer?
- Is there a deadline driving the sale (1031 exchange, divorce, estate, relocation)? That informs how much negotiation room exists.
- Schools are D-rated, which usually means shorter tenancies and higher turnover. Who's the typical renter profile here, and what's been the actual vacancy rate?
- Crime grade is F in this area — have there been break-ins, vandalism, or insurance claims at this property in the last 3 years? What carrier currently insures it and at what premium?
- What's the average days-on-market for RENTAL listings here right now (not sales)? A rising rental-DOM trend means longer vacancies and softer asking-rent achievability than the comps imply.
- What's the recent tenant-quality profile in this submarket — average credit score on applications, eviction rate, late-payment / NSF rate, and stable-employment percentage? A property-management company in the area should have these aggregated.
- How much new apartment / multifamily construction is in the pipeline within 1–3 miles? Heavy new supply (>2% of stock underway) typically softens rents 12–24 months out; light construction supports rent growth.
Investment metrics
- 1% rule
- 1.45% ✓
- Cap rate
- 8.22%
- Cash-on-cash
- 6.90%
- DSCR
- 1.31
- GRM
- 5.8
CMA / ARV
- ARV (median comp)
- $120,989
- List price
- $109,900
- Delta
- -9.17%
- Verdict
- FAIR
- Comps
- 20 within 1.0 mi
Projected returns pro-forma
-3.0% appreciation · 4.84% rent growth · sell at horizon
- IRR
- -2.8%
- Equity multiple
- 0.89×
- Total profit
- $-3,322
- Equity at exit
- $16,386
- IRR
- 9.5%
- Equity multiple
- 1.82×
- Total profit
- $25,293
- Equity at exit
- $9,502
Cash invested: $30,772 (down + closing). Projections, not guarantees.
Landlord ↔ Tenant lean methodology
- Overall (STATE)
- 62 Landlord-Friendly
- State Michigan
- 62 Landlord-Friendly · EVEN
- County
- — inherits STATE
- City
- — inherits STATE
ZIP-level market 48076
- Rents YoY
- 4.8%
- Active inventory
- 96
- Price-to-rent
- 5.8×
Monthly cashflow live
- Estimated rent
- $1,591 high interval (Pro) →
- Mortgage (P&I)
- −$576
- Tax from tax record
- −$156 /mo · $1,872/yr
- Insurance
- −$46
- HOA
- −$302
- Vacancy / Maint / Mgmt
- −$334
- Net cashflow
- $177
Break-even live
Sensitivity live
| Price | -10% $239 | -5% $208 | +0% $177 | +5% $146 | +10% $115 |
|---|---|---|---|---|---|
| Rent | -10% $51 | -5% $114 | +0% $177 | +5% $240 | +10% $303 |
| Rate | -1.0pp $232 | -0.5pp $205 | base $177 | +0.5pp $148 | +1.0pp $119 |
UW: 25.0% down · 7.5% · 30yr · 1.5% tax · 5.0% vac · 8.0% maint · 8.0% mgmt
Financing live
Cash to close
- Down payment
- $27,475
- Closing costs
- $3,297
- Reserves months
- —
- Total cash needed
- —
Loan-product check · same deal, 3 products live
Conventional
25% down · 7.5% · 30yr
- Down + closing
- —
- Monthly P&I
- —
- Monthly cashflow
- —
- DSCR
- —
- Eligible?
- —
Personal DTI + credit; lowest rate.
DSCR
20% down · 8.5% · 30yr
- Down + closing
- —
- Monthly P&I
- —
- Monthly cashflow
- —
- DSCR
- —
- Eligible?
- —
No personal income docs; deal must DSCR.
Hard money
10% down · 12.0% · 12mo
- Down + closing
- —
- Monthly P&I
- —
- Monthly cashflow
- —
- DSCR
- —
- Eligible?
- —
Short-term bridge; refi at stabilization.
Rent comps 23 comps
| Address | Beds | Baths | Sqft | Rent | $/sqft | DOM | Units | Dist |
|---|---|---|---|---|---|---|---|---|
| 30276 Southfield Rd Unit 215 Southfield, MI | 2.0 | 2.0 | 956 | $1,399 | $1.46 | 22d | 1 | 0.10mi |
| 30268 Southfield Rd #230 Southfield, MI | 2.0 | 2.0 | 956 | $1,450 | $1.52 | 45d | 1 | 0.15mi |
| 30300 Southfield Rd Southfield, MI | 1.0–3.0 | 1.0–2.5 | 1450 | $1,798 | $1.24 | 1d | 1 | 0.21mi |
| 18333 South Dr Southfield, MI | 1.0–2.0 | 1.0–2.0 | 1044 | $1,975 | $1.89 | 0d | 5 | 0.31mi |
| 18335 W 13 Mile Rd Southfield, MI | 1.0–2.0 | 1.0–2.0 | 925 | $1,864 | $2.02 | 1d | 8 | 0.39mi |
| 18248 W 12 Mile Rd Southfield, MI | 1.0–2.0 | 1.0–2.0 | 902 | $2,254 | $2.50 | 0d | 1 | 0.63mi |
| 29890 Everett St Southfield, MI | 3.0 | 1.5 | 1100 | $2,200 | $2.00 | 45d | 1 | 0.66mi |
| 3214 Greenfield Rd Royal Oak, MI | 1.0 | 1.0 | 800 | $1,025 | $1.28 | 26d | 1 | 0.87mi |
| 3210 Greenfield Rd Unit 3214-8 Royal Oak, MI | 1.0 | 1.0 | 800 | $1,025 | $1.28 | 26d | 1 | 0.87mi |
| 3210 Greenfield Rd Unit 3210-8 Royal Oak, MI | 1.0 | 1.0 | 800 | $1,025 | $1.28 | 20d | 1 | 0.87mi |
| 4314 Albert Ave Royal Oak, MI | 1.0 | 1.0 | 650 | $960 | $1.48 | 26d | 1 | 0.91mi |
| 3644 Greenfield Rd Unit 3664 Greenfield Berkley, MI | 2.0 | 1.5 | 950 | $1,700 | $1.79 | 20d | 1 | 1.00mi |
| 4312 13 Mile Rd Royal Oak, MI | 1.0 | 1.0 | 800 | $1,400 | $1.75 | 26d | 1 | 1.01mi |
| 4312-4316 13 Mile and 3415 Fairmont Royal Oak, MI | 1.0 | 1.0 | 525 | $1,100 | $2.10 | 7d | 2 | 1.01mi |
| 4302 W 13 Mile Rd Royal Oak, MI | 1.0 | 1.0 | 600 | $1,095 | $1.82 | 26d | 1 | 1.02mi |
| 4120 W 13 Mile Rd Royal Oak, MI | 1.0–2.0 | 1.0 | 775 | $1,300 | $1.68 | 1d | 4 | 1.08mi |
| 4030 W 13 Mile Rd Unit J2 Royal Oak, MI | 2.0 | 1.0 | 724 | $1,450 | $2.00 | 20d | 1 | 1.21mi |
| 4030 W 13 Mile Rd Unit J2 Royal Oak, MI | 2.0 | 1.0 | 724 | $1,600 | $2.21 | 26d | 1 | 1.21mi |
| 4030 W 13 Mile Rd Unit J2 Royal Oak, MI | 2.0 | 1.0 | 724 | $1,450 | $2.00 | 22d | 1 | 1.21mi |
| 4000 W 13 Mile Rd Royal Oak, MI | 2.0 | 1.0 | 780 | $1,444 | $1.85 | 4d | 3 | 1.24mi |
| 28124 Brentwood St Southfield, MI | 3.0 | 1.0 | 1056 | $1,800 | $1.70 | 26d | 1 | 1.31mi |
| 3936 Royal Ave Berkley, MI | 3.0 | 2.0 | 900 | $2,000 | $2.22 | 45d | 1 | 1.33mi |
| 1948 Henrietta St Birmingham, MI | 3.0 | 1.0 | 1057 | $2,500 | $2.37 | 26d | 1 | 1.40mi |
HOA detail condo
- Monthly dues
- $302 · $3,624/yr
- Assessments
- None detected in remarks — confirm with the listing agent.
Listing history 50 events
-
2026-06-17status $109,900 Pending 37 DOM
Show marketing remark (750 chars)
Welcome to this charming first-level condo featuring 2 spacious bedrooms and 2 bathrooms. Recently updated with fresh paint, new bedroom flooring, stylish new bathroom vanities, updated light fixtures, and many more improvements, this Condo is move-in ready while still offering room for your personal touch. Located just moments away from shopping, dining, and essential amenities, this condo combines comfort and convenience. Enjoy easy access to local shops, restaurants, and entertainment options, making it a perfect choice for those seeking a vibrant lifestyle. Don't miss this opportunity to own a beautifully refreshed condo with great potential. Schedule your showing today! All measurements are approximate. Buyer to verify all information.
-
2026-06-17days on market $109,900 Active 37 DOM
Show marketing remark (750 chars)
Welcome to this charming first-level condo featuring 2 spacious bedrooms and 2 bathrooms. Recently updated with fresh paint, new bedroom flooring, stylish new bathroom vanities, updated light fixtures, and many more improvements, this Condo is move-in ready while still offering room for your personal touch. Located just moments away from shopping, dining, and essential amenities, this condo combines comfort and convenience. Enjoy easy access to local shops, restaurants, and entertainment options, making it a perfect choice for those seeking a vibrant lifestyle. Don't miss this opportunity to own a beautifully refreshed condo with great potential. Schedule your showing today! All measurements are approximate. Buyer to verify all information.
-
2026-06-16days on market $109,900 Active 36 DOM
-
2026-06-15days on market $109,900 Active 35 DOM
-
2026-06-13days on market $109,900 Active 33 DOM
-
2026-06-13days on market $109,900 Active 32 DOM
-
2026-06-09days on market $109,900 Active 29 DOM
-
2026-06-08days on market $109,900 Active 28 DOM
-
2026-06-07days on market $109,900 Active 27 DOM
-
2026-06-04days on market $109,900 Active 24 DOM
-
2026-06-03days on market $109,900 Active 23 DOM
-
2026-06-02days on market $109,900 Active 22 DOM
-
2026-06-01days on market $109,900 Active 21 DOM
-
2026-05-31days on market $109,900 Active 20 DOM
-
2026-05-11$109,900 Active 757-char remark
Show marketing remark (750 chars)
Welcome to this charming first-level condo featuring 2 spacious bedrooms and 2 bathrooms. Recently updated with fresh paint, new bedroom flooring, stylish new bathroom vanities, updated light fixtures, and many more improvements, this Condo is move-in ready while still offering room for your personal touch. Located just moments away from shopping, dining, and essential amenities, this condo combines comfort and convenience. Enjoy easy access to local shops, restaurants, and entertainment options, making it a perfect choice for those seeking a vibrant lifestyle. Don't miss this opportunity to own a beautifully refreshed condo with great potential. Schedule your showing today! All measurements are approximate. Buyer to verify all information.
-
2026-05-11$109,900 Active 750-char remark
Show marketing remark (750 chars)
Welcome to this charming first-level condo featuring 2 spacious bedrooms and 2 bathrooms. Recently updated with fresh paint, new bedroom flooring, stylish new bathroom vanities, updated light fixtures, and many more improvements, this Condo is move-in ready while still offering room for your personal touch. Located just moments away from shopping, dining, and essential amenities, this condo combines comfort and convenience. Enjoy easy access to local shops, restaurants, and entertainment options, making it a perfect choice for those seeking a vibrant lifestyle. Don't miss this opportunity to own a beautifully refreshed condo with great potential. Schedule your showing today! All measurements are approximate. Buyer to verify all information.
-
2026-03-24historical
-
2026-03-24historical
-
2026-02-08$99,900 Active
-
2026-02-07$99,900 Active
-
2025-12-19historical
-
2025-12-19historical
-
2025-11-23$99,900 Active
-
2025-11-23$99,900 Active
-
2024-02-13historical
-
2024-02-13historical
-
2023-12-26$1,300 Active
-
2023-12-26$1,300
-
2023-08-17soldstatus $132,000
-
2023-07-01$135,000
-
2020-07-24soldstatus $80,000 Sold
-
2020-07-24soldstatus $80,000 Closed
-
2020-07-05status Pending
-
2020-07-05status Pending
-
2020-05-27price $89,900
-
2020-05-27price $89,900
-
2020-03-25$94,900 Active
-
2020-03-25$94,900 Active
-
2016-05-02soldstatus $46,000
-
2015-06-10historical
-
2015-06-10historical
-
2015-01-02$66,500 Active
-
2015-01-01$66,500
-
2010-05-28soldstatus $13,750
-
2010-04-16$15,000
-
2009-02-19historical
-
2008-09-22$70,000
-
2007-09-17historical
-
2007-04-11$54,900
-
2007-01-08soldstatus $61,000
ⓘ Source: listings_history table (triggers on properties + properties_extension) + one-shot
backfill from property_details.listing_events for pre-trigger history.
Tax reassessment forecast MI · Partial reset (capped growth)
- Current annual tax
- $1,872 · $156/mo
- Projected year-2 tax
- $1,872 · $156/mo
- Expected delta
- $0/yr ($0/mo · 0.0%)
ⓘ Screening estimate from a state-policy table — verify with the county assessor before closing.
Climate risk First Street
- Flood 1/10 Low FEMA zone X (unshaded) · 0% chance over 30 yrs
- Wildfire 1/10 Low
- Heat 3/10 Moderate 7 d/yr ≥97°F today · 15 d/yr by 30 yrs out
- Wind 2/10 Low
- Air quality 4/10 Moderate 3 unhealthy d/yr today · 6 by 30 yrs out
Nearby sold comps map
Loading sold comps map…
Walkable amenities ~0.75 mi
Loading nearby amenities…
Taxation est. · year 1
- Rental income
- $19,094
- − Mortgage interest
- −$6,156
- − Property taxes
- −$1,872
- − Insurance
- −$550
- − Repairs & maintenance
- −$1,528
- − Management
- −$1,528
- − HOA
- −$3,624
- − Depreciation
- −$3,197
- Taxable income
- $640
- Est. tax owed @ 24.0%
- −$154
- After-tax cash flow
- $1,969/yr
For passive investors: Depreciation is non-cash, so a rental often shows a tax loss while cash-flowing — sheltering income. Rental losses are passive: they offset passive income freely, and up to $25,000/yr can offset ordinary (W-2) income if you actively participate and your MAGI is under $100k (phasing out to $0 by $150k); unused losses carry forward. On sale, claimed depreciation is recaptured at up to 25%, and gains may owe capital-gains tax (a 1031 exchange can defer both). Figures are a year-1 estimate at your 24.0% rate — not tax advice; consult a CPA.
Schools (NCES district)
- District
- Southfield Public School District
- NCES district ID
- 2632310
- Math proficiency
- 17% ▼ -3.00%
- Reading proficiency
- 37% ▲ 1.00%
- Median HH income
- $51,400
- Composite
- 23.77/100
- National rank
- #7814
- State rank
- #392 of 540 in MI
Livability — Southfield
- Score
- 72/100
- State rank
- #248
- US rank
- #6175
Category grades
Schools grade is shown separately in the Schools card above.
Census & demographics
- Census place
- Southfield, MI
- County
- Oakland County · 1,009,092 people
- City population
- 54,914
- Metro
- Detroit-Warren-Dearborn, MI
- Population (ZIP)
- 25,405
- Household income
- $90,058
- Rent vs Own
- Severe rent burden
- 607.0
Population outlook (Oakland County) Hauer SSP2
- Today (2025)
- 1,335,747 people
- By 2030
- 1,375,100 · +2.9%
- By 2040
- 1,435,385 · +7.5%
- By 2050
- 1,469,250 · +10.0%
- By 2075
- 1,531,946 · +14.7%
- By 2100
- 1,450,485 · +8.6%
Race, ethnicity, and origin ACS 2023
- Neighborhood character
- Diverse neighborhood (Simpson 0.57)
- Race & ethnicity
- Black 57% White 32% Two or more races 7% Hispanic / Latino 3% Asian 2%
- Common ancestry
- Romanian 3% Slovak 1% Scotch-Irish 1%
- Foreign-born
- 8% · Canada, Vietnam
- Languages at home
- 90% English-only · Spanish 3% Arabic 2% Russian/Polish/Slavic 1%
Political lean MEDSL · Oakland
- 2024 margin
- D (+10.6) · D 54.4% · R 43.8% · Other 1.9%
- 2008→2024 swing
- -3.9pp toward R · 2008: 14.5pp · 2024: 10.6pp
- All cycles
- 2024: D+10.6 2020: D+14.1 2016: D+8.1 2012: D+8.1 2008: D+14.5
Not yet ingested
- Civics
- —
Market trends
- HPI YoY
- ▼ -192.13%
- Current HPI
- 229.2304
- Rent YoY
- ▲ 4.84%
- Metro
- Detroit-Warren-Dearborn, MI
- State GDP YoY
- ▲ 1.37%
- F500 in state
- 28
Industry mix (Fortune 500 HQ in MI)
| Industry | F500 HQs | Revenue |
|---|---|---|
| Automotive Parts | 3 | $48B |
|
||
| Automotive | 2 | $372B |
|
||
| Chemicals | 1 | $45B |
|
||
| Automotive Retail | 1 | $29B |
|
||
| Healthcare / Medical Devices | 1 | $23B |
|
||
| Automotive Technology | 1 | $20B |
|
||
Price history
+147.0% since first listed47 events — show timeline
- 2026-06-17 Pending — MiRealSource-MiMLS
- 2026-06-17 Pending — REALCOMP
- 2026-05-11 Listed $109,900 REALCOMP
- 2026-05-11 Listed $109,900 MiRealSource-MiMLS
- 2026-03-24 Listing Removed — MiRealSource-MiMLS
- 2026-03-24 Listing Removed — REALCOMP
- 2026-02-08 Listed $99,900 REALCOMP
- 2026-02-07 Listed $99,900 MiRealSource-MiMLS
- 2025-12-19 Listing Removed — MiRealSource-MiMLS
- 2025-12-19 Listing Removed — REALCOMP
- 2025-11-23 Listed $99,900 REALCOMP
- 2025-11-23 Listed $99,900 MiRealSource-MiMLS
- 2024-02-13 Listing Removed — MiRealSource-MiMLS
- 2024-02-13 Listing Removed — REALCOMP
- 2023-12-26 Listed $1,300 MiRealSource-MiMLS
- 2023-12-26 Listed $1,300 REALCOMP
- 2023-08-17 Sold (MLS) $132,000 REALCOMP
- 2023-07-01 Listed $135,000 REALCOMP
- 2020-07-24 Sold (MLS) $80,000 MiRealSource-MiMLS
- 2020-07-24 Sold (MLS) $80,000 REALCOMP
- 2020-07-05 Pending — MiRealSource-MiMLS
- 2020-07-05 Pending — REALCOMP
- 2020-05-27 Price Changed $89,900 MiRealSource-MiMLS
- 2020-05-27 Price Changed $89,900 REALCOMP
- 2020-03-25 Listed $94,900 MiRealSource-MiMLS
- 2020-03-25 Listed $94,900 REALCOMP
- 2016-05-02 Sold (Public Records) $46,000 Public Records
- 2015-06-10 Listing Removed — REALCOMP
- 2015-06-10 Listing Removed — MiRealSource-MiMLS
- 2015-01-02 Listed $66,500 REALCOMP
- 2015-01-01 Listed $66,500 MiRealSource-MiMLS
- 2010-05-28 Sold (MLS) $13,750 REALCOMP
- 2010-04-16 Listed $15,000 REALCOMP
- 2009-02-19 Listing Removed — MiRealSource-MiMLS
- 2008-09-22 Listed $70,000 MiRealSource-MiMLS
- 2007-09-17 Listing Removed — MiRealSource-MiMLS
- 2007-04-11 Listed $54,900 MiRealSource-MiMLS
- 2007-01-08 Sold (MLS) $61,000 MiRealSource-MiMLS
- 2007-01-03 Listing Removed — MiRealSource-MiMLS
- 2006-11-15 Listed $67,500 MiRealSource-MiMLS
- 2006-10-30 Listing Removed — MiRealSource-MiMLS
- 2006-09-05 Listed $67,500 MiRealSource-MiMLS
- 2006-08-30 Listing Removed — MiRealSource-MiMLS
- 2006-05-03 Listed $72,500 MiRealSource-MiMLS
- 2002-06-06 Listing Removed — REALCOMP
- 2002-04-29 Listed $87,500 REALCOMP
- 1993-03-26 Sold (Public Records) $44,500 Public Records
Property tax history
+4.9%/yrLatest (2025): $1,872 · +3.1% YoY. Source: county tax records.
Cash-flow waterfall
monthlySold comps — $/sqft
last 12 mo · ≤1 miLoading sold comps…