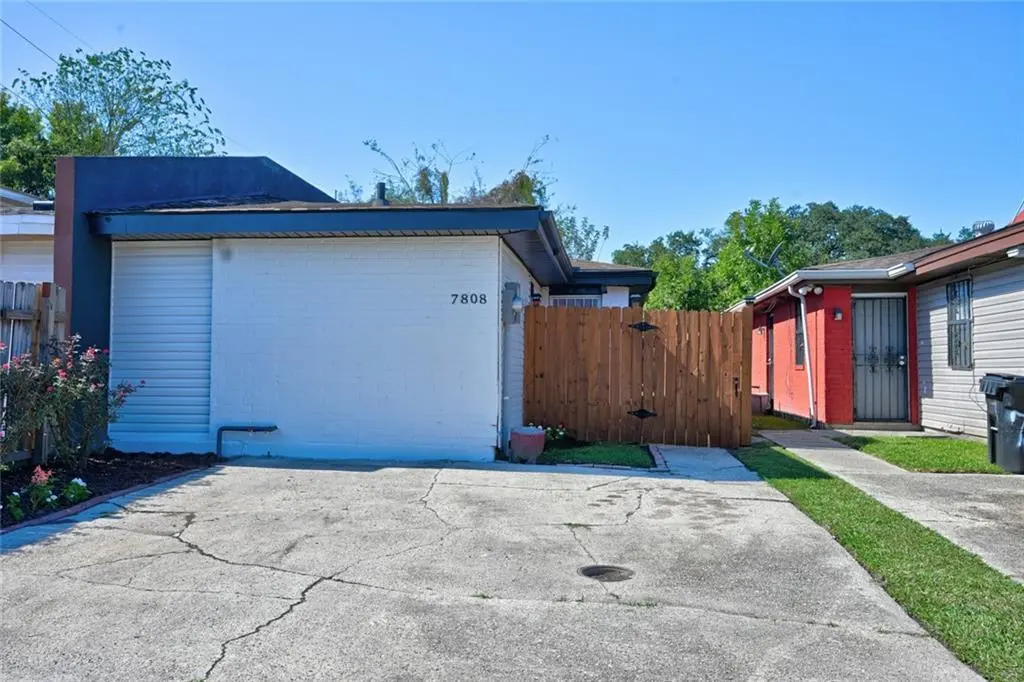
7808 Bass St · New Orleans, LA
Flood risk No data
- FEMA flood zone
- —
- Chance of flooding over 30 yrs
- —
- Est. flood insurance / yr
- —
Fire risk No data
- Est. fire insurance / yr
- —
Heat risk No data
- Hot days now (above threshold)
- —
- Hot days in 30 yrs
- —
Wind risk No data
- Chance of severe wind over 30 yrs
- —
Air-quality risk No data
- Unhealthy air days now
- —
- Unhealthy air days in 30 yrs
- —
Risk factors via First Street. Map © Google.
Why this score? — see what drove the B+ grade
The composite is a weighted blend of 9 inputs, each scored 0–100. Each bar is that input's sub-score; the figure is the points it added to the 100-point composite (weight × sub-score).
- Cash flow +30.0/30.0
- ARV discount +15.0/15.0
- 1% rule +10.0/10.0
- DSCR +10.0/10.0
- Livability +4.0/5.0
- Rent growth +2.5/5.0
- Condition / age +2.5/5.0
- Schools +1.6/10.0
- Appreciation +0.0/10.0
$79,000
🖨 Deal sheet (PDF) 📄 Offer letter ✓ Due diligence
Listing remarks MLS
<p style="color:green"> Small, well-maintained home in the East for sale! Excellent as an investment property with strong rental income production or for a first-time homebuyer! Schedule your tour today!!!
Key facts
- 2,500 sq ft lot
- Parking
- Built 1979
Neighborhood map
What this means for you Summary
Snapshot
- This is a 3-bed/2.0-bath townhouse listed at $79k.
Deal economics
- At list price, monthly cash flow is $573 ($7k/yr) — positive.
- The deal already cash-flows at list — no discount required.
- Meets the 1% rule at list price ($1k rent vs $79k).
- Recommended offer: $70k (12.0% below list) — sets the bar for market timing.
- Cap rate 15.0% vs local median 4.4% in New Orleans — top-decile yield for the area; either an underpriced asset or a hidden risk that comps aren't pricing in. Stress-test before assuming the spread holds.
Location & tenants
- Location reads 81/100 on livability (#3 in LA, #1,383 nationally) — a professional / high-income tenant draw. Strengths: amenities A+, commute A+, health & safety A+; Watch: crime C-, employment D.
- Orleans Parish (urban): math 11% / reading 27% proficiency, ranked #69 of 98 in LA (top 70%) — low school quality limits family demand, transient renter base, plan for 1-2y turnover; 68% free/reduced lunch — lower-income household profile, screen leases tightly.
- Zoned schools: Benjamin Franklin Elem. Math And Science (math 12% / reading 23%, grade F, #479 of 646 statewide, top 75%, 747 students, 98% FRL, charter) — zoned schools average 98% FRL vs 68% district-wide (30 pts higher); higher-poverty schools than district average — tighter screening recommended.
- Market conditions: 106 active listings in the ZIP; 13 comparable units currently listed for rent nearby; rentals at typical pace (median 25d on market — plan ~3-4 weeks tenant-placement turnaround); 710 units permitted in Orleans Parish in 2024 (244 in 5+ unit buildings).
Forward outlook
- Local home prices are declining (-3.0%/yr); year-one equity from $546 of loan paydown is wiped out by about $2k of value loss. Plan a longer hold.
- Orleans County population projected at +61% by 2050 — long-run rental-demand tailwind backs the buy-and-hold thesis.
- At projected returns (-3.0% appreciation + 3.0% rent growth), your $22k cash investment doubles in ~4 years — after that, you're playing with house money.
Negotiation context
- It's been on market 243 days — a 12% lower offer ($70k) is reasonable based on typical stale-listing flexibility.
- 6 sale attempts since 5y ago with the ask held roughly flat each time — persistent listings suggest the price (not the market) is what's stuck; bring a comps-based counter.
- Current owner paid $45k; list at $79k implies a 76% gain — meaningful room to come down on a strong offer.
Questions for the listing agent
- It's been on market 243 days. Have you received any prior offers? Is the seller open to a 12% concession, seller financing, or rate buy-down credit?
- Built in 1979 — when were the roof, HVAC, electrical panel, plumbing, and water heater last replaced?
- Why hasn't it sold? Are there any deal-killer items the seller is aware of (foundation, flood, title, zoning, code violations)?
- Is there a deadline driving the sale (1031 exchange, divorce, estate, relocation)? That informs how much negotiation room exists.
- What's the average days-on-market for RENTAL listings here right now (not sales)? A rising rental-DOM trend means longer vacancies and softer asking-rent achievability than the comps imply.
- What's the recent tenant-quality profile in this submarket — average credit score on applications, eviction rate, late-payment / NSF rate, and stable-employment percentage? A property-management company in the area should have these aggregated.
- How much new for-sale + rental construction is in the pipeline within 1–3 miles? Heavy new supply typically softens prices + rents 12–24 months out; constrained supply supports both.
Investment metrics
- 1% rule
- 1.77% ✓
- Cap rate
- 14.99%
- Cash-on-cash
- 31.06%
- DSCR
- 2.38
- GRM
- 4.7
CMA / ARV
- ARV (median comp)
- $103,891
- List price
- $79,000
- Delta
- -23.96%
- Verdict
- UNDERPRICED
- Comps
- 20 within 1.0 mi
Show comp detail 1 sale within ~0.75 mi
| Address | Dist | Beds/Ba | Sqft | Sold | Price | $/sf | Match |
|---|---|---|---|---|---|---|---|
| 7857 Sand St | 0.14mi | 4/2.0 (+1) | 1,090 (+2%) | 22mo | $90,000 | $83 | 67 |
Match score weights: distance 35% · size 25% · config 20% · recency 20%. Top-matched comps best support the ARV.
Projected returns pro-forma
-3.0% appreciation · 3.0% rent growth · sell at horizon
- IRR
- 25.9%
- Equity multiple
- 2.07×
- Total profit
- $23,676
- Equity at exit
- $11,779
- IRR
- 33.5%
- Equity multiple
- 4.06×
- Total profit
- $67,620
- Equity at exit
- $6,830
Cash invested: $22,120 (down + closing). Projections, not guarantees.
Landlord ↔ Tenant lean methodology
- Overall (STATE)
- 90 Strongly Landlord-Friendly
- State Louisiana
- 90 Strongly Landlord-Friendly · R+12
- County
- — inherits STATE
- City
- — inherits STATE
ZIP-level market 70128
- Home prices YoY
- -5.9%
- Active inventory
- 106
- Price-to-rent
- 4.7×
Monthly cashflow live
- Estimated rent
- $1,396 high interval (Pro) →
- Mortgage (P&I)
- −$414
- Tax from tax record
- −$83 /mo · $1,001/yr
- Insurance
- −$33
- HOA
- −$0
- Vacancy / Maint / Mgmt
- −$293
- Net cashflow
- $573
Break-even live
Sensitivity live
| Price | -10% $617 | -5% $595 | +0% $573 | +5% $550 | +10% $528 |
|---|---|---|---|---|---|
| Rent | -10% $462 | -5% $517 | +0% $573 | +5% $628 | +10% $683 |
| Rate | -1.0pp $612 | -0.5pp $593 | base $573 | +0.5pp $552 | +1.0pp $531 |
UW: 25.0% down · 7.5% · 30yr · 1.5% tax · 5.0% vac · 8.0% maint · 8.0% mgmt
Financing live
Cash to close
- Down payment
- $19,750
- Closing costs
- $2,370
- Reserves months
- —
- Total cash needed
- —
Loan-product check · same deal, 3 products live
Conventional
25% down · 7.5% · 30yr
- Down + closing
- —
- Monthly P&I
- —
- Monthly cashflow
- —
- DSCR
- —
- Eligible?
- —
Personal DTI + credit; lowest rate.
DSCR
20% down · 8.5% · 30yr
- Down + closing
- —
- Monthly P&I
- —
- Monthly cashflow
- —
- DSCR
- —
- Eligible?
- —
No personal income docs; deal must DSCR.
Hard money
10% down · 12.0% · 12mo
- Down + closing
- —
- Monthly P&I
- —
- Monthly cashflow
- —
- DSCR
- —
- Eligible?
- —
Short-term bridge; refi at stabilization.
Rent comps 13 comps
| Address | Beds | Baths | Sqft | Rent | $/sqft | DOM | Units | Dist |
|---|---|---|---|---|---|---|---|---|
| 14724 Emory Rd New Orleans, LA | 3.0 | 2.0 | 1400 | $1,500 | $1.07 | 25d | 1 | 0.09mi |
| 7843 Sail St New Orleans, LA | 3.0 | 1.5 | 1500 | $1,200 | $0.80 | 25d | 1 | 0.11mi |
| 7849 Sail St New Orleans, LA | 3.0 | 2.0 | 1395 | $1,200 | $0.86 | 25d | 1 | 0.12mi |
| 14509 Duane Rd New Orleans, LA | 2.0 | 1.0 | 1150 | $1,518 | $1.32 | 25d | 1 | 0.12mi |
| 7851 Sail St New Orleans, LA | 3.0 | 2.0 | 1395 | $1,200 | $0.86 | 25d | 1 | 0.12mi |
| 14900 Curran Rd New Orleans, LA | 3.0 | 2.0 | 1221 | $1,250 | $1.02 | 25d | 1 | 0.14mi |
| 7808 Sun St New Orleans, LA | 4.0 | 1.5 | 1500 | $1,950 | $1.30 | 25d | 1 | 0.15mi |
| 14530 Duane Rd New Orleans, LA | 3.0 | 1.0 | 1150 | $1,450 | $1.26 | 4d | 1 | 0.16mi |
| 14530 Duane Rd New Orleans, LA | 3.0 | 1.0 | 1150 | $1,450 | $1.26 | 5d | 1 | 0.16mi |
| 7825 Star St New Orleans, LA | 2.0 | 1.0 | 982 | $1,250 | $1.27 | 25d | 1 | 0.23mi |
| 14031 Linden St New Orleans, LA | 3.0 | 2.0 | 1200 | $1,400 | $1.17 | 25d | 1 | 0.35mi |
| 7501 Briarwood Dr New Orleans, LA | 3.0 | 2.0 | 1500 | $1,850 | $1.23 | 25d | 1 | 0.72mi |
| 12345 I 10 Service Rd New Orleans, LA | 1.0–2.0 | 1.0–2.0 | 746 | $1,125 | $1.51 | 3d | 200 | 1.44mi |
Listing history 24 events
-
2026-06-21days on market $79,000 Active 243 DOM
-
2026-06-18days on market $79,000 Active 240 DOM
-
2026-06-17days on market $79,000 Active 239 DOM
-
2026-06-16days on market $79,000 Active 238 DOM
-
2026-06-15days on market $79,000 Active 237 DOM
-
2026-06-13days on market $79,000 Active 235 DOM
-
2026-06-10days on market $79,000 Active 232 DOM
-
2026-06-09days on market $79,000 Active 231 DOM
-
2026-06-08days on market $79,000 Active 230 DOM
-
2026-06-07days on market $79,000 Active 229 DOM
-
2026-06-05days on market $79,000 Active 226 DOM
-
2026-06-03days on market $79,000 Active 225 DOM
-
2026-06-02days on market $79,000 Active 224 DOM
-
2026-06-01days on market $79,000 Active 223 DOM
-
2026-05-31days on market $79,000 Active 222 DOM
-
2026-04-21status Active 205-char remark
Show marketing remark (181 chars)
Small, well-maintained home in the East for sale! Excellent as an investment property with strong rental income production or for a first-time homebuyer! Schedule your tour today!!!
-
2026-04-21status Active 181-char remark
Show marketing remark (181 chars)
Small, well-maintained home in the East for sale! Excellent as an investment property with strong rental income production or for a first-time homebuyer! Schedule your tour today!!!
-
2026-04-21historical 181-char remark
Show marketing remark (181 chars)
Small, well-maintained home in the East for sale! Excellent as an investment property with strong rental income production or for a first-time homebuyer! Schedule your tour today!!!
-
2026-01-21status Active 181-char remark
Show marketing remark (181 chars)
Small, well-maintained home in the East for sale! Excellent as an investment property with strong rental income production or for a first-time homebuyer! Schedule your tour today!!!
-
2025-12-02historical Active Under Contract 181-char remark
Show marketing remark (181 chars)
Small, well-maintained home in the East for sale! Excellent as an investment property with strong rental income production or for a first-time homebuyer! Schedule your tour today!!!
-
2025-10-20$79,000 Active 205-char remark
Show marketing remark (181 chars)
Small, well-maintained home in the East for sale! Excellent as an investment property with strong rental income production or for a first-time homebuyer! Schedule your tour today!!!
-
2025-10-20$79,000 Active 181-char remark
Show marketing remark (181 chars)
Small, well-maintained home in the East for sale! Excellent as an investment property with strong rental income production or for a first-time homebuyer! Schedule your tour today!!!
-
2021-02-22$50,000
-
1983-02-28soldstatus $45,000
ⓘ Source: listings_history table (triggers on properties + properties_extension) + one-shot
backfill from property_details.listing_events for pre-trigger history.
Tax reassessment forecast LA · Resets to sale price
- Current annual tax
- $1,001 · $83/mo
- Projected year-2 tax
- $1,001 · $83/mo
- Expected delta
- $0/yr ($0/mo · 0.0%)
ⓘ Screening estimate from a state-policy table — verify with the county assessor before closing.
Nearby sold comps map
Loading sold comps map…
Walkable amenities ~0.75 mi
Loading nearby amenities…
Taxation est. · year 1
- Rental income
- $16,757
- − Mortgage interest
- −$4,425
- − Property taxes
- −$1,001
- − Insurance
- −$395
- − Repairs & maintenance
- −$1,341
- − Management
- −$1,341
- − Depreciation
- −$2,298
- Taxable income
- $5,956
- Est. tax owed @ 24.0%
- −$1,430
- After-tax cash flow
- $5,441/yr
For passive investors: Depreciation is non-cash, so a rental often shows a tax loss while cash-flowing — sheltering income. Rental losses are passive: they offset passive income freely, and up to $25,000/yr can offset ordinary (W-2) income if you actively participate and your MAGI is under $100k (phasing out to $0 by $150k); unused losses carry forward. On sale, claimed depreciation is recaptured at up to 25%, and gains may owe capital-gains tax (a 1031 exchange can defer both). Figures are a year-1 estimate at your 24.0% rate — not tax advice; consult a CPA.
Schools (NCES district)
- District
- Orleans Parish
- NCES district ID
- 2201170
- Math proficiency
- 11% ▼ -52.00%
- Reading proficiency
- 27% ▼ -46.00%
- Median HH income
- $37,011
- Composite
- 15.78/100
- National rank
- #9271
- State rank
- #69 of 98 in LA
Livability — New Orleans
- Score
- 81/100
- State rank
- #3
- US rank
- #1383
Category grades
Schools grade is shown separately in the Schools card above.
Census & demographics
- Census place
- New Orleans, LA
- City population
- 338,817
- Population (ZIP)
- 22,973
Population outlook (Orleans County) Hauer SSP2
- Today (2025)
- 513,025 people
- By 2030
- 575,781 · +12.2%
- By 2040
- 700,174 · +36.5%
- By 2050
- 826,541 · +61.1%
- By 2075
- 1,123,374 · +119.0%
- By 2100
- 1,355,609 · +164.2%
Race, ethnicity, and origin ACS 2023
- Neighborhood character
- Predominantly Black (86%)
- Race & ethnicity
- Black 86% Asian 5% White 4% Two or more races 3%
- Foreign-born
- 4% · Vietnam, Canada
- Languages at home
- 95% English-only · Vietnamese 4% Spanish 1%
Political lean MEDSL · Orleans
- 2024 margin
- Solid D (+67.0) · D 82.2% · R 15.2% · Other 2.7%
- 2008→2024 swing
- +6.7pp toward D · 2008: 60.3pp · 2024: 67.0pp
- All cycles
- 2024: D+67.0 2020: D+68.2 2016: D+66.2 2012: D+62.5 2008: D+60.3
Not yet ingested
- Civics
- —
Market trends
- HPI YoY
- ▼ -15.51%
- Current HPI
- 247.7131
- Rent YoY
- —
- Metro
- —
- State GDP YoY
- ▲ 3.29%
- F500 in state
- 10
Industry mix (Fortune 500 HQ in LA)
| Industry | F500 HQs | Revenue |
|---|---|---|
| Telecommunications | 2 | $23B |
|
||
| Utilities | 1 | $12B |
|
||
| Wholesale / Distribution | 1 | $5B |
|
||
| Advertising | 1 | $2B |
|
||
Price history
+75.6% since first listed9 events — show timeline
- 2026-04-21 Relisted — AcadianaMLS
- 2026-04-21 Relisted — GSREIN
- 2026-04-21 Listing Removed — GSREIN
- 2026-01-21 Relisted — GSREIN
- 2025-12-02 Contingent — GSREIN
- 2025-10-20 Listed $79,000 GSREIN
- 2025-10-20 Listed $79,000 AcadianaMLS
- 2021-02-22 Listed $50,000 AcadianaMLS
- 1983-02-28 Sold (Public Records) $45,000 Public Records
Property tax history
+3.4%/yrLatest (2026): $1,001 · +1.1% YoY. Source: county tax records.
Cash-flow waterfall
monthlySold comps — $/sqft
last 12 mo · ≤1 miLoading sold comps…