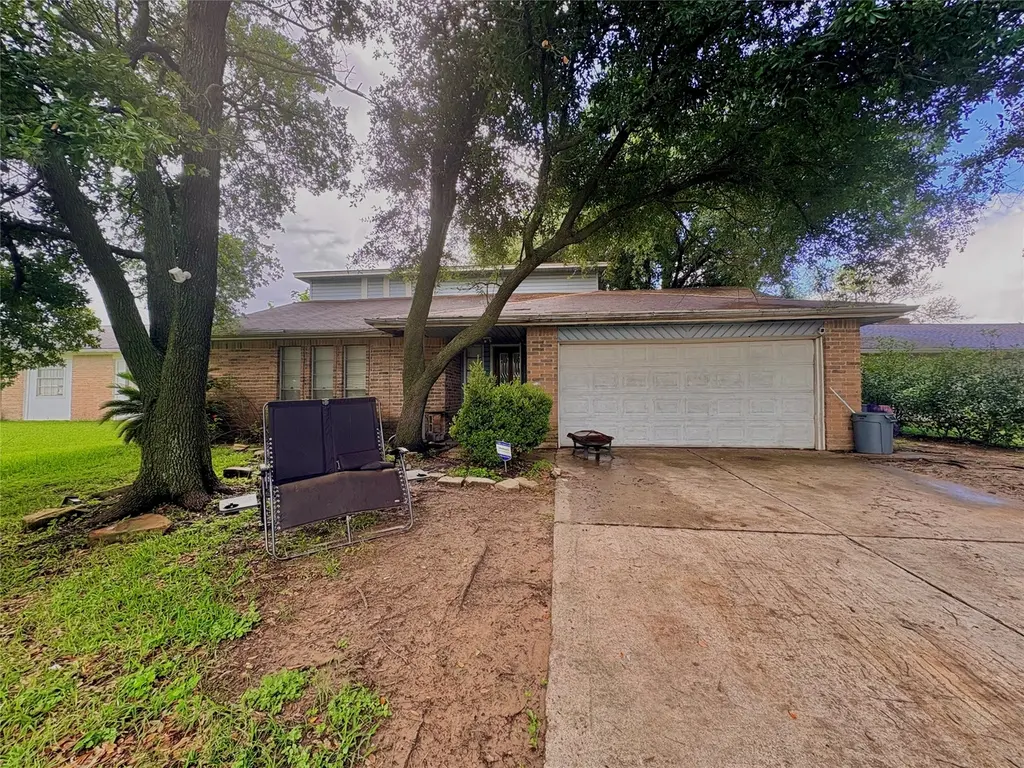
8215 Leather Market St · Houston, TX
Flood risk 6/10 · Moderate
- FEMA flood zone
- X (unshaded)
- Chance of flooding over 30 yrs
- 0.68%
- Est. flood insurance / yr
- $507 – $1,088
Fire risk 1/10 · Minimal
- Est. fire insurance / yr
- $1,222 – $2,270
Heat risk 9/10 · Severe
- Hot days now (above 110°F)
- 7 days/yr
- Hot days in 30 yrs
- 23 days/yr
Wind risk 9/10 · Severe
- Chance of severe wind over 30 yrs
- 99.0%
Air-quality risk 3/10 · Minor
- Unhealthy air days now
- 3 days/yr
- Unhealthy air days in 30 yrs
- 4 days/yr
Risk factors via First Street. Map © Google.
Why this score? — see what drove the C+ grade
The composite is a weighted blend of 9 inputs, each scored 0–100. Each bar is that input's sub-score; the figure is the points it added to the 100-point composite (weight × sub-score).
- Cash flow +19.9/30.0
- ARV discount +15.0/15.0
- 1% rule +6.7/10.0
- DSCR +6.3/10.0
- Appreciation +4.8/10.0
- Schools +4.4/10.0
- Livability +3.7/5.0
- Condition / age +2.5/5.0
- Rent growth +1.7/5.0
$180,000
🖨 Deal sheet (PDF) 📄 Offer letter ✓ Due diligence
Listing remarks
Opportunity knocks in the highly desirable Westbank area! This spacious two-story home offers 4 bedrooms, 3 full bathrooms, and 2,242 sqft of living space, making it an excellent opportunity for investors, flippers, or buyers looking to add their personal touch. Featuring a functional floor plan with generous living areas, ample bedroom space, and plenty of natural light, this property has strong potential for renovation and value enhancement. The home is being sold as-is and will require TLC, but the solid footprint and size provide an outstanding canvas for updates and customization. Conveniently located near major highways, shopping, dining, parks, and top local amenities, this property
Key facts
- Two-story home
- Customization
- Natural light
Tags
Property features AI
Finance
- Financial info: Lease not considered
Exterior
- Parking: Attached 2-car garage
- Utilities: Public water; Public sewer
- Home design: Residential property; Built in 1976; Slab foundation; Composition roof
- Construction: Brick construction
- Exterior features: Private yard; Located on a cul-de-sac
Interior
- Flooring: Carpet
- Bathrooms: Three full bathrooms; One half bathroom
- Heating & cooling: Central heating (electric); Central air conditioning (electric)
- Interior features: One fireplace; Carpet flooring; Total of 4 rooms
Neighborhood map
What this means for you Summary
Snapshot
- This is a 4-bed/3.5-bath single-family listed at $180k.
Deal economics
- At list price, monthly cash flow is $217 ($3k/yr) — positive.
- The deal already cash-flows at list — no discount required.
- Meets the 1% rule at list price ($2k rent vs $180k).
- Cap rate 7.7% vs local median 3.2% in Houston — top-decile yield for the area; either an underpriced asset or a hidden risk that comps aren't pricing in. Stress-test before assuming the spread holds.
Location & tenants
- Location reads 74/100 on livability (#184 in TX, #4,771 nationally) — a middle-class / working-renter tenant base. Strengths: amenities A+, cost of living A+, housing A+; Watch: crime F.
- Cypress-Fairbanks ISD (suburban): math 45% / reading 52% proficiency, ranked #161 of 826 in TX (top 20%) — families likely to look elsewhere, expect single-tenant / working-renter base with shorter leases.
- Zoned schools: Cook Middle (math 46% / reading 49%, grade C-, #408 of 1,662 statewide, top 25%, 1,428 students, 66% FRL); Jersey Village H S (math 50% / reading 59%, grade C-, #379 of 1,632 statewide, top 26%, 3,364 students, 64% FRL) — zoned schools average 65% FRL vs 43% district-wide (22 pts higher); higher-poverty schools than district average — tighter screening recommended.
- Market conditions: Rents falling (-3.4%/yr); 152 active listings in the ZIP; 6 comparable units currently listed for rent nearby; rentals lingering (median 44d on market — plan ~5-8 weeks vacancy on turnover, expect pricing pressure); 50% of comp listings sitting > 30 days — soft ceiling on asking rent; solid renter incomes; 29,883 units permitted in Harris County in 2024 (8,621 in 5+ unit buildings).
- This rent runs 31% of the median local income ($82k/yr) — at the standard rent-burdened threshold; future hikes will face affordability resistance.
Forward outlook
- In year one you build about $443 of equity ($1k loan paydown + $-801 appreciation (-0.4% local appreciation)).
- Harris County population projected at +47% by 2050 — long-run rental-demand tailwind backs the buy-and-hold thesis.
Negotiation context
- Only 10 days on market — expect competitive offers; lowballing is unlikely to land.
Risks & watch-outs
- Watch-outs: property tax is 2.9% of price.
- Climate carrying-cost: major flood risk; severe wind risk, 99% chance of damaging wind over 30y; extreme-heat days projected 7→23/yr by 2055 (HVAC capex compounding) — expect insurance premiums to compound above CPI over the hold.
Questions for the listing agent
- Built in 1976 — when were the roof, HVAC, electrical panel, plumbing, and water heater last replaced?
- Property tax is high relative to price — has the assessment been appealed recently, and will the sale trigger a re-assessment?
- Is there a deadline driving the sale (1031 exchange, divorce, estate, relocation)? That informs how much negotiation room exists.
- Schools are D-rated, which usually means shorter tenancies and higher turnover. Who's the typical renter profile here, and what's been the actual vacancy rate?
- Crime grade is F in this area — have there been break-ins, vandalism, or insurance claims at this property in the last 3 years? What carrier currently insures it and at what premium?
- What's the average days-on-market for RENTAL listings here right now (not sales)? A rising rental-DOM trend means longer vacancies and softer asking-rent achievability than the comps imply.
- What's the recent tenant-quality profile in this submarket — average credit score on applications, eviction rate, late-payment / NSF rate, and stable-employment percentage? A property-management company in the area should have these aggregated.
- How much new for-sale + rental construction is in the pipeline within 1–3 miles? Heavy new supply typically softens prices + rents 12–24 months out; constrained supply supports both.
Investment metrics
- 1% rule
- 1.17% ✓
- Cap rate
- 7.74%
- Cash-on-cash
- 5.18%
- DSCR
- 1.23
- GRM
- 7.1
CMA / ARV
- ARV (on-the-fly)
- $329,574
- Comps found
- 12
Show comp detail 12 sales within ~0.75 mi
| Address | Dist | Beds/Ba | Sqft | Sold | Price | $/sf | Match |
|---|---|---|---|---|---|---|---|
| 8342 Whisper Point Dr | 0.43mi | 3/2.0 (-1) | 2,209 (-2%) | 9mo | $325,000 | $147 | 59 |
| 8030 Oahu Ct | 0.58mi | 3/2.5 (-1) | 2,366 (+6%) | 2mo | $307,580 | $130 | 53 |
| 8338 Bo Jack Dr | 0.58mi | 4/2.5 | 2,400 (+7%) | 8mo | $375,000 | $156 | 50 |
| 8046 Lani Blue Ln | 0.56mi | 4/3.0 | 2,386 (+6%) | 16mo | $349,999 | $147 | 48 |
| 8103 Oahu Ct | 0.60mi | 4/2.5 | 2,377 (+6%) | 12mo | $359,900 | $151 | 48 |
| 8326 Bo Jack Dr | 0.61mi | 4/2.5 | 2,156 (-4%) | 19mo | $289,000 | $134 | 45 |
| 8815 Lawncliff Ln | 0.63mi | 3/2.5 (-1) | 2,139 (-5%) | 13mo | $284,990 | $133 | 43 |
| 8102 Oahu Ct | 0.58mi | 4/2.5 | 2,493 (+11%) | 9mo | $355,000 | $142 | 43 |
| 8303 Holmwood Dr | 0.70mi | 3/2.5 (-1) | 2,200 (-2%) | 15mo | $260,000 | $118 | 42 |
| 8826 Fairbloom Ln | 0.58mi | 3/2.0 (-1) | 2,093 (-7%) | 20mo | $317,000 | $151 | 34 |
| 7806 Gray Jay Ct | 0.72mi | 4/3.0 | 2,413 (+8%) | 21mo | $329,000 | $136 | 34 |
| 7926 Longshire Ln | 0.74mi | 3/2.0 (-1) | 2,010 (-10%) | 18mo | $310,000 | $154 | 22 |
Match score weights: distance 35% · size 25% · config 20% · recency 20%. Top-matched comps best support the ARV.
Projected returns pro-forma
-0.44% appreciation · 0.0% rent growth · sell at horizon
- IRR
- -0.5%
- Equity multiple
- 0.98×
- Total profit
- $-1,180
- Equity at exit
- $48,298
- IRR
- 2.8%
- Equity multiple
- 1.26×
- Total profit
- $13,003
- Equity at exit
- $54,977
Cash invested: $50,400 (down + closing). Projections, not guarantees.
Landlord ↔ Tenant lean methodology
- Overall (STATE)
- 87 Strongly Landlord-Friendly
- State Texas
- 87 Strongly Landlord-Friendly · R+5
- County
- — inherits STATE
- City
- — inherits STATE
ZIP-level market 77064
- Home prices YoY
- -0.2%
- Rents YoY
- -3.4%
- Active inventory
- 152
- Price-to-rent
- 7.1×
Monthly cashflow live
- Estimated rent
- $2,113 high interval (Pro) →
- Mortgage (P&I)
- −$944
- Tax from tax record
- −$433 /mo · $5,199/yr
- Insurance
- −$75
- HOA
- −$0
- Vacancy / Maint / Mgmt
- −$444
- Net cashflow
- $217
Break-even live
Sensitivity live
| Price | -10% $319 | -5% $268 | +0% $217 | +5% $167 | +10% $116 |
|---|---|---|---|---|---|
| Rent | -10% $50 | -5% $134 | +0% $217 | +5% $301 | +10% $384 |
| Rate | -1.0pp $308 | -0.5pp $263 | base $217 | +0.5pp $171 | +1.0pp $123 |
UW: 25.0% down · 7.5% · 30yr · 1.5% tax · 5.0% vac · 8.0% maint · 8.0% mgmt
Financing live
Cash to close
- Down payment
- $45,000
- Closing costs
- $5,400
- Reserves months
- —
- Total cash needed
- —
Loan-product check · same deal, 3 products live
Conventional
25% down · 7.5% · 30yr
- Down + closing
- —
- Monthly P&I
- —
- Monthly cashflow
- —
- DSCR
- —
- Eligible?
- —
Personal DTI + credit; lowest rate.
DSCR
20% down · 8.5% · 30yr
- Down + closing
- —
- Monthly P&I
- —
- Monthly cashflow
- —
- DSCR
- —
- Eligible?
- —
No personal income docs; deal must DSCR.
Hard money
10% down · 12.0% · 12mo
- Down + closing
- —
- Monthly P&I
- —
- Monthly cashflow
- —
- DSCR
- —
- Eligible?
- —
Short-term bridge; refi at stabilization.
Rent comps 6 comps
| Address | Beds | Baths | Sqft | Rent | $/sqft | DOM | Units | Dist |
|---|---|---|---|---|---|---|---|---|
| 8623 Parasol Ln Unit 1022079P Houston, TX | 5.0 | 2.5 | 2551 | $12,585 | $4.93 | 22d | 1 | 0.51mi |
| 8110 Oahu Ct Houston, TX | 4.0 | 2.5 | 2624 | $2,326 | $0.89 | 8d | 1 | 0.52mi |
| 7931 Evergreen Terrace Ln Houston, TX | 3.0 | 2.5 | 2684 | $2,135 | $0.80 | 45d | 1 | 0.75mi |
| 9450 Fairbanks N Houston Rd Houston, TX | 3.0 | 2.5 | 2228 | $1,800 | $0.81 | 44d | 1 | 1.09mi |
| 8206 Prairie Wind Ln Houston, TX | 4.0 | 2.5 | 1537 | $1,945 | $1.27 | 44d | 1 | 1.31mi |
| 8989 West Rd Houston, TX | 1.0–3.0 | 1.0–2.0 | 1029 | $2,044 | $1.99 | 3d | 17 | 1.42mi |
Listing history 9 events
-
2026-06-18price $180,000 Active 10 DOM
-
2026-06-18days on market $200,000 Active 10 DOM
-
2026-06-17days on market $200,000 Active 9 DOM
-
2026-06-16pricedays on market $200,000 Active 8 DOM
-
2026-06-15days on market $225,000 Active 7 DOM
-
2026-06-13days on market $225,000 Active 5 DOM
-
2026-06-13days on market $225,000 Active 4 DOM
-
2026-06-08remarks 699-char remark
-
2026-06-08$225,000 Active 1 DOM
ⓘ Source: listings_history table (triggers on properties + properties_extension) + one-shot
backfill from property_details.listing_events for pre-trigger history.
Tax reassessment forecast TX · Resets to sale price
- Current annual tax
- $5,199 · $433/mo
- Projected year-2 tax
- $5,199 · $433/mo
- Expected delta
- $0/yr ($0/mo · 0.0%)
ⓘ Screening estimate from a state-policy table — verify with the county assessor before closing.
Climate risk First Street
- Flood 6/10 Major FEMA zone X (unshaded) · 68% chance over 30 yrs
- Wildfire 1/10 Low
- Heat 9/10 Extreme 7 d/yr ≥110°F today · 23 d/yr by 30 yrs out
- Wind 9/10 Extreme 99% chance of damaging wind over 30 yrs
- Air quality 3/10 Moderate 3 unhealthy d/yr today · 4 by 30 yrs out
Nearby sold comps map
Loading sold comps map…
Walkable amenities ~0.75 mi
Loading nearby amenities…
Taxation est. · year 1
- Rental income
- $25,361
- − Mortgage interest
- −$10,083
- − Property taxes
- −$5,199
- − Insurance
- −$900
- − Repairs & maintenance
- −$2,029
- − Management
- −$2,029
- − Depreciation
- −$5,236
- Taxable loss
- −$114
- Est. tax savings @ 24.0%
- +$27
- After-tax cash flow
- $2,637/yr
For passive investors: Depreciation is non-cash, so a rental often shows a tax loss while cash-flowing — sheltering income. Rental losses are passive: they offset passive income freely, and up to $25,000/yr can offset ordinary (W-2) income if you actively participate and your MAGI is under $100k (phasing out to $0 by $150k); unused losses carry forward. On sale, claimed depreciation is recaptured at up to 25%, and gains may owe capital-gains tax (a 1031 exchange can defer both). Figures are a year-1 estimate at your 24.0% rate — not tax advice; consult a CPA.
Schools (NCES district)
- District
- Cypress-Fairbanks ISD
- NCES district ID
- 4816110
- Math proficiency
- 45% ▼ -12.00%
- Reading proficiency
- 52% ▼ -2.00%
- Median HH income
- $72,025
- Composite
- 43.63/100
- National rank
- #2968
- State rank
- #161 of 826 in TX
Livability — Houston
- Score
- 74/100
- State rank
- #184
- US rank
- #4771
Category grades
Schools grade is shown separately in the Schools card above.
Census & demographics
- County
- Harris County · 4,702,590 people
- City population
- 3,226,434
- Metro
- Houston-The Woodlands-Sugar Land, TX
- Population (ZIP)
- 49,591
- Household income
- $81,658
- Rent vs Own
- Severe rent burden
- 1589.0
Population outlook (Harris County) Hauer SSP2
- Today (2025)
- 5,571,493 people
- By 2030
- 6,089,821 · +9.3%
- By 2040
- 7,142,806 · +28.2%
- By 2050
- 8,185,864 · +46.9%
- By 2075
- 10,574,329 · +89.8%
- By 2100
- 12,109,958 · +117.4%
Race, ethnicity, and origin ACS 2023
- Neighborhood character
- Highly diverse neighborhood (Simpson 0.71)
- Race & ethnicity
- Hispanic / Latino 45% White 22% Two or more races 19% Asian 15% Black 15%
- Hispanic origin (detail)
- Mexican 30%
- Common ancestry
- Romanian 2% Lithuanian 1% Italian 1%
- Foreign-born
- 29% · Canada, Vietnam, Jamaica
- Languages at home
- 51% English-only · Spanish 35% Vietnamese 9% Other Indo-European 2%
Political lean MEDSL · Harris
- 2024 margin
- Lean D (+5.5) · D 52.0% · R 46.4% · Other 1.6%
- 2008→2024 swing
- +3.9pp toward D · 2008: 1.6pp · 2024: 5.5pp
- All cycles
- 2024: D+5.5 2020: D+13.3 2016: D+12.4 2012: D+0.1 2008: D+1.6
Not yet ingested
- Civics
- —
Market trends
- HPI YoY
- ▼ -0.44%
- Current HPI
- 238.9456
- Rent YoY
- ▼ -3.36%
- Metro
- Houston-The Woodlands-Sugar Land, TX
- State GDP YoY
- ▲ 3.95%
- F500 in state
- 110
Industry mix (Fortune 500 HQ in TX)
| Industry | F500 HQs | Revenue |
|---|---|---|
| Energy | 16 | $1,198B |
|
||
| Technology | 5 | $198B |
|
||
| Engineering / Construction | 4 | $72B |
|
||
| Energy Services | 3 | $60B |
|
||
| Utilities | 3 | $41B |
|
||
| Healthcare | 2 | $330B |
|
||
Price history
2 events — show timeline
- 2026-06-05 Listed $225,000 HARMLS
- 1988-01-02 Sold (Public Records) — Public Records
Property tax history
+3.8%/yrLatest (2025): $5,199 · -0.9% YoY. Source: county tax records.
Cash-flow waterfall
monthlySold comps — $/sqft
last 12 mo · ≤1 miLoading sold comps…