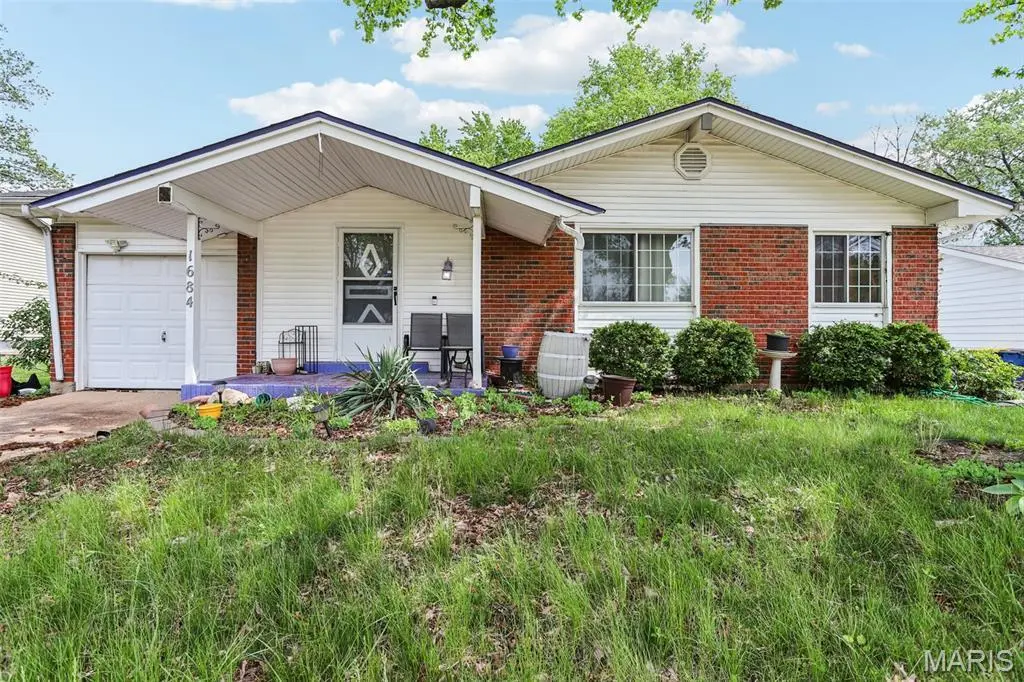
1684 Kew Gardens Dr · Old Jamestown, MO
Flood risk 1/10 · Minimal
- FEMA flood zone
- X (unshaded)
- Chance of flooding over 30 yrs
- 0.0%
- Est. flood insurance / yr
- $473 – $860
Fire risk 1/10 · Minimal
- Est. fire insurance / yr
- $1,054 – $1,958
Heat risk 5/10 · Moderate
- Hot days now (above 106°F)
- 7 days/yr
- Hot days in 30 yrs
- 21 days/yr
Wind risk 2/10 · Minimal
- Chance of severe wind over 30 yrs
- 1.0%
Air-quality risk 3/10 · Minor
- Unhealthy air days now
- 3 days/yr
- Unhealthy air days in 30 yrs
- 5 days/yr
Risk factors via First Street. Map © Google.
Why this score? — see what drove the B grade
The composite is a weighted blend of 9 inputs, each scored 0–100. Each bar is that input's sub-score; the figure is the points it added to the 100-point composite (weight × sub-score).
- Cash flow +29.4/30.0
- ARV discount +15.0/15.0
- DSCR +10.0/10.0
- 1% rule +8.4/10.0
- Rent growth +3.6/5.0
- Livability +3.3/5.0
- Condition / age +2.5/5.0
- Schools +1.7/10.0
- Appreciation +0.0/10.0
$160,000
🖨 Deal sheet (PDF) 📄 Offer letter ✓ Due diligence
Listing remarks MLS
Welcome home to a beautifully maintained and up to date 4 Bedroom home in a prime family friendly neighborhood. Open and bright floor plan with gleaming hardwood floors throughout the Living area and halls only carpet at rooms. Family room opens to a large porch that overlooks the fenced level back yard, perfect for entertaining! The 1st floor boast a wonderful family room with a cozy brick fireplace, perfect for these cold winter nights. Updated kitchen, baths, windows. This is the one that you have been searching for
Key facts
- Full basement
- 9,178 sq ft lot
- Garage
Tags
Property features AI
Finance
- HOA & community: Member of Wedgwood Green HOA; annual fee of $150 that covers grounds maintenance
Exterior
- Parking: Has garage
- Utilities: Public water; Public sewer; Electric service by Ameren; Electricity, sewer and water connected
- Home design: Single-family residence; One story
- Construction: Brick veneer exterior
- Exterior features: Front yard and back yard; Level lot
Interior
- Bedrooms: Four bedrooms on the main level
- Bathrooms: Two full bathrooms (both on the main level)
- Heating & cooling: Forced air heating; Central air conditioning
- Interior features: Fireplace (1); Basement is unfinished with a sump pump and roughed-in bathroom
Neighborhood map
What this means for you Summary
Snapshot
- This is a 4-bed/2.0-bath single-family listed at $160k.
Deal economics
- At list price, monthly cash flow is $568 ($7k/yr) — positive.
- The deal already cash-flows at list — no discount required.
- Meets the 1% rule at list price ($2k rent vs $160k).
- Cap rate 10.6% vs local median 5.2% in Old Jamestown — top-decile yield for the area; either an underpriced asset or a hidden risk that comps aren't pricing in. Stress-test before assuming the spread holds.
Location & tenants
- Location reads 66/100 on livability (#247 in MO) — a middle-class / working-renter tenant base. Strengths: employment A+, housing A+, cost of living A; Watch: amenities F, commute F, health & safety F.
- Hazelwood (suburban): math 11% / reading 26% proficiency, ranked #306 of 324 in MO (top 94%) — low school quality limits family demand, transient renter base, plan for 1-2y turnover.
- Zoned schools: Brown Elem. (math 8% / reading 22%, grade F, #982 of 1,115 statewide, top 89%, 335 students, 65% FRL); North Middle (math 16% / reading 28%, grade F, #332 of 391 statewide, top 86%, 674 students, 55% FRL); Hazelwood Central High (math 12% / reading 33%, grade F, #455 of 521 statewide, top 88%, 1,628 students, 52% FRL) — zoned schools at 57% FRL track the district average.
- Market conditions: Rents rising fast (+4.3%/yr); 273 active listings in the ZIP; 9 comparable units currently listed for rent nearby; rentals leasing fast (median 7d on market — plan ~1-2 weeks tenant-placement turnaround); 920 units permitted in St. Louis County in 2024 (250 in 5+ unit buildings).
- This rent runs 36% of the median local income ($71k/yr) — at the standard rent-burdened threshold; future hikes will face affordability resistance.
Forward outlook
- Local home prices are declining (-3.0%/yr); year-one equity from $1k of loan paydown is wiped out by about $5k of value loss. Plan a longer hold.
- At projected returns (-3.0% appreciation + 4.3% rent growth), your $45k cash investment doubles in ~8 years — after that, you're playing with house money.
Negotiation context
- Only 1 days on market — expect competitive offers; lowballing is unlikely to land.
- 2 sale attempts since 9y ago with the ask held roughly flat each time — persistent listings suggest the price (not the market) is what's stuck; bring a comps-based counter.
- Current owner paid $135k; 19% above their basis — modest negotiation headroom, anchor on the comps not their cost.
Risks & watch-outs
- Climate carrying-cost: extreme-heat days projected 7→21/yr by 2055 (HVAC capex compounding) — expect insurance premiums to compound above CPI over the hold.
Questions for the listing agent
- Built in 1967 — when were the roof, HVAC, electrical panel, plumbing, and water heater last replaced?
- What does the HOA fee cover, when was the last increase, and are there any pending special assessments or reserve-fund shortfalls?
- Is there a deadline driving the sale (1031 exchange, divorce, estate, relocation)? That informs how much negotiation room exists.
- What's the average days-on-market for RENTAL listings here right now (not sales)? A rising rental-DOM trend means longer vacancies and softer asking-rent achievability than the comps imply.
- What's the recent tenant-quality profile in this submarket — average credit score on applications, eviction rate, late-payment / NSF rate, and stable-employment percentage? A property-management company in the area should have these aggregated.
- How much new for-sale + rental construction is in the pipeline within 1–3 miles? Heavy new supply typically softens prices + rents 12–24 months out; constrained supply supports both.
Investment metrics
- 1% rule
- 1.34% ✓
- Cap rate
- 10.56%
- Cash-on-cash
- 15.22%
- DSCR
- 1.68
- GRM
- 6.2
CMA / ARV
- ARV (on-the-fly)
- $221,149
- Comps found
- 12
Show comp detail 12 sales within ~0.75 mi
| Address | Dist | Beds/Ba | Sqft | Sold | Price | $/sf | Match |
|---|---|---|---|---|---|---|---|
| 1710 Kilmory Dr | 0.10mi | 3/2.0 (-1) | 1,674 (+5%) | 4mo | $189,900 | $113 | 79 |
| 1638 Matlock Dr | 0.12mi | 3/2.0 (-1) | 1,654 (+4%) | 6mo | $229,900 | $139 | 78 |
| 1304 Kew Gardens Dr | 0.26mi | 3/2.0 (-1) | 1,700 (+7%) | 3mo | $229,900 | $135 | 69 |
| 1599 Spangler Dr | 0.35mi | 3/2.5 (-1) | 1,653 (+4%) | 1mo | $224,900 | $136 | 69 |
| 1283 Kew Gardens Dr | 0.29mi | 3/2.5 (-1) | 1,494 (-6%) | 3mo | $225,000 | $151 | 66 |
| 1703 Boardwalk Ave | 0.21mi | 3/2.0 (-1) | 1,416 (-11%) | 3mo | $195,000 | $138 | 65 |
| 3645 Woodman Dr | 0.54mi | 3/2.5 (-1) | 1,676 (+5%) | 5mo | $285,000 | $170 | 55 |
| 3463 Norberg Dr | 0.32mi | 3/2.0 (-1) | 1,767 (+11%) | 9mo | $249,900 | $141 | 54 |
| 1188 Boardwalk Ave | 0.49mi | 3/2.0 (-1) | 1,375 (-14%) | 5mo | $185,000 | $135 | 45 |
| 16787 River Stone Dr | 0.73mi | 3/2.0 (-1) | 1,745 (+10%) | 1mo | $369,000 | $211 | 44 |
| 3823 Salvation Rd | 0.72mi | 3/2.0 (-1) | 1,416 (-11%) | 1mo | $275,000 | $194 | 42 |
| 871 Liberty Village Dr | 0.75mi | 3/2.0 (-1) | 1,815 (+14%) | 6mo | $199,900 | $110 | 32 |
Match score weights: distance 35% · size 25% · config 20% · recency 20%. Top-matched comps best support the ARV.
Projected returns pro-forma
-3.0% appreciation · 4.27% rent growth · sell at horizon
- IRR
- 7.4%
- Equity multiple
- 1.29×
- Total profit
- $13,084
- Equity at exit
- $23,857
- IRR
- 17.8%
- Equity multiple
- 2.56×
- Total profit
- $69,831
- Equity at exit
- $13,834
Cash invested: $44,800 (down + closing). Projections, not guarantees.
Landlord ↔ Tenant lean methodology
- Overall (STATE)
- 81 Strongly Landlord-Friendly
- State Missouri
- 81 Strongly Landlord-Friendly · R+10
- County
- — inherits STATE
- City
- — inherits STATE
ZIP-level market 63031
- Rents YoY
- 4.3%
- Active inventory
- 273
- Price-to-rent
- 6.2×
Monthly cashflow live
- Estimated rent
- $2,139 high interval (Pro) →
- Mortgage (P&I)
- −$839
- Tax from tax record
- −$202 /mo · $2,429/yr
- Insurance
- −$67
- HOA
- −$13
- Lot rent
- −$0
- Vacancy / Maint / Mgmt
- −$449
- Net cashflow
- $568
Break-even live
Sensitivity live
| Price | -10% $659 | -5% $614 | +0% $568 | +5% $523 | +10% $478 |
|---|---|---|---|---|---|
| Rent | -10% $399 | -5% $484 | +0% $568 | +5% $653 | +10% $737 |
| Rate | -1.0pp $649 | -0.5pp $609 | base $568 | +0.5pp $527 | +1.0pp $485 |
UW: 25.0% down · 7.5% · 30yr · 1.5% tax · 5.0% vac · 8.0% maint · 8.0% mgmt
Financing live
Cash to close
- Down payment
- $40,000
- Closing costs
- $4,800
- Reserves months
- —
- Total cash needed
- —
Loan-product check · same deal, 3 products live
Conventional
25% down · 7.5% · 30yr
- Down + closing
- —
- Monthly P&I
- —
- Monthly cashflow
- —
- DSCR
- —
- Eligible?
- —
Personal DTI + credit; lowest rate.
DSCR
20% down · 8.5% · 30yr
- Down + closing
- —
- Monthly P&I
- —
- Monthly cashflow
- —
- DSCR
- —
- Eligible?
- —
No personal income docs; deal must DSCR.
Hard money
10% down · 12.0% · 12mo
- Down + closing
- —
- Monthly P&I
- —
- Monthly cashflow
- —
- DSCR
- —
- Eligible?
- —
Short-term bridge; refi at stabilization.
Rent comps 9 comps
| Address | Beds | Baths | Sqft | Rent | $/sqft | DOM | Units | Dist |
|---|---|---|---|---|---|---|---|---|
| 3145 Matlock Dr Florissant, MO | 4.0 | 2.0 | 1796 | $2,200 | $1.22 | 0d | 1 | 0.03mi |
| 3710 Woodman Dr Florissant, MO | 4.0 | 1.5 | 1802 | $2,046 | $1.14 | 0d | 1 | 0.60mi |
| 979 Dawnview Dr Florissant, MO | 5.0 | 2.0 | 1574 | $1,841 | $1.17 | 46d | 1 | 0.81mi |
| 2316 Millvalley Dr Florissant, MO | 3.0 | 3.0 | 1189 | $1,696 | $1.43 | 17d | 1 | 1.16mi |
| 2160 Splendor Dr Florissant, MO | 3.0 | 2.0 | 1100 | $1,800 | $1.64 | 5d | 1 | 1.21mi |
| 560 Bardot Dr Florissant, MO | 3.0 | 2.0 | 1976 | $1,875 | $0.95 | 1d | 1 | 1.37mi |
| 1095 Humes Ln Florissant, MO | 3.0 | 1.5 | 1100 | $1,650 | $1.50 | 6d | 1 | 1.42mi |
| 13 Cricket Ct Florissant, MO | 4.0 | 3.0 | 1560 | $2,550 | $1.63 | 46d | 1 | 1.43mi |
| 1545 Swan Dr Florissant, MO | 3.0 | 1.0 | 1064 | $1,590 | $1.49 | 10d | 1 | 1.47mi |
HOA detail
- Monthly dues
- $13 · $156/yr
Listing history 8 events
-
2026-04-29status Pending
-
2026-04-28$160,000 Active
-
2017-07-06soldstatus $135,000
-
2017-07-05soldstatus Closed 524-char remark
Show marketing remark (524 chars)
Welcome home to a beautifully maintained and up to date 4 Bedroom home in a prime family friendly neighborhood. Open and bright floor plan with gleaming hardwood floors throughout the Living area and halls only carpet at rooms. Family room opens to a large porch that overlooks the fenced level back yard, perfect for entertaining! The 1st floor boast a wonderful family room with a cozy brick fireplace, perfect for these cold winter nights. Updated kitchen, baths, windows. This is the one that you have been searching for
-
2017-05-21status Pending 524-char remark
Show marketing remark (524 chars)
Welcome home to a beautifully maintained and up to date 4 Bedroom home in a prime family friendly neighborhood. Open and bright floor plan with gleaming hardwood floors throughout the Living area and halls only carpet at rooms. Family room opens to a large porch that overlooks the fenced level back yard, perfect for entertaining! The 1st floor boast a wonderful family room with a cozy brick fireplace, perfect for these cold winter nights. Updated kitchen, baths, windows. This is the one that you have been searching for
-
2017-03-01$138,500 Active 524-char remark
Show marketing remark (524 chars)
Welcome home to a beautifully maintained and up to date 4 Bedroom home in a prime family friendly neighborhood. Open and bright floor plan with gleaming hardwood floors throughout the Living area and halls only carpet at rooms. Family room opens to a large porch that overlooks the fenced level back yard, perfect for entertaining! The 1st floor boast a wonderful family room with a cozy brick fireplace, perfect for these cold winter nights. Updated kitchen, baths, windows. This is the one that you have been searching for
-
2005-04-13soldstatus $138,500
-
2000-12-04soldstatus $100,500
ⓘ Source: listings_history table (triggers on properties + properties_extension) + one-shot
backfill from property_details.listing_events for pre-trigger history.
Tax reassessment forecast MO · Resets to sale price
- Current annual tax
- $2,429 · $202/mo
- Projected year-2 tax
- $2,429 · $202/mo
- Expected delta
- $0/yr ($0/mo · 0.0%)
ⓘ Screening estimate from a state-policy table — verify with the county assessor before closing.
Climate risk First Street
- Flood 1/10 Low FEMA zone X (unshaded) · 0% chance over 30 yrs
- Wildfire 1/10 Low
- Heat 5/10 Major 7 d/yr ≥106°F today · 21 d/yr by 30 yrs out
- Wind 2/10 Low 100% chance of damaging wind over 30 yrs
- Air quality 3/10 Moderate 3 unhealthy d/yr today · 5 by 30 yrs out
Nearby sold comps map
Loading sold comps map…
Walkable amenities ~0.75 mi
Loading nearby amenities…
Taxation est. · year 1
- Rental income
- $25,664
- − Mortgage interest
- −$8,962
- − Property taxes
- −$2,429
- − Insurance
- −$800
- − Repairs & maintenance
- −$2,053
- − Management
- −$2,053
- − HOA
- −$156
- − Depreciation
- −$4,655
- Taxable income
- $4,556
- Est. tax owed @ 24.0%
- −$1,093
- After-tax cash flow
- $5,727/yr
For passive investors: Depreciation is non-cash, so a rental often shows a tax loss while cash-flowing — sheltering income. Rental losses are passive: they offset passive income freely, and up to $25,000/yr can offset ordinary (W-2) income if you actively participate and your MAGI is under $100k (phasing out to $0 by $150k); unused losses carry forward. On sale, claimed depreciation is recaptured at up to 25%, and gains may owe capital-gains tax (a 1031 exchange can defer both). Figures are a year-1 estimate at your 24.0% rate — not tax advice; consult a CPA.
Schools (NCES district)
- District
- Hazelwood
- NCES district ID
- 2913830
- Math proficiency
- 11% ▼ -13.00%
- Reading proficiency
- 26% ▼ -6.00%
- Median HH income
- $51,621
- Composite
- 16.77/100
- National rank
- #9156
- State rank
- #306 of 324 in MO
Livability — Old Jamestown
- Score
- 66/100
- State rank
- #247
- US rank
- #12156
Category grades
Schools grade is shown separately in the Schools card above.
Census & demographics
- County
- Saint Louis County · 888,823 people
- City population
- 19,557
- Metro
- St. Louis, MO-IL
- Population (ZIP)
- 50,196
- Household income
- $70,811
- Rent vs Own
- Severe rent burden
- 1279.0
Population outlook (St. Louis County) Hauer SSP2
- Today (2025)
- 1,025,227 people
- By 2030
- 1,028,023 · +0.3%
- By 2040
- 1,020,940 · -0.4%
- By 2050
- 1,007,280 · -1.8%
- By 2075
- 987,277 · -3.7%
- By 2100
- 921,984 · -10.1%
Race, ethnicity, and origin ACS 2023
- Neighborhood character
- Diverse neighborhood (Simpson 0.58)
- Race & ethnicity
- White 49% Black 41% Two or more races 7% Hispanic / Latino 2%
- Common ancestry
- Romanian 3% Lithuanian 3% Swedish 1%
- Foreign-born
- 5% · Canada, Jamaica
- Languages at home
- 94% English-only · Spanish 2% Arabic 1%
Political lean MEDSL · St. Louis
- 2024 margin
- Strong D (+23.4) · D 60.8% · R 37.4% · Other 1.7%
- 2008→2024 swing
- +3.5pp toward D · 2008: 19.9pp · 2024: 23.4pp
- All cycles
- 2024: D+23.4 2020: D+24.0 2016: D+16.2 2012: D+13.7 2008: D+19.9
Not yet ingested
- Civics
- —
Market trends
- HPI YoY
- ▼ -223.57%
- Current HPI
- 202.7192
- Rent YoY
- ▲ 4.27%
- Metro
- St. Louis, MO-IL
- State GDP YoY
- ▲ 1.84%
- F500 in state
- 20
Industry mix (Fortune 500 HQ in MO)
| Industry | F500 HQs | Revenue |
|---|---|---|
| Healthcare | 1 | $163B |
|
||
| Insurance | 1 | $21B |
|
||
| Industrial Technology | 1 | $17B |
|
||
| Retail | 1 | $16B |
|
||
| Industrial Distribution | 1 | $10B |
|
||
| Utilities | 1 | $9B |
|
||
Price history
+59.2% since first listed8 events — show timeline
- 2026-04-29 Pending — MARIS as Distributed by MLS Grid
- 2026-04-28 Listed $160,000 MARIS as Distributed by MLS Grid
- 2017-07-06 Sold (Public Records) $135,000 Public Records
- 2017-07-05 Sold (MLS) — MARIS as Distributed by MLS Grid
- 2017-05-21 Pending — MARIS as Distributed by MLS Grid
- 2017-03-01 Listed $138,500 MARIS as Distributed by MLS Grid
- 2005-04-13 Sold (Public Records) $138,500 Public Records
- 2000-12-04 Sold (Public Records) $100,500 Public Records
Property tax history
+2.0%/yrLatest (2022): $2,429 · +1.5% YoY. Source: county tax records.
Cash-flow waterfall
monthlySold comps — $/sqft
last 12 mo · ≤1 miLoading sold comps…