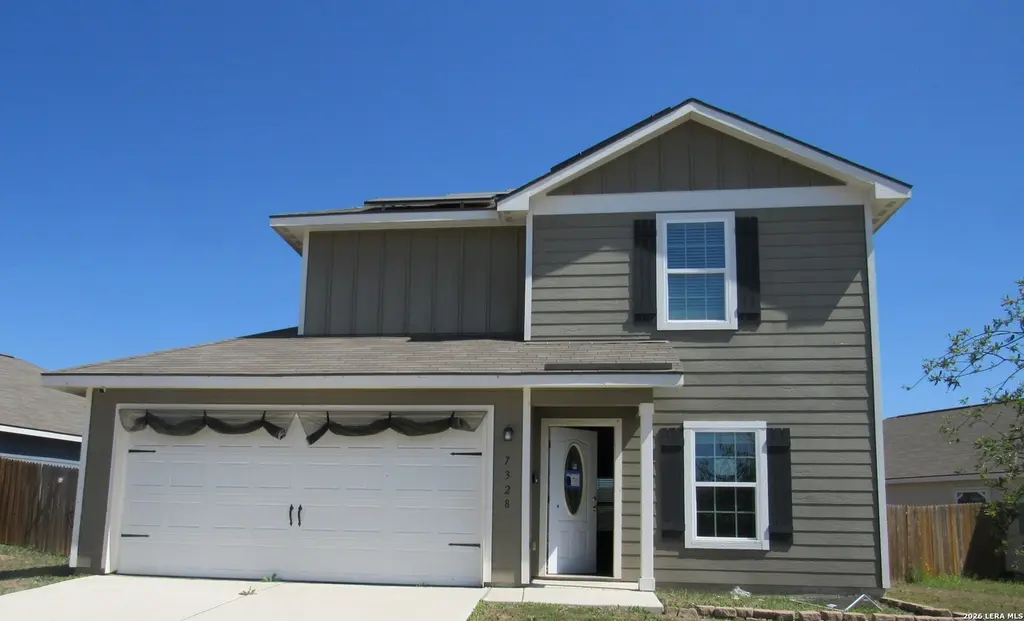
7328 Aaron Jordan Dr · San Antonio, TX
Flood risk 1/10 · Minimal
- FEMA flood zone
- X (unshaded)
- Chance of flooding over 30 yrs
- 0.0%
- Est. flood insurance / yr
- $507 – $1,088
Fire risk 2/10 · Minimal
- Est. fire insurance / yr
- $1,222 – $2,270
Heat risk 8/10 · Major
- Hot days now (above 109°F)
- 7 days/yr
- Hot days in 30 yrs
- 22 days/yr
Wind risk 8/10 · Major
- Chance of severe wind over 30 yrs
- 80.0%
Air-quality risk 2/10 · Minimal
- Unhealthy air days now
- 1 days/yr
- Unhealthy air days in 30 yrs
- 1 days/yr
Risk factors via First Street. Map © Google.
Why this score? — see what drove the D- grade
The composite is a weighted blend of 9 inputs, each scored 0–100. Each bar is that input's sub-score; the figure is the points it added to the 100-point composite (weight × sub-score).
- Cash flow +8.7/30.0
- ARV discount +6.3/15.0
- Appreciation +5.0/10.0
- Schools +4.4/10.0
- Livability +4.0/5.0
- Condition / age +2.5/5.0
- DSCR +2.4/10.0
- 1% rule +2.3/10.0
- Rent growth +2.1/5.0
$229,900
🖨 Deal sheet 📄 Offer letter ✓ Due diligence
Listing remarks
This inviting home in Luckey Ranch combines modern comfort, energy efficiency, and unbeatable convenience. Featuring SOLAR PANELS, this property offers long-term savings and ecofriendly living. Step inside to an open-concept floor plan with granite countertops throughout. A layout that flows effortlessly with Home office down for convivence. Upstairs, the spacious primary suite includes a large walk-in closet, accompanied by two additional bedrooms and a conveniently located utility room. Enjoy outdoor living on the large covered patio, complete with a storage shed A 2-car garage adds even more functionality.
Key facts
- Storage shed
- Large covered patio
- Solar panels
Tags
Property features AI
Finance
- Other: Subdivision: Luckey Ranch
- HOA & community: Mandatory HOA; HOA dues $480 annually; Association transfer fee $275
Exterior
- Parking: 2-car garage
- Utilities: City water; City sewer
- Home design: Pre-owned single-family home; Approximately 4 years old; Slab entry (single level entry)
- Construction: Siding exterior; Composition roof; Slab foundation; Built about 4 years ago
- Exterior features: Community pool; Park/playground; Jogging trails; Lot in Luckey Ranch subdivision
Interior
- Kitchen: Kitchen — 14 x 11
- Bedrooms: Master bedroom (upper level) — 16 x 12; Bedroom 2 — 13 x 9; Bedroom 3 — 10 x 9
- Flooring: Carpeting; Laminate flooring
- Bathrooms: 2 full bathrooms and 1 half bathroom; Master bath with tub/shower combination — 9 x 8
- Heating & cooling: Central heating (electric); Central air conditioning
- Interior features: Ceiling fans; Living/dining room combination; Study/library; One living area
Neighborhood map
What this means for you Summary
Snapshot
- This is a 3-bed/2.5-bath single-family listed at $230k.
Deal economics
- At list price, monthly cash flow is $-193 ($-2k/yr) — negative.
- To cash-flow at today's rent, offer at most $196k (14.9% below list).
- To meet the 1% rule (rent ≥ 1% of price), the offer needs to be $168k (26.8% below list).
- Recommended offer: $168k (26.8% below list) — sets the bar for 1% rule.
- Cap rate 5.3% vs local median 3.8% in San Antonio — top-decile yield for the area; either an underpriced asset or a hidden risk that comps aren't pricing in. Stress-test before assuming the spread holds.
Location & tenants
- Location reads 80/100 on livability (#31 in TX, #1,616 nationally) — a professional / high-income tenant draw. Strengths: amenities A+, commute A+, cost of living A+; Watch: schools C-, crime F.
- Medina Valley ISD (rural): math 48% / reading 53% proficiency, ranked #148 of 826 in TX (top 18%) — acceptable for families but not a draw, mixed tenant base, ~2y average lease.
- Market conditions: Rents soft (-1.7%/yr); 537 active listings in the ZIP; 40 comparable units currently listed for rent nearby; rentals at typical pace (median 24d on market — plan ~3-4 weeks tenant-placement turnaround); 42% of comp listings sitting > 30 days — soft ceiling on asking rent; solid renter incomes; 8,308 units permitted in Bexar County in 2024 (2,506 in 5+ unit buildings).
Forward outlook
- In year one you build about $2k of equity ($2k loan paydown + $-4 appreciation (-0.0% local appreciation)).
- Bexar County population projected at +50% by 2050 — long-run rental-demand tailwind backs the buy-and-hold thesis.
Negotiation context
- It's been on market 30 days — a 2% lower offer ($226k) is reasonable based on typical stale-listing flexibility.
- 10 sale attempts since 4y ago with the ask held roughly flat each time — persistent listings suggest the price (not the market) is what's stuck; bring a comps-based counter.
Risks & watch-outs
- Climate carrying-cost: severe wind risk, 80% chance of damaging wind over 30y; extreme-heat days projected 7→22/yr by 2055 (HVAC capex compounding) — expect insurance premiums to compound above CPI over the hold.
Questions for the listing agent
- What do current leases actually rent for vs. the listed asking? Can we see a recent rent roll and the last 12 months of T-12 income?
- What does the HOA fee cover, when was the last increase, and are there any pending special assessments or reserve-fund shortfalls?
- Is there a deadline driving the sale (1031 exchange, divorce, estate, relocation)? That informs how much negotiation room exists.
- Crime grade is F in this area — have there been break-ins, vandalism, or insurance claims at this property in the last 3 years? What carrier currently insures it and at what premium?
- The area grade is low — what's the realistic commute time and amenity access for the typical tenant pool here? Any planned neighborhood developments (good or bad) we should know about?
- What's the average days-on-market for RENTAL listings here right now (not sales)? A rising rental-DOM trend means longer vacancies and softer asking-rent achievability than the comps imply.
- What's the recent tenant-quality profile in this submarket — average credit score on applications, eviction rate, late-payment / NSF rate, and stable-employment percentage? A property-management company in the area should have these aggregated.
- How much new for-sale + rental construction is in the pipeline within 1–3 miles? Heavy new supply typically softens prices + rents 12–24 months out; constrained supply supports both.
Investment metrics
- 1% rule
- 0.73% ✗
- Cap rate
- 5.28%
- Cash-on-cash
- -3.61%
- DSCR
- 0.84
- GRM
- 11.4
CMA / ARV
- ARV (on-the-fly)
- $224,130
- Comps found
- 12
Show comp detail 12 sales within ~0.75 mi
| Address | Dist | Beds/Ba | Sqft | Sold | Price | $/sf | Match |
|---|---|---|---|---|---|---|---|
| 7318 Calypso Cyn | 0.20mi | 3/2.0 | 1,516 (+5%) | 3mo | $280,000 | $185 | 78 |
| 12255 Stratsburg | 0.29mi | 3/2.0 | 1,404 (-3%) | 3mo | $217,999 | $155 | 77 |
| 11920 Stroud Dr | 0.32mi | 3/2.0 | 1,525 (+6%) | 3mo | $289,900 | $190 | 72 |
| 6935 Luckey | 0.43mi | 3/2.0 | 1,404 (-3%) | 3mo | $239,990 | $171 | 71 |
| 12254 Stratsburg | 0.29mi | 3/2.0 | 1,562 (+8%) | 1mo | $218,000 | $140 | 70 |
| 6507 Chevler | 0.67mi | 3/2.5 | 1,477 (+2%) | 0mo | $214,900 | $145 | 65 |
| 6512 Sabinal | 0.62mi | 3/2.0 | 1,477 (+2%) | 1mo | $210,000 | $142 | 65 |
| 12318 Carlson Vly | 0.66mi | 3/2.5 | 1,417 (-2%) | 3mo | $224,000 | $158 | 64 |
| 11620 Claudette | 0.41mi | 3/2.5 | 1,300 (-10%) | 2mo | $197,899 | $152 | 62 |
| 12355 Mahoney Ml | 0.51mi | 3/2.5 | 1,290 (-11%) | 0mo | $197,000 | $153 | 58 |
| 12323 Commander Dr | 0.58mi | 3/2.5 | 1,290 (-11%) | 1mo | $205,000 | $159 | 54 |
| 11423 Luckey Ledge | 0.70mi | 3/2.0 | 1,562 (+8%) | 1mo | $224,000 | $143 | 51 |
Match score weights: distance 35% · size 25% · config 20% · recency 20%. Top-matched comps best support the ARV.
Projected returns pro-forma
-0.0% appreciation · 0.0% rent growth · sell at horizon
- IRR
- -8.1%
- Equity multiple
- 0.63×
- Total profit
- $-24,012
- Equity at exit
- $66,735
- IRR
- -4.0%
- Equity multiple
- 0.60×
- Total profit
- $-25,753
- Equity at exit
- $80,202
Cash invested: $64,372 (down + closing). Projections, not guarantees.
Landlord ↔ Tenant lean methodology
- Overall (STATE)
- 87 Strongly Landlord-Friendly
- State Texas
- 87 Strongly Landlord-Friendly · R+5
- County
- — inherits STATE
- City
- — inherits STATE
ZIP-level market 78252
- Home prices YoY
- -0.0%
- Rents YoY
- -1.7%
- Active inventory
- 537
- Price-to-rent
- 11.4×
Monthly cashflow live
- Estimated rent
- $1,683 high interval (Pro) →
- Mortgage (P&I)
- −$1,206
- Tax from tax record
- −$181 /mo · $2,175/yr
- Insurance
- −$96
- HOA
- −$40
- Vacancy / Maint / Mgmt
- −$353
- Net cashflow
- $-193
Break-even live
UW: 25.0% down · 7.5% · 30yr · 1.5% tax · 5.0% vac · 8.0% maint · 8.0% mgmt
Financing live
Cash to close
- Down payment
- $57,475
- Closing costs
- $6,897
- Reserves months
- —
- Total cash needed
- —
Loan-product check · same deal, 3 products live
Conventional
25% down · 7.5% · 30yr
- Down + closing
- —
- Monthly P&I
- —
- Monthly cashflow
- —
- DSCR
- —
- Eligible?
- —
Personal DTI + credit; lowest rate.
DSCR
20% down · 8.5% · 30yr
- Down + closing
- —
- Monthly P&I
- —
- Monthly cashflow
- —
- DSCR
- —
- Eligible?
- —
No personal income docs; deal must DSCR.
Hard money
10% down · 12.0% · 12mo
- Down + closing
- —
- Monthly P&I
- —
- Monthly cashflow
- —
- DSCR
- —
- Eligible?
- —
Short-term bridge; refi at stabilization.
Rent comps 40 comps
| Address | Beds | Baths | Sqft | Rent | $/sqft | DOM | Units | Dist |
|---|---|---|---|---|---|---|---|---|
| 7247 Calypso Cyn San Antonio, TX | 3.0 | 2.5 | 1446 | $1,550 | $1.07 | 24d | 1 | 0.11mi |
| 12118 Stratsburg San Antonio, TX | 3.0 | 2.0 | 1597 | $1,750 | $1.10 | 44d | 1 | 0.15mi |
| 11922 Lake Parker San Antonio, TX | 3.0 | 2.5 | 1428 | $3,500 | $2.45 | 2d | 1 | 0.15mi |
| 7318 Calypso Cyn San Antonio, TX | 3.0 | 2.0 | 1516 | $1,575 | $1.04 | 44d | 1 | 0.17mi |
| 7318 Sharma Vly San Antonio, TX | 3.0 | 2.5 | 1428 | $1,395 | $0.98 | 24d | 1 | 0.21mi |
| 12014 Latour Vly San Antonio, TX | 3.0 | 2.5 | 1428 | $1,469 | $1.03 | 3d | 1 | 0.24mi |
| 7318 Anchor Cyn San Antonio, TX | 3.0 | 2.0 | 1525 | $1,495 | $0.98 | 15d | 1 | 0.26mi |
| 11803 Claudette St San Antonio, TX | 3.0 | 2.5 | 1420 | $1,595 | $1.12 | 44d | 1 | 0.29mi |
| 11934 Luckey Villa San Antonio, TX | 2.0 | 2.0 | 996 | $1,500 | $1.51 | 20d | 1 | 0.30mi |
| 12251 Siragusa San Antonio, TX | 4.0 | 2.0 | 1822 | $2,050 | $1.13 | 3d | 1 | 0.31mi |
| 11753 Alcoser Ct San Antonio, TX | 4.0 | 2.0 | 1792 | $1,589 | $0.89 | 22d | 1 | 0.32mi |
| 11742 Davalos Ln San Antonio, TX | 3.0 | 2.0 | 1525 | $1,600 | $1.05 | 44d | 1 | 0.35mi |
| 11737 Davalos Ln San Antonio, TX | 3.0 | 2.0 | 1514 | $1,625 | $1.07 | 44d | 1 | 0.39mi |
| 7551 Bowdre San Antonio, TX | 3.0 | 2.5 | 1209 | $1,650 | $1.36 | 24d | 1 | 0.40mi |
| 12324 Claiborne San Antonio, TX | 3.0 | 2.0 | 1404 | $1,445 | $1.03 | 44d | 1 | 0.40mi |
| 7322 Bowdre San Antonio, TX | 3.0 | 2.5 | 1381 | $1,600 | $1.16 | 44d | 1 | 0.41mi |
| 6843 Luckey Path San Antonio, TX | 3.0 | 2.0 | 1404 | $1,450 | $1.03 | 44d | 1 | 0.41mi |
| 6747 Sabinal San Antonio, TX | 3.0 | 2.5 | 1455 | $1,395 | $0.96 | 22d | 1 | 0.43mi |
| 6747 Sabinal San Antonio, TX | 3.0 | 2.5 | 1455 | $1,395 | $0.96 | 3d | 1 | 0.43mi |
| 11806 Luckey Flower San Antonio, TX | 3.0 | 2.0 | 1188 | $1,495 | $1.26 | 24d | 1 | 0.56mi |
| 12118 Luckey Vw San Antonio, TX | 3.0 | 2.0 | 1404 | $1,545 | $1.10 | 44d | 1 | 0.57mi |
| 12119 Luckey Vw San Antonio, TX | 3.0 | 2.5 | 1652 | $1,595 | $0.97 | 2d | 1 | 0.57mi |
| 6550 Fledgely Way San Antonio, TX | 3.0 | 2.0 | 1562 | $1,700 | $1.09 | 44d | 1 | 0.60mi |
| 7007 Calle Aleman San Antonio, TX | 2.0 | 2.0 | 1000 | $1,050 | $1.05 | 44d | 1 | 0.61mi |
| 7007 Calle Aleman San Antonio, TX | 2.0 | 2.0 | 1000 | $850 | $0.85 | 24d | 1 | 0.61mi |
| 6528 Dodger Vly San Antonio, TX | 4.0 | 2.0 | 1822 | $1,800 | $0.99 | 44d | 1 | 0.62mi |
| 6519 Luckey Sq San Antonio, TX | 3.0 | 2.0 | 1404 | $1,550 | $1.10 | 4d | 1 | 0.65mi |
| 6528 Chevler Pass San Antonio, TX | 3.0 | 2.0 | 1455 | $1,345 | $0.92 | 44d | 1 | 0.65mi |
| 11543 Luckey Ledge San Antonio, TX | 4.0 | 2.0 | 1793 | $1,615 | $0.90 | 44d | 1 | 0.72mi |
| 6525 Underwood Way San Antonio, TX | 3.0 | 2.5 | 1525 | $1,649 | $1.08 | 24d | 1 | 0.73mi |
| 11803 Luckey Vis San Antonio, TX | 3.0 | 2.5 | 1778 | $1,826 | $1.03 | 4d | 1 | 0.75mi |
| 10829 Emerick St San Antonio, TX | 3.0 | 2.5 | 1344 | $1,700 | $1.26 | 24d | 1 | 1.00mi |
| 10834 Quinn Ct San Antonio, TX | 3.0 | 2.5 | 1344 | $1,800 | $1.34 | 44d | 1 | 1.03mi |
| 10858 Quinn Ct San Antonio, TX | 2.0–5.0 | 2.0–3.5 | 1733 | $2,067 | $1.19 | 2d | 1 | 1.04mi |
| 12136 W US Highway 90 San Antonio, TX | 2.0 | 1.0–2.0 | 867 | $1,580 | $1.82 | 2d | 21 | 1.08mi |
| 12136 U.S. 90 Unit 710 San Antonio, TX | 2.0 | 2.0 | 967 | $1,658 | $1.71 | 3d | 1 | 1.09mi |
| 11347 Buck Cyn San Antonio, TX | 3.0 | 2.5 | 1572 | $1,650 | $1.05 | 44d | 1 | 1.33mi |
| 6175 Texas Cyn San Antonio, TX | 1.0–4.0 | 1.0–2.0 | 1056 | $1,357 | $1.28 | 24d | 1 | 1.37mi |
| 6023 Macdona Rdg San Antonio, TX | 4.0 | 2.0 | 1474 | $1,695 | $1.15 | 44d | 1 | 1.39mi |
| 12127 Straus Medina San Antonio, TX | 3.0 | 2.0 | 1451 | $1,775 | $1.22 | 2d | 1 | 1.40mi |
HOA detail
- Monthly dues
- $40 · $480/yr
Listing history 36 events
-
2026-06-18days on market $229,900 Active 30 DOM
-
2026-06-17days on market $229,900 Active 29 DOM
-
2026-06-16days on market $229,900 Active 28 DOM
-
2026-06-15days on market $229,900 Active 27 DOM
-
2026-06-13days on market $229,900 Active 25 DOM
-
2026-06-09days on market $229,900 Active 21 DOM
-
2026-06-08days on market $229,900 Active 20 DOM
-
2026-06-07days on market $229,900 Active 19 DOM
-
2026-06-04days on market $229,900 Active 16 DOM
-
2026-06-03days on market $229,900 Active 15 DOM
-
2026-06-02days on market $229,900 Active 14 DOM
-
2026-06-01days on market $229,900 Active 13 DOM
-
2026-05-31days on market $229,900 Active 12 DOM
-
2026-05-19$229,900 New
-
2025-11-06historical
-
2025-10-24status Active
-
2025-09-15status Pending
-
2025-09-03status Active
-
2025-08-29historical
-
2025-08-04$199,000 Active
-
2025-04-18historical
-
2025-01-17$285,000 New
-
2022-06-14soldstatus Sold
-
2022-05-12price $299,900
-
2022-05-12status Back on Market
-
2022-04-27historical
-
2022-03-29price $298,900
-
2022-03-28status Back on Market
-
2022-03-23price $293,900
-
2022-03-23status Pending
-
2022-03-23status Back on Market
-
2022-03-17status Pending
-
2022-02-26price $290,900
-
2022-02-25status Back on Market
-
2022-02-18status Pending
-
2022-02-07$288,900 New
ⓘ Source: listings_history table (triggers on properties + properties_extension) + one-shot
backfill from property_details.listing_events for pre-trigger history.
Tax reassessment forecast TX · Resets to sale price
- Current annual tax
- $2,175 · $181/mo
- Projected year-2 tax
- $4,207 · $351/mo
- Expected delta
- +$2,032/yr (+$169/mo · 93.5%)
ⓘ Screening estimate from a state-policy table — verify with the county assessor before closing.
Climate risk First Street
- Flood 1/10 Low FEMA zone X (unshaded) · 0% chance over 30 yrs
- Wildfire 2/10 Low
- Heat 8/10 Severe 7 d/yr ≥109°F today · 22 d/yr by 30 yrs out
- Wind 8/10 Severe 80% chance of damaging wind over 30 yrs
- Air quality 2/10 Low 1 unhealthy d/yr today · 1 by 30 yrs out
Nearby sold comps map
Loading sold comps map…
Walkable amenities ~0.75 mi
Loading nearby amenities…
Taxation est. · year 1
- Rental income
- $20,190
- − Mortgage interest
- −$12,878
- − Property taxes
- −$2,175
- − Insurance
- −$1,150
- − Repairs & maintenance
- −$1,615
- − Management
- −$1,615
- − HOA
- −$480
- − Depreciation
- −$6,688
- Taxable loss
- −$6,410
- Est. tax savings @ 24.0%
- +$1,539
- After-tax cash flow
- $-783/yr
For passive investors: Depreciation is non-cash, so a rental often shows a tax loss while cash-flowing — sheltering income. Rental losses are passive: they offset passive income freely, and up to $25,000/yr can offset ordinary (W-2) income if you actively participate and your MAGI is under $100k (phasing out to $0 by $150k); unused losses carry forward. On sale, claimed depreciation is recaptured at up to 25%, and gains may owe capital-gains tax (a 1031 exchange can defer both). Figures are a year-1 estimate at your 24.0% rate — not tax advice; consult a CPA.
Schools (NCES district)
- District
- Medina Valley ISD
- NCES district ID
- 4830060
- Math proficiency
- 48% ▼ -9.00%
- Reading proficiency
- 53% ▼ -2.00%
- Median HH income
- $60,596
- Composite
- 44.2/100
- National rank
- #2851
- State rank
- #148 of 826 in TX
Livability — San Antonio
- Score
- 80/100
- State rank
- #31
- US rank
- #1616
Category grades
Schools grade is shown separately in the Schools card above.
Census & demographics
- County
- Bexar County · 1,990,555 people
- City population
- 1,806,925
- Metro
- San Antonio-New Braunfels, TX
- Population (ZIP)
- 21,790
- Household income
- $85,518
- Rent vs Own
- Severe rent burden
- 152.0
Population outlook (Bexar County) Hauer SSP2
- Today (2025)
- 2,336,851 people
- By 2030
- 2,560,728 · +9.6%
- By 2040
- 3,020,569 · +29.3%
- By 2050
- 3,493,522 · +49.5%
- By 2075
- 4,668,459 · +99.8%
- By 2100
- 5,533,242 · +136.8%
Race, ethnicity, and origin ACS 2023
- Neighborhood character
- Predominantly Hispanic (68%)
- Race & ethnicity
- Hispanic / Latino 68% Two or more races 29% White 17% Black 8% Asian 3% Native American 1%
- Hispanic origin (detail)
- Mexican 61% Puerto Rican 1%
- Common ancestry
- Hispanic 2% Lithuanian 1% German 1%
- Foreign-born
- 12% · Canada, South Korea
- Languages at home
- 58% English-only · Spanish 38% Tagalog/Filipino 2% Other Indo-European 1%
Political lean MEDSL · Bexar
- 2024 margin
- Lean D (+9.8) · D 54.3% · R 44.6% · Other 1.1%
- 2008→2024 swing
- +4.2pp toward D · 2008: 5.6pp · 2024: 9.8pp
- All cycles
- 2024: D+9.8 2020: D+18.2 2016: D+13.5 2012: D+4.6 2008: D+5.6
Not yet ingested
- Civics
- —
Market trends
- HPI YoY
- ▬ -0.00%
- Current HPI
- 183.6413
- Rent YoY
- ▼ -1.67%
- Metro
- San Antonio-New Braunfels, TX
- State GDP YoY
- ▲ 3.95%
- F500 in state
- 110
Industry mix (Fortune 500 HQ in TX)
| Industry | F500 HQs | Revenue |
|---|---|---|
| Energy | 16 | $1,198B |
|
||
| Technology | 5 | $198B |
|
||
| Engineering / Construction | 4 | $72B |
|
||
| Energy Services | 3 | $60B |
|
||
| Utilities | 3 | $41B |
|
||
| Healthcare | 2 | $330B |
|
||
Price history
-20.4% since first listed23 events — show timeline
- 2026-05-19 Listed $229,900 LERA
- 2025-11-06 Listing Removed — HARMLS
- 2025-10-24 Relisted — HARMLS
- 2025-09-15 Pending — HARMLS
- 2025-09-03 Relisted — HARMLS
- 2025-08-29 Listing Removed — HARMLS
- 2025-08-04 Listed $199,000 HARMLS
- 2025-04-18 Listing Removed — LERA
- 2025-01-17 Listed $285,000 LERA
- 2022-06-14 Sold (MLS) — LERA
- 2022-05-12 Price Changed $299,900 LERA
- 2022-05-12 Relisted — LERA
- 2022-04-27 Listing Removed — LERA
- 2022-03-29 Price Changed $298,900 LERA
- 2022-03-28 Relisted — LERA
- 2022-03-23 Price Changed $293,900 LERA
- 2022-03-23 Pending — LERA
- 2022-03-23 Relisted — LERA
- 2022-03-17 Pending — LERA
- 2022-02-26 Price Changed $290,900 LERA
- 2022-02-25 Relisted — LERA
- 2022-02-18 Pending — LERA
- 2022-02-07 Listed $288,900 LERA
Property tax history
+36.1%/yrLatest (2025): $2,175 · -56.9% YoY. Source: county tax records.
Cash-flow waterfall
monthlySold comps — $/sqft
last 12 mo · ≤1 miLoading sold comps…