 🏷️ Likely Rental
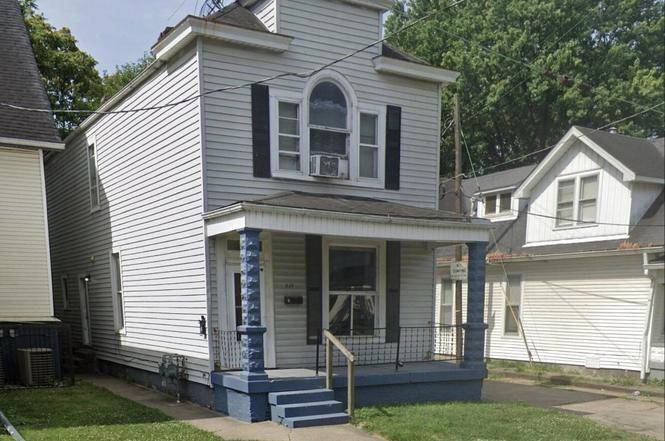
414 M St · Louisville, KY
Flood risk 1/10 · Minimal
- FEMA flood zone
- X (unshaded)
- Chance of flooding over 30 yrs
- 0.0%
- Est. flood insurance / yr
- $507 – $1,088
Fire risk 1/10 · Minimal
- Est. fire insurance / yr
- $839 – $1,559
Heat risk 5/10 · Moderate
- Hot days now (above 105°F)
- 7 days/yr
- Hot days in 30 yrs
- 20 days/yr
Wind risk 2/10 · Minimal
- Chance of severe wind over 30 yrs
- 1.0%
Air-quality risk 2/10 · Minimal
- Unhealthy air days now
- 1 days/yr
- Unhealthy air days in 30 yrs
- 3 days/yr
Risk factors via First Street. Map © Google.
Why this score? — see what drove the B+ grade
The composite is a weighted blend of 9 inputs, each scored 0–100. Each bar is that input's sub-score; the figure is the points it added to the 100-point composite (weight × sub-score).
- Cash flow +30.0/30.0
- ARV discount +15.0/15.0
- 1% rule +10.0/10.0
- DSCR +10.0/10.0
- Rent growth +4.0/5.0
- Livability +3.2/5.0
- Condition / age +2.5/5.0
- Schools +2.3/10.0
- Appreciation +0.0/10.0
$119,000
🖨 Deal sheet 📄 Offer letter ✓ Due diligence
Multi-family units
County records classify this as Multi-Family (2-4 Unit). Listing-text estimate: 1 unit. estimate disagrees with records
Listing remarks
REAL ESTATE AUCTION - C2 zoned Duplex | Student | STR/Airbnb Play - Near UofL and Churchill Downs. Online bidding at: InvestThroughAuction.com | Opens: April 2 at 9:00 AM | Closes: April 9 at 4:00 PM ET Great Auction Opportunity! Sells to the highest bidder at or above $119,000. Located at 414 M Street, this approximately 1,998-square-foot residential duplex on a 0.05-acre lot offers strong income-producing potential near the fast-growing University of Louisville and Churchill Downs corridor. The property provides two units: the 2nd fl 1-bed, 1-bath unit is currently occupied at $750/month, while the 1st fl 2-bed, 1-bath unit is vacant and was previously rented for $900/mo, with total marke
Key facts
- Manageable lot size
- Multi unit layout
- 2,574 sq ft lot
Tags
Property features AI
Finance
- Other: Located in South Louisville near Churchill Downs
- HOA & community: No association fee
Exterior
- Utilities: Electricity connected
- Home design: Contemporary style; Residential property (subtype: Auction); 2 stories; Built in 1900; Shingle roof; Vinyl siding
- Construction: Vinyl siding construction; Shingle roof; Year built: 1900; Above-grade finished area listed as 1,998
- Exterior features: Corner lot; Lot approximately 0.06 acres
Interior
- Kitchen: Kitchen on the first floor; Second-floor kitchen (upper unit or separate area)
- Bedrooms: 4 bedrooms total; Two bedrooms on the first floor; Two bedrooms on the second floor
- Bathrooms: 2 full bathrooms; No half bathrooms
- Heating & cooling: Natural gas heating; Central air; Wall/window AC unit(s); One HVAC unit
- Interior features: No basement; 8 main rooms (10 total rooms); First-floor primary bedroom; First-floor laundry; No fireplaces
- Laundry & utility: Laundry on the first floor
Neighborhood map
What this means for you Summary
Snapshot
- This is a 4-bed/2.0-bath multifamily listed at $119k.
Deal economics
- At list price, monthly cash flow is $858 ($10k/yr) — positive.
- The deal already cash-flows at list — no discount required.
- Meets the 1% rule at list price ($2k rent vs $119k).
- Recommended offer: $115k (3.0% below list) — sets the bar for market timing.
- Cap rate 14.9% vs local median 5.0% in Louisville — top-decile yield for the area; either an underpriced asset or a hidden risk that comps aren't pricing in. Stress-test before assuming the spread holds.
Location & tenants
- Location reads 63/100 on livability (#333 in KY) — a middle-class / working-renter tenant base. Strengths: cost of living A+, housing A+; Watch: employment C-, health & safety D+, schools D-.
- Jefferson County (urban): math 19% / reading 35% proficiency, ranked #121 of 165 in KY (top 73%) — low school quality limits family demand, transient renter base, plan for 1-2y turnover.
- Market conditions: Rents rising fast (+6.1%/yr); 77 active listings in the ZIP; 21 comparable units currently listed for rent nearby; rentals at typical pace (median 16d on market — plan ~3-4 weeks tenant-placement turnaround); lower-income renter base — watch delinquency; 2,836 units permitted in Jefferson County in 2024 (1,558 in 5+ unit buildings).
- At $2,135/mo this rent would consume 65% of the median local household income ($40k/yr) (locally 1136% of renters already pay >50% of income on rent) — very limited rent-growth headroom before tenants either downsize or default.
Forward outlook
- Local home prices are declining (-3.0%/yr); year-one equity from $823 of loan paydown is wiped out by about $4k of value loss. Plan a longer hold.
- Jefferson County population projected at +13% by 2050 — modest demand growth; plan on rents tracking national, not racing it.
- At projected returns (-3.0% appreciation + 6.1% rent growth), your $33k cash investment doubles in ~4 years — after that, you're playing with house money.
Negotiation context
- It's been on market 59 days — a 3% lower offer ($115k) is reasonable based on typical stale-listing flexibility.
- 18 sale attempts since 20y ago with the ask held roughly flat each time — persistent listings suggest the price (not the market) is what's stuck; bring a comps-based counter.
Risks & watch-outs
- Watch-outs: built in 1900 — expect roof / HVAC / electrical / plumbing capex.
- Climate carrying-cost: extreme-heat days projected 7→20/yr by 2055 (HVAC capex compounding) — expect insurance premiums to compound above CPI over the hold.
Questions for the listing agent
- It's been on market 59 days. Have you received any prior offers? Is the seller open to a 3% concession, seller financing, or rate buy-down credit?
- Built in 1900 — when were the roof, HVAC, electrical panel, plumbing, and water heater last replaced?
- Is there a deadline driving the sale (1031 exchange, divorce, estate, relocation)? That informs how much negotiation room exists.
- Schools are D-rated, which usually means shorter tenancies and higher turnover. Who's the typical renter profile here, and what's been the actual vacancy rate?
- Crime grade is F in this area — have there been break-ins, vandalism, or insurance claims at this property in the last 3 years? What carrier currently insures it and at what premium?
- What's the average days-on-market for RENTAL listings here right now (not sales)? A rising rental-DOM trend means longer vacancies and softer asking-rent achievability than the comps imply.
- What's the recent tenant-quality profile in this submarket — average credit score on applications, eviction rate, late-payment / NSF rate, and stable-employment percentage? A property-management company in the area should have these aggregated.
- How much new apartment / multifamily construction is in the pipeline within 1–3 miles? Heavy new supply (>2% of stock underway) typically softens rents 12–24 months out; light construction supports rent growth.
Investment metrics
- 1% rule
- 1.79% ✓
- Cap rate
- 14.95%
- Cash-on-cash
- 30.91%
- DSCR
- 2.38
- GRM
- 4.6
CMA / ARV
- ARV (on-the-fly)
- $221,778
- Comps found
- 1
Show comp detail 1 sale within ~0.75 mi
| Address | Dist | Beds/Ba | Sqft | Sold | Price | $/sf | Match |
|---|---|---|---|---|---|---|---|
| 3006 S 3rd St | 0.22mi | 4/2.0 | 1,797 (-10%) | 15mo | $200,000 | $111 | 61 |
Match score weights: distance 35% · size 25% · config 20% · recency 20%. Top-matched comps best support the ARV.
Projected returns pro-forma
-3.0% appreciation · 6.06% rent growth · sell at horizon
- IRR
- 29.1%
- Equity multiple
- 2.27×
- Total profit
- $42,183
- Equity at exit
- $17,743
- IRR
- 38.2%
- Equity multiple
- 5.11×
- Total profit
- $136,860
- Equity at exit
- $10,289
Cash invested: $33,320 (down + closing). Projections, not guarantees.
Landlord ↔ Tenant lean methodology
- Overall (STATE)
- 83 Strongly Landlord-Friendly
- State Kentucky
- 83 Strongly Landlord-Friendly · R+16
- County
- — inherits STATE
- City
- — inherits STATE
ZIP-level market 40208
- Home prices YoY
- -23.3%
- Rents YoY
- 6.1%
- Active inventory
- 77
- Price-to-rent
- 9.6×
Monthly cashflow live
- Estimated rent
- $2,135 high interval (Pro) →
- Mortgage (P&I)
- −$624
- Tax from tax record
- −$155 /mo · $1,859/yr
- Insurance
- −$50
- HOA
- −$0
- Vacancy / Maint / Mgmt
- −$448
- Net cashflow
- $858
Break-even live
2-unit breakdown (identical units grouped — click to expand)
| Units | Beds | Baths | Est. rent |
|---|---|---|---|
| 1× unit | 1 | 1 | $1,033 |
| 1× unit | 2 | 1 | $1,102 |
| Total (2 units) | $2,135 | ||
UW: 25.0% down · 7.5% · 30yr · 1.5% tax · 5.0% vac · 8.0% maint · 8.0% mgmt
Financing live
Cash to close
- Down payment
- $29,750
- Closing costs
- $3,570
- Reserves months
- —
- Total cash needed
- —
Loan-product check · same deal, 3 products live
Conventional
25% down · 7.5% · 30yr
- Down + closing
- —
- Monthly P&I
- —
- Monthly cashflow
- —
- DSCR
- —
- Eligible?
- —
Personal DTI + credit; lowest rate.
DSCR
20% down · 8.5% · 30yr
- Down + closing
- —
- Monthly P&I
- —
- Monthly cashflow
- —
- DSCR
- —
- Eligible?
- —
No personal income docs; deal must DSCR.
Hard money
10% down · 12.0% · 12mo
- Down + closing
- —
- Monthly P&I
- —
- Monthly cashflow
- —
- DSCR
- —
- Eligible?
- —
Short-term bridge; refi at stabilization.
Rent comps 21 comps
| Address | Beds | Baths | Sqft | Rent | $/sqft | DOM | Units | Dist |
|---|---|---|---|---|---|---|---|---|
| 2718 S 5th St Louisville, KY | 5.0 | 2.0 | 2196 | $1,600 | $0.73 | 11d | 1 | 0.07mi |
| 2718 S 3rd St Unit 2 Louisville, KY | 4.0 | 2.0 | 2000 | $2,800 | $1.40 | 11d | 1 | 0.14mi |
| 2711 S 3rd St Unit 1 Louisville, KY | 4.0 | 2.0 | 1800 | $2,400 | $1.33 | 11d | 1 | 0.18mi |
| 2501 S 4th St Louisville, KY | 1.0–3.0 | 1.0–3.0 | 897 | $6,345 | $7.07 | 3d | 1 | 0.35mi |
| 510 Colorado Ave Louisville, KY | 3.0 | 2.0 | 1500 | $1,750 | $1.17 | 23d | 1 | 0.37mi |
| 516 Colorado Ave Louisville, KY | 3.0 | 2.0 | 2000 | $1,800 | $0.90 | 16d | 1 | 0.37mi |
| 3102 Grant Ave Louisville, KY | 4.0 | 2.0 | 1603 | $1,595 | $1.00 | 23d | 1 | 0.50mi |
| 1147 Lincoln Ave Louisville, KY | 4.0 | 1.0 | 1323 | $1,295 | $0.98 | 2d | 1 | 0.59mi |
| 310 W Kenton St Louisville, KY | 3.0 | 2.0 | 1295 | $1,350 | $1.04 | 23d | 1 | 0.76mi |
| 4007 Southern Pkwy Unit 1 Louisville, KY | 4.0 | 1.0 | 1500 | $1,395 | $0.93 | 3d | 1 | 0.88mi |
| 2 Eutropia Ct Louisville, KY | 3.0 | 2.0 | 1367 | $1,950 | $1.43 | 17d | 1 | 0.93mi |
| 1505 Homeview Dr Louisville, KY | 5.0 | 2.0 | 1949 | $1,850 | $0.95 | 16d | 1 | 0.97mi |
| 2125 Crittenden Dr Louisville, KY | 3.0 | 2.0 | 1450 | $1,800 | $1.24 | 17d | 1 | 1.00mi |
| 925 W Evelyn Ave Louisville, KY | 3.0 | 1.5 | 1520 | $1,650 | $1.09 | 23d | 1 | 1.01mi |
| 1501 Bellamy Pl Louisville, KY | 2.0–4.0 | 2.0–4.0 | 1074 | $2,676 | $2.49 | 3d | 1 | 1.08mi |
| 523 Rawlings St Louisville, KY | 3.0 | 1.0 | 1296 | $1,495 | $1.15 | 11d | 1 | 1.29mi |
| 1445 S 2nd St Unit 3 Louisville, KY | 3.0 | 1.0 | 1290 | $1,500 | $1.16 | 14d | 1 | 1.32mi |
| 825 Parkway Dr Louisville, KY | 3.0 | 2.0 | 1526 | $1,600 | $1.05 | 16d | 1 | 1.45mi |
| 4513 S 6th St Louisville, KY | 3.0 | 2.0 | 1581 | $2,650 | $1.68 | 23d | 1 | 1.48mi |
| 1375 S 1st St Louisville, KY | 4.0 | 3.0 | 2470 | $2,400 | $0.97 | 23d | 1 | 1.49mi |
| 1382 S 1st St Unit 1382-10 Carriage House Louisville, KY | 3.0 | 2.0 | 1500 | $1,900 | $1.27 | 3d | 1 | 1.50mi |
Listing history 50 events
-
2026-05-08status Pending
-
2026-04-12historical Active Under Contract
-
2026-03-10$119,000 Active
-
2024-06-20historical Active Under Contract
-
2024-05-22price $150,000
-
2024-04-04price $155,000
-
2024-04-03status Active
-
2024-03-31historical Active Under Contract
-
2024-03-26price $165,000
-
2024-03-01status Active
-
2024-02-25historical Active Under Contract
-
2024-02-22price $169,000
-
2024-02-01status Active
-
2024-01-26status Pending
-
2024-01-26historical
-
2024-01-14$175,000 Active
-
2023-09-21historical
-
2023-08-28$173,000 Active
-
2023-08-28price $173,000
-
2023-08-28historical
-
2023-08-24$175,000 Active
-
2022-06-13soldstatus $147,500
-
2022-06-09soldstatus $147,500 Closed
-
2022-05-11status Pending
-
2022-05-11historical Active Under Contract
-
2022-05-04$155,000 Active
-
2022-05-03historical
-
2022-04-27historical Active Under Contract
-
2022-04-22status Active
-
2022-04-18historical Active Under Contract
-
2022-04-15$155,000 Active
-
2021-05-20soldstatus $85,000
-
2020-12-31historical
-
2020-08-27status Active
-
2020-08-27price $95,000
-
2020-08-11status Pending
-
2020-08-04$100,000 Active
-
2020-04-04historical
-
2020-01-28$115,000 Active
-
2017-12-26historical
-
2017-10-09$61,500 Active
-
2015-09-25soldstatus $33,333 Closed
-
2015-08-04status Pending
-
2015-05-28status Active
-
2015-05-28price $72,500
-
2015-05-19status Pending
-
2015-04-13$79,000 Active
-
2015-04-13price $74,000
-
2007-05-14historical
-
2006-10-17$74,900
ⓘ Source: listings_history table (triggers on properties + properties_extension) + one-shot
backfill from property_details.listing_events for pre-trigger history.
Tax reassessment forecast KY · Resets to sale price
- Current annual tax
- $1,859 · $155/mo
- Projected year-2 tax
- $1,859 · $155/mo
- Expected delta
- $0/yr ($0/mo · 0.0%)
ⓘ Screening estimate from a state-policy table — verify with the county assessor before closing.
Climate risk First Street
- Flood 1/10 Low FEMA zone X (unshaded) · 0% chance over 30 yrs
- Wildfire 1/10 Low
- Heat 5/10 Major 7 d/yr ≥105°F today · 20 d/yr by 30 yrs out
- Wind 2/10 Low 100% chance of damaging wind over 30 yrs
- Air quality 2/10 Low 1 unhealthy d/yr today · 3 by 30 yrs out
Nearby sold comps map
Loading sold comps map…
Walkable amenities ~0.75 mi
Loading nearby amenities…
Taxation est. · year 1
- Rental income
- $25,620
- − Mortgage interest
- −$6,666
- − Property taxes
- −$1,859
- − Insurance
- −$595
- − Repairs & maintenance
- −$2,050
- − Management
- −$2,050
- − Depreciation
- −$3,462
- Taxable income
- $8,940
- Est. tax owed @ 24.0%
- −$2,146
- After-tax cash flow
- $8,152/yr
For passive investors: Depreciation is non-cash, so a rental often shows a tax loss while cash-flowing — sheltering income. Rental losses are passive: they offset passive income freely, and up to $25,000/yr can offset ordinary (W-2) income if you actively participate and your MAGI is under $100k (phasing out to $0 by $150k); unused losses carry forward. On sale, claimed depreciation is recaptured at up to 25%, and gains may owe capital-gains tax (a 1031 exchange can defer both). Figures are a year-1 estimate at your 24.0% rate — not tax advice; consult a CPA.
Schools (NCES district)
- District
- Jefferson County
- NCES district ID
- 2102990
- Math proficiency
- 19% ▼ -17.00%
- Reading proficiency
- 35% ▼ -11.00%
- Median HH income
- $47,885
- Composite
- 23.45/100
- National rank
- #7884
- State rank
- #121 of 165 in KY
Livability — Louisville
- Score
- 63/100
- State rank
- #333
- US rank
- #15887
Category grades
Schools grade is shown separately in the Schools card above.
Census & demographics
- Census place
- Louisville, KY
- County
- Jefferson County · 790,184 people
- City population
- 769,292
- Metro
- Louisville/Jefferson County, KY-IN
- Population (ZIP)
- 15,605
- Household income
- $39,560
- Rent vs Own
- Severe rent burden
- 1136.0
Population outlook (Jefferson County) Hauer SSP2
- Today (2025)
- 823,112 people
- By 2030
- 849,343 · +3.2%
- By 2040
- 895,696 · +8.8%
- By 2050
- 933,630 · +13.4%
- By 2075
- 1,028,262 · +24.9%
- By 2100
- 1,072,675 · +30.3%
Race, ethnicity, and origin ACS 2023
- Neighborhood character
- Diverse neighborhood (Simpson 0.56)
- Race & ethnicity
- White 62% Black 22% Two or more races 9% Hispanic / Latino 6% Asian 1%
- Hispanic origin (detail)
- Mexican 4%
- Common ancestry
- Italian 3% Lithuanian 2% Slovak 2%
- Foreign-born
- 5% · Canada, China, South Korea
- Languages at home
- 90% English-only · Spanish 3% French/Haitian/Cajun 1%
Political lean MEDSL · Jefferson
- 2024 margin
- D (+16.6) · D 57.4% · R 40.9% · Other 1.7%
- 2008→2024 swing
- +4.5pp toward D · 2008: 12.0pp · 2024: 16.6pp
- All cycles
- 2024: D+16.6 2020: D+20.1 2016: D+13.3 2012: D+11.1 2008: D+12.0
Not yet ingested
- Civics
- —
Market trends
- HPI YoY
- ▼ -72.97%
- Current HPI
- 240.6261
- Rent YoY
- ▲ 6.06%
- Metro
- Louisville/Jefferson County, KY-IN
- State GDP YoY
- ▲ 1.81%
- F500 in state
- 4
Industry mix (Fortune 500 HQ in KY)
| Industry | F500 HQs | Revenue |
|---|---|---|
| Healthcare | 1 | $118B |
|
||
| Food / Beverage | 1 | $7B |
|
||
Price history
+48.9% since first listed52 events — show timeline
- 2026-05-08 Pending — Metro Search MLS
- 2026-04-12 Contingent — Metro Search MLS
- 2026-03-10 Listed $119,000 Metro Search MLS
- 2024-06-20 Contingent — Metro Search MLS
- 2024-05-22 Price Changed $150,000 Metro Search MLS
- 2024-04-04 Price Changed $155,000 Metro Search MLS
- 2024-04-03 Relisted — Metro Search MLS
- 2024-03-31 Contingent — Metro Search MLS
- 2024-03-26 Price Changed $165,000 Metro Search MLS
- 2024-03-01 Relisted — Metro Search MLS
- 2024-02-25 Contingent — Metro Search MLS
- 2024-02-22 Price Changed $169,000 Metro Search MLS
- 2024-02-01 Relisted — Metro Search MLS
- 2024-01-26 Pending — Metro Search MLS
- 2024-01-26 Listing Removed — Metro Search MLS
- 2024-01-14 Listed $175,000 Metro Search MLS
- 2023-09-21 Listing Removed — Metro Search MLS
- 2023-08-28 Listing Removed — Metro Search MLS
- 2023-08-28 Price Changed $173,000 Metro Search MLS
- 2023-08-28 Listed $173,000 Metro Search MLS
- 2023-08-24 Listed $175,000 Metro Search MLS
- 2022-06-13 Sold (Public Records) $147,500 Public Records
- 2022-06-09 Sold (MLS) $147,500 Metro Search MLS
- 2022-05-11 Pending — Metro Search MLS
- 2022-05-11 Contingent — Metro Search MLS
- 2022-05-04 Listed $155,000 Metro Search MLS
- 2022-05-03 Listing Removed — Metro Search MLS
- 2022-04-27 Contingent — Metro Search MLS
- 2022-04-22 Relisted — Metro Search MLS
- 2022-04-18 Contingent — Metro Search MLS
- 2022-04-15 Listed $155,000 Metro Search MLS
- 2021-05-20 Sold (Public Records) $85,000 Public Records
- 2020-12-31 Listing Removed — Metro Search MLS
- 2020-08-27 Relisted — Metro Search MLS
- 2020-08-27 Price Changed $95,000 Metro Search MLS
- 2020-08-11 Pending — Metro Search MLS
- 2020-08-04 Listed $100,000 Metro Search MLS
- 2020-04-04 Listing Removed — Metro Search MLS
- 2020-01-28 Listed $115,000 Metro Search MLS
- 2017-12-26 Listing Removed — Metro Search MLS
- 2017-10-09 Listed $61,500 Metro Search MLS
- 2015-09-25 Sold (MLS) $33,333 Metro Search MLS
- 2015-08-04 Pending — Metro Search MLS
- 2015-05-28 Relisted — Metro Search MLS
- 2015-05-28 Price Changed $72,500 Metro Search MLS
- 2015-05-19 Pending — Metro Search MLS
- 2015-04-13 Listed $79,000 Metro Search MLS
- 2015-04-13 Price Changed $74,000 Metro Search MLS
- 2007-05-14 Listing Removed — Metro Search MLS
- 2006-10-17 Listed $74,900 Metro Search MLS
- 2006-08-30 Listing Removed — Metro Search MLS
- 2006-01-31 Listed $79,900 Metro Search MLS
Property tax history
+9.4%/yrLatest (2025): $1,859 · -1.9% YoY. Source: county tax records.
Cash-flow waterfall
monthlySold comps — $/sqft
last 12 mo · ≤1 miLoading sold comps…