 9-Plex
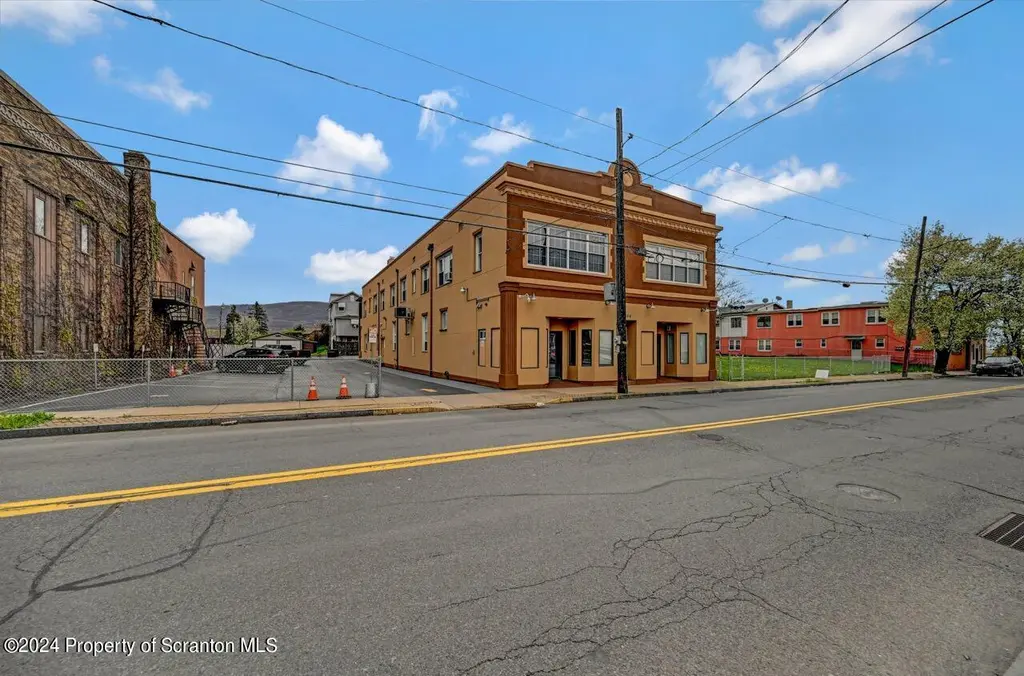
486 Hazle St · Wilkes-Barre, PA
Flood risk No data
- FEMA flood zone
- —
- Chance of flooding over 30 yrs
- —
- Est. flood insurance / yr
- —
Fire risk No data
- Est. fire insurance / yr
- —
Heat risk No data
- Hot days now (above threshold)
- —
- Hot days in 30 yrs
- —
Wind risk No data
- Chance of severe wind over 30 yrs
- —
Air-quality risk No data
- Unhealthy air days now
- —
- Unhealthy air days in 30 yrs
- —
Risk factors via First Street. Map © Google.
Why this score? — see what drove the B- grade
The composite is a weighted blend of 9 inputs, each scored 0–100. Each bar is that input's sub-score; the figure is the points it added to the 100-point composite (weight × sub-score).
- Cash flow +28.2/30.0
- DSCR +10.0/10.0
- 1% rule +7.8/10.0
- ARV discount +7.5/15.0
- Rent growth +4.2/5.0
- Condition / age +4.0/5.0
- Livability +2.5/5.0
- Schools +2.1/10.0
- Appreciation +0.0/10.0
$1,249,995
🖨 Deal sheet (PDF) 📄 Offer letter ✓ Due diligence
Multi-family units
County records classify this as Multi-Family (5+ Unit). Listing-text estimate: 9 units. confirmed
5+ unit building — per-unit beds/baths from public records are typically unavailable; the breakdown below (if shown) is an estimate from the listing text.
Listing remarks MLS
High-end 9 unit property with potential for additional revenue! This is the nicest investment property I have listed in a long time. No expense was spared during renovations, meaning this property should be major maintenance free for years to come!The complex consists of 9 apartments, 3 garages, a 18 car parking lot and a large undeveloped lot with a existing curb cut for road access that is ideal for many investments. This is not your average investment property!
Key facts
- 0.5 acre lot
- 2 garage spots
- Built 1950
Tags
Neighborhood map
What this means for you Summary
Snapshot
- This is a 9 × 14-bed/10.0-bath units multifamily listed at $1.25M. Condition is rated good.
Deal economics
- At list price, monthly cash flow is $4k ($48k/yr) — positive. Per door: $442/mo.
- The deal already cash-flows at list — no discount required.
- Meets the 1% rule at list price ($16k rent vs $1.25M).
- Recommended offer: $1.14M (9.0% below list) — sets the bar for market timing.
- Cap rate 10.1% vs local median 5.7% in Wilkes-Barre — top-decile yield for the area; either an underpriced asset or a hidden risk that comps aren't pricing in. Stress-test before assuming the spread holds.
Location & tenants
- Location reads: area grade B — affects rentability + tenant quality, not the cash-flow math above.
- Wilkes-Barre Area SD (urban): math 19% / reading 32% proficiency, ranked #469 of 539 in PA (top 87%) — low school quality limits family demand, transient renter base, plan for 1-2y turnover; 61% free/reduced lunch — lower-income household profile, screen leases tightly.
- Market conditions: Rents rising fast (+6.8%/yr); 221 active listings in the ZIP; 349 units permitted in Luzerne County in 2024 (16 in 5+ unit buildings).
- At $15,974/mo this rent would consume 340% of the median local household income ($56k/yr) (locally 1632% of renters already pay >50% of income on rent) — very limited rent-growth headroom before tenants either downsize or default.
Forward outlook
- Local home prices are declining (-3.0%/yr); year-one equity from $9k of loan paydown is wiped out by about $38k of value loss. Plan a longer hold.
- Luzerne County population projected at +4% by 2050 — modest demand growth; plan on rents tracking national, not racing it.
- At projected returns (-3.0% appreciation + 6.8% rent growth), your $350k cash investment doubles in ~7 years — after that, you're playing with house money.
Negotiation context
- It's been on market 117 days — a 9% lower offer ($1.14M) is reasonable based on typical stale-listing flexibility.
- 5 sale attempts since 4y ago with the ask held roughly flat each time — persistent listings suggest the price (not the market) is what's stuck; bring a comps-based counter.
Risks & watch-outs
- Watch-outs: built in 1950 — expect roof / HVAC / electrical / plumbing capex.
Questions for the listing agent
- It's been on market 117 days. Have you received any prior offers? Is the seller open to a 9% concession, seller financing, or rate buy-down credit?
- Can we see the unit-by-unit rent roll, current vacancy, and any below-market leases? What's the average tenancy length?
- What capital expenditures (roof, boiler, parking lot, exteriors) have been made in the last 5 years, and what's planned in the next 2?
- Built in 1950 — when were the roof, HVAC, electrical panel, plumbing, and water heater last replaced?
- Why hasn't it sold? Are there any deal-killer items the seller is aware of (foundation, flood, title, zoning, code violations)?
- Is there a deadline driving the sale (1031 exchange, divorce, estate, relocation)? That informs how much negotiation room exists.
- What's the average days-on-market for RENTAL listings here right now (not sales)? A rising rental-DOM trend means longer vacancies and softer asking-rent achievability than the comps imply.
- What's the recent tenant-quality profile in this submarket — average credit score on applications, eviction rate, late-payment / NSF rate, and stable-employment percentage? A property-management company in the area should have these aggregated.
- How much new apartment / multifamily construction is in the pipeline within 1–3 miles? Heavy new supply (>2% of stock underway) typically softens rents 12–24 months out; light construction supports rent growth.
Investment metrics
- 1% rule
- 1.28% ✓
- Cap rate
- 10.11%
- Cash-on-cash
- 13.65%
- DSCR
- 1.61
- GRM
- 6.5
CMA / ARV
- ARV (median comp)
- $709,590
- List price
- $1,249,995
- Delta
- 76.16%
- Verdict
- OVERPRICED
- Comps
- 2 within 1.0 mi
Projected returns pro-forma
-3.0% appreciation · 6.84% rent growth · sell at horizon
- IRR
- 8.1%
- Equity multiple
- 1.33×
- Total profit
- $115,339
- Equity at exit
- $186,378
- IRR
- 20.4%
- Equity multiple
- 3.04×
- Total profit
- $712,603
- Equity at exit
- $108,077
Cash invested: $349,999 (down + closing). Projections, not guarantees.
Landlord ↔ Tenant lean methodology
- Overall (STATE)
- 62 Landlord-Friendly
- State Pennsylvania
- 62 Landlord-Friendly · EVEN
- County
- — inherits STATE
- City
- — inherits STATE
ZIP-level market 18702
- Rents YoY
- 6.8%
- Active inventory
- 221
- Price-to-rent
- 58.7×
Monthly cashflow live
- Estimated rent
- $15,974 medium interval (Pro) →
- Mortgage (P&I)
- −$6,555
- Tax est. 1.5%
- −$1,562 /mo · $18,750/yr
- Insurance
- −$521
- HOA
- −$0
- Vacancy / Maint / Mgmt
- −$3,355
- Net cashflow
- $3,981
Break-even live
Sensitivity live
| Price | -10% $4,845 | -5% $4,413 | +0% $3,981 | +5% $3,549 | +10% $3,117 |
|---|---|---|---|---|---|
| Rent | -10% $2,719 | -5% $3,350 | +0% $3,981 | +5% $4,612 | +10% $5,243 |
| Rate | -1.0pp $4,611 | -0.5pp $4,299 | base $3,981 | +0.5pp $3,657 | +1.0pp $3,328 |
9-unit breakdown (identical units grouped — click to expand)
| Units | Beds | Baths | Est. rent |
|---|---|---|---|
| 9× units | 14 | 10 | $15,975 |
| #1 | 14 | 10 | $1,775 |
| #2 | 14 | 10 | $1,775 |
| #3 | 14 | 10 | $1,775 |
| #4 | 14 | 10 | $1,775 |
| #5 | 14 | 10 | $1,775 |
| #6 | 14 | 10 | $1,775 |
| #7 | 14 | 10 | $1,775 |
| #8 | 14 | 10 | $1,775 |
| #9 | 14 | 10 | $1,775 |
| Total (9 units) | $15,974 | ||
UW: 25.0% down · 7.5% · 30yr · 1.5% tax · 5.0% vac · 8.0% maint · 8.0% mgmt
Financing live
Cash to close
- Down payment
- $312,499
- Closing costs
- $37,500
- Reserves months
- —
- Total cash needed
- —
Loan-product check · same deal, 3 products live
Conventional
25% down · 7.5% · 30yr
- Down + closing
- —
- Monthly P&I
- —
- Monthly cashflow
- —
- DSCR
- —
- Eligible?
- —
Personal DTI + credit; lowest rate.
DSCR
20% down · 8.5% · 30yr
- Down + closing
- —
- Monthly P&I
- —
- Monthly cashflow
- —
- DSCR
- —
- Eligible?
- —
No personal income docs; deal must DSCR.
Hard money
10% down · 12.0% · 12mo
- Down + closing
- —
- Monthly P&I
- —
- Monthly cashflow
- —
- DSCR
- —
- Eligible?
- —
Short-term bridge; refi at stabilization.
Listing history 22 events
-
2026-06-18days on market $1,249,995 Active 117 DOM
-
2026-06-17days on market $1,249,995 Active 116 DOM
-
2026-06-16days on market $1,249,995 Active 115 DOM
-
2026-06-15days on market $1,249,995 Active 114 DOM
-
2026-06-14days on market $1,249,995 Active 112 DOM
-
2026-06-13days on market $1,249,995 Active 111 DOM
-
2026-06-10days on market $1,249,995 Active 109 DOM
-
2026-06-09days on market $1,249,995 Active 108 DOM
-
2026-06-08days on market $1,249,995 Active 107 DOM
-
2026-06-07days on market $1,249,995 Active 106 DOM
-
2026-06-02days on market $1,249,995 Active 101 DOM
-
2026-06-01days on market $1,249,995 Active 100 DOM
-
2026-05-31days on market $1,249,995 Active 99 DOM
-
2026-05-30days on market $1,249,995 Active 98 DOM
-
2026-02-21$1,249,995 Active 468-char remark
Show marketing remark (468 chars)
High-end 9 unit property with potential for additional revenue! This is the nicest investment property I have listed in a long time. No expense was spared during renovations, meaning this property should be major maintenance free for years to come!The complex consists of 9 apartments, 3 garages, a 18 car parking lot and a large undeveloped lot with a existing curb cut for road access that is ideal for many investments. This is not your average investment property!
-
2024-04-30$1,249,995 Active
-
2023-07-07soldstatus $1,100,000 Closed
-
2023-04-07status Pending
-
2023-02-21$1,250,000 Active
-
2022-07-23$1,395,000
-
2022-07-22soldstatus $68,000
-
2022-06-29$1,395,000
ⓘ Source: listings_history table (triggers on properties + properties_extension) + one-shot
backfill from property_details.listing_events for pre-trigger history.
Nearby sold comps map
Loading sold comps map…
Walkable amenities ~0.75 mi
Loading nearby amenities…
Taxation est. · year 1
- Rental income
- $191,688
- − Mortgage interest
- −$70,019
- − Property taxes
- −$18,750
- − Insurance
- −$6,250
- − Repairs & maintenance
- −$15,335
- − Management
- −$15,335
- − Depreciation
- −$36,363
- Taxable income
- $29,635
- Est. tax owed @ 24.0%
- −$7,112
- After-tax cash flow
- $40,660/yr
For passive investors: Depreciation is non-cash, so a rental often shows a tax loss while cash-flowing — sheltering income. Rental losses are passive: they offset passive income freely, and up to $25,000/yr can offset ordinary (W-2) income if you actively participate and your MAGI is under $100k (phasing out to $0 by $150k); unused losses carry forward. On sale, claimed depreciation is recaptured at up to 25%, and gains may owe capital-gains tax (a 1031 exchange can defer both). Figures are a year-1 estimate at your 24.0% rate — not tax advice; consult a CPA.
Condition & rehab AI · 13 photos
This multi-family property is in good condition with modern amenities and a well-maintained exterior. It is ready for minor cosmetic updates to enhance its curb appeal and interior aesthetics.
Value-add opportunities
- Both Painting the exterior and interior walls — Fresh paint can enhance the curb appeal and interior aesthetics, making the property more attractive to potential buyers and renters.
- Both Updating the kitchen backsplash — A fresh backsplash can modernize the kitchen and make it more appealing to potential buyers and renters.
Renovation cost estimate screening
Value-add ROI direction
- Both Painting the exterior and interior walls — Fresh paint can enhance the curb appeal and interior aesthetics, making the property more attractive to potential buyers and renters. ↑
- Both Updating the kitchen backsplash — A fresh backsplash can modernize the kitchen and make it more appealing to potential buyers and renters. ↑
ⓘ Cost ranges are severity-bucket heuristics (US national rule-of-thumb). Get contractor quotes + a written scope before underwriting a rehab budget.
Schools (NCES district)
- District
- Wilkes-Barre Area SD
- NCES district ID
- 4226300
- Math proficiency
- 19% ▼ -2.00%
- Reading proficiency
- 32% ▼ -9.00%
- Median HH income
- $37,420
- Composite
- 21.22/100
- National rank
- #8409
- State rank
- #469 of 539 in PA
Livability — Wilkes-Barre
No livability data for this city. (Only ~50 U.S. cities are tracked.)
Census & demographics
- Census place
- Wilkes-Barre, PA
- County
- Luzerne County · 118,885 people
- City population
- 73,981
- Metro
- Scranton--Wilkes-Barre, PA
- Population (ZIP)
- 41,970
- Household income
- $56,378
- Rent vs Own
- Severe rent burden
- 1632.0
Population outlook (Luzerne County) Hauer SSP2
- Today (2025)
- 319,505 people
- By 2030
- 319,943 · +0.1%
- By 2040
- 322,643 · +1.0%
- By 2050
- 330,817 · +3.5%
- By 2075
- 379,145 · +18.7%
- By 2100
- 431,908 · +35.2%
Race, ethnicity, and origin ACS 2023
- Neighborhood character
- Diverse neighborhood (Simpson 0.59)
- Race & ethnicity
- White 58% Hispanic / Latino 25% Black 12% Two or more races 11% Asian 2%
- Hispanic origin (detail)
- Mexican 6% Puerto Rican 6% Dominican 9%
- Common ancestry
- Romanian 14% Scotch-Irish 2% Iranian 1%
- Foreign-born
- 13% · Canada, Jamaica
- Languages at home
- 79% English-only · Spanish 17% Other Asian/Pacific 1% Other Indo-European 1%
Political lean MEDSL · Luzerne
- 2024 margin
- R (+19.2) · D 40.0% · R 59.2%
- 2008→2024 swing
- -27.6pp toward R · 2008: 8.4pp · 2024: -19.2pp
- All cycles
- 2024: R+19.2 2020: R+14.4 2016: R+19.6 2012: D+4.8 2008: D+8.4
Not yet ingested
- Civics
- —
Market trends
- HPI YoY
- ▼ -156.99%
- Current HPI
- 216.9373
- Rent YoY
- ▲ 6.84%
- Metro
- Scranton--Wilkes-Barre, PA
- State GDP YoY
- ▲ 1.68%
- F500 in state
- 34
Industry mix (Fortune 500 HQ in PA)
| Industry | F500 HQs | Revenue |
|---|---|---|
| Healthcare | 2 | $309B |
|
||
| Insurance | 2 | $27B |
|
||
| Telecommunications / Media | 1 | $124B |
|
||
| Industrial Distribution | 1 | $22B |
|
||
| Financial Services | 1 | $20B |
|
||
| Chemicals / Materials | 1 | $18B |
|
||
Price history
-10.4% since first listed8 events — show timeline
- 2026-02-21 Listed $1,249,995 GSBR as distributed by MLS GRID
- 2024-04-30 Listed $1,249,995 GSBR as distributed by MLS GRID
- 2023-07-07 Sold (MLS) $1,100,000 LCAR
- 2023-04-07 Pending — LCAR
- 2023-02-21 Listed $1,250,000 LCAR
- 2022-07-23 Listed $1,395,000 LCAR
- 2022-07-22 Sold (MLS) $68,000 LCAR
- 2022-06-29 Listed $1,395,000 LCAR
Cash-flow waterfall
monthlySold comps — $/sqft
last 12 mo · ≤1 miLoading sold comps…