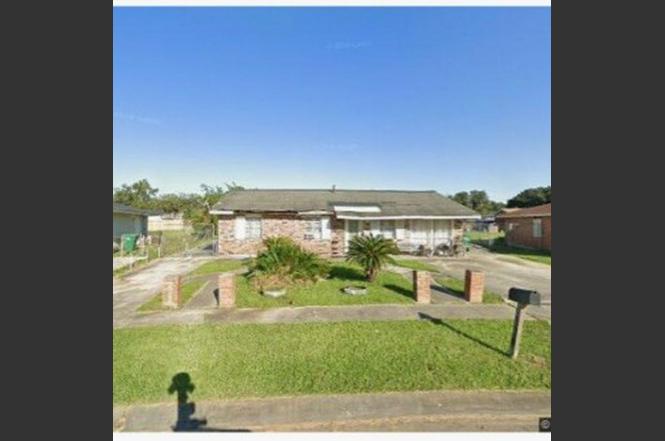
916 W Krueger Ln · Bridge City, LA
Flood risk 8/10 · Major
- FEMA flood zone
- X
- Chance of flooding over 30 yrs
- 0.6%
- Est. flood insurance / yr
- $507 – $1,088
Fire risk 1/10 · Minimal
- Est. fire insurance / yr
- $1,269 – $2,357
Heat risk 10/10 · Severe
- Hot days now (above 109°F)
- 7 days/yr
- Hot days in 30 yrs
- 21 days/yr
Wind risk 10/10 · Severe
- Chance of severe wind over 30 yrs
- 99.0%
Air-quality risk 2/10 · Minimal
- Unhealthy air days now
- 1 days/yr
- Unhealthy air days in 30 yrs
- 2 days/yr
Risk factors via First Street. Map © Google.
Why this score? — see what drove the C+ grade
The composite is a weighted blend of 9 inputs, each scored 0–100. Each bar is that input's sub-score; the figure is the points it added to the 100-point composite (weight × sub-score).
- Cash flow +30.0/30.0
- 1% rule +10.0/10.0
- DSCR +10.0/10.0
- Livability +3.1/5.0
- Schools +2.5/10.0
- Condition / age +2.5/5.0
- Rent growth +2.3/5.0
- ARV discount +0.0/15.0
- Appreciation +0.0/10.0
$87,000
🖨 Deal sheet (PDF) 📄 Offer letter ✓ Due diligence
Listing remarks
Estate Sale 916 West Krueger Lane, Westwego, Louisiana An exceptional opportunity awaits in this estate property located on quiet West Krueger Lane in Westwego. Set on a spacious 10,564-square-foot lot, this classic Louisiana home holds strong potential for restoration or redevelopment in a rapidly growing area. The residence has been vacant for some time and is ready for a fresh vision. Offering solid bones and timeless charm, its an ideal fixer-upper for investors, renovators, or buyers seeking to bring new life to a beloved property. This home is being sold as is with no repairs or warranties by the estate. Its location offers easy access to shopping, schools, and main thoroughfaresjus
Key facts
- Spacious lot
- 0.24 acre lot
- Built 1973
Tags
Property features AI
Exterior
- Home design: House
- Exterior features: Lot of approximately 10,564 sq ft
Neighborhood map
What this means for you Summary
Snapshot
- This is a 3-bed/1.5-bath single-family listed at $87k.
Deal economics
- At list price, monthly cash flow is $693 ($8k/yr) — positive.
- The deal already cash-flows at list — no discount required.
- Meets the 1% rule at list price ($2k rent vs $87k).
Location & tenants
- Location reads 61/100 on livability (#225 in LA) — a middle-class / working-renter tenant base. Strengths: cost of living A+, housing A+; Watch: crime F, amenities F, commute F.
- Jefferson Parish (suburban): math 24% / reading 34% proficiency, ranked #44 of 98 in LA (top 45%) — low school quality limits family demand, transient renter base, plan for 1-2y turnover; 70% free/reduced lunch — lower-income household profile, screen leases tightly.
- Zoned schools: Ray St. Pierre Academy For Advanced Studies (math 82% / reading 82%, grade A+, #9 of 646 statewide, top 1%, 336 students, 26% FRL); Emmett C.Gilbert School of Excellence At Ford (math 15% / reading 23%, grade F, #463 of 646 statewide, top 72%, 689 students, 80% FRL); L.W. Higgins High School (math 14% / reading 25%, grade F, #186 of 265 statewide, top 73%, 996 students, 70% FRL).
- Market conditions: Rents soft (-0.8%/yr); 188 active listings in the ZIP; 9 comparable units currently listed for rent nearby; rentals at typical pace (median 25d on market — plan ~3-4 weeks tenant-placement turnaround); 44% of comp listings sitting > 30 days — soft ceiling on asking rent; 518 units permitted in Jefferson Parish in 2024 (43 in 5+ unit buildings).
- This rent runs 37% of the median local income ($54k/yr) — at the standard rent-burdened threshold; future hikes will face affordability resistance.
Forward outlook
- Local home prices are declining (-3.0%/yr); year-one equity from $601 of loan paydown is wiped out by about $3k of value loss. Plan a longer hold.
- At projected returns (-3.0% appreciation + 0.0% rent growth), your $24k cash investment doubles in ~4 years — after that, you're playing with house money.
Negotiation context
- Only 8 days on market — expect competitive offers; lowballing is unlikely to land.
Risks & watch-outs
- Watch-outs: flood insurance adds $66/mo.
- Climate carrying-cost: severe flood risk; severe wind risk, 99% chance of damaging wind over 30y; extreme-heat days projected 7→21/yr by 2055 (HVAC capex compounding) — expect insurance premiums to compound above CPI over the hold.
Questions for the listing agent
- Built in 1973 — when were the roof, HVAC, electrical panel, plumbing, and water heater last replaced?
- What's the actual annual flood-insurance premium (NFIP or private), and is the property in a SFHA with mandatory coverage?
- Is there a deadline driving the sale (1031 exchange, divorce, estate, relocation)? That informs how much negotiation room exists.
- Schools are D-rated, which usually means shorter tenancies and higher turnover. Who's the typical renter profile here, and what's been the actual vacancy rate?
- Crime grade is F in this area — have there been break-ins, vandalism, or insurance claims at this property in the last 3 years? What carrier currently insures it and at what premium?
- What's the average days-on-market for RENTAL listings here right now (not sales)? A rising rental-DOM trend means longer vacancies and softer asking-rent achievability than the comps imply.
- What's the recent tenant-quality profile in this submarket — average credit score on applications, eviction rate, late-payment / NSF rate, and stable-employment percentage? A property-management company in the area should have these aggregated.
- How much new for-sale + rental construction is in the pipeline within 1–3 miles? Heavy new supply typically softens prices + rents 12–24 months out; constrained supply supports both.
Investment metrics
- 1% rule
- 1.90% ✓
- Cap rate
- 16.76%
- Cash-on-cash
- 37.39%
- DSCR
- 2.66
- GRM
- 4.4
CMA / ARV
- ARV (on-the-fly)
- $74,100
- Comps found
- 3
Show comp detail 3 sales within ~0.75 mi
| Address | Dist | Beds/Ba | Sqft | Sold | Price | $/sf | Match |
|---|---|---|---|---|---|---|---|
| 912 N Clark Ln | 0.13mi | 3/2.0 | 1,210 (-7%) | 20mo | $55,000 | $45 | 64 |
| 901 N Clark Ln | 0.15mi | 3/2.0 | 1,200 (-8%) | 18mo | $220,000 | $183 | 63 |
| 9416 Cabildo Ln | 0.16mi | 4/2.0 (+1) | 1,411 (+8%) | 10mo | $81,000 | $57 | 63 |
Match score weights: distance 35% · size 25% · config 20% · recency 20%. Top-matched comps best support the ARV.
Projected returns pro-forma
-3.0% appreciation · 0.0% rent growth · sell at horizon
- IRR
- 26.0%
- Equity multiple
- 2.03×
- Total profit
- $25,205
- Equity at exit
- $12,972
- IRR
- 31.8%
- Equity multiple
- 3.47×
- Total profit
- $60,171
- Equity at exit
- $7,522
Cash invested: $24,360 (down + closing). Projections, not guarantees.
Landlord ↔ Tenant lean methodology
- Overall (STATE)
- 90 Strongly Landlord-Friendly
- State Louisiana
- 90 Strongly Landlord-Friendly · R+12
- County
- — inherits STATE
- City
- — inherits STATE
ZIP-level market 70094
- Rents YoY
- -0.8%
- Active inventory
- 188
- Price-to-rent
- 4.4×
Monthly cashflow live
- Estimated rent
- $1,652 high interval (Pro) →
- Mortgage (P&I)
- −$456
- Tax from tax record
- −$53 /mo · $641/yr
- Insurance
- −$36
- Flood insurance flood zone
- −$66 /mo · $798/yr
- HOA
- −$0
- Vacancy / Maint / Mgmt
- −$347
- Net cashflow
- $693
Break-even live
Sensitivity live
| Price | -10% $742 | -5% $717 | +0% $693 | +5% $668 | +10% $643 |
|---|---|---|---|---|---|
| Rent | -10% $562 | -5% $627 | +0% $693 | +5% $758 | +10% $823 |
| Rate | -1.0pp $736 | -0.5pp $715 | base $693 | +0.5pp $670 | +1.0pp $647 |
UW: 25.0% down · 7.5% · 30yr · 1.5% tax · 5.0% vac · 8.0% maint · 8.0% mgmt
Financing live
Cash to close
- Down payment
- $21,750
- Closing costs
- $2,610
- Reserves months
- —
- Total cash needed
- —
Loan-product check · same deal, 3 products live
Conventional
25% down · 7.5% · 30yr
- Down + closing
- —
- Monthly P&I
- —
- Monthly cashflow
- —
- DSCR
- —
- Eligible?
- —
Personal DTI + credit; lowest rate.
DSCR
20% down · 8.5% · 30yr
- Down + closing
- —
- Monthly P&I
- —
- Monthly cashflow
- —
- DSCR
- —
- Eligible?
- —
No personal income docs; deal must DSCR.
Hard money
10% down · 12.0% · 12mo
- Down + closing
- —
- Monthly P&I
- —
- Monthly cashflow
- —
- DSCR
- —
- Eligible?
- —
Short-term bridge; refi at stabilization.
Rent comps 9 comps
| Address | Beds | Baths | Sqft | Rent | $/sqft | DOM | Units | Dist |
|---|---|---|---|---|---|---|---|---|
| 525 Emile Ave Westwego, LA | 3.0 | 2.0 | 1329 | $800 | $0.60 | 25d | 1 | 0.80mi |
| 181 Louisiana St Westwego, LA | 4.0 | 2.0 | 1500 | $1,550 | $1.03 | 45d | 1 | 0.92mi |
| 1433 Utah Beach Dr Bridge City, LA | 1.0–3.0 | 1.0–1.5 | 747 | $1,150 | $1.54 | 6d | 6 | 1.12mi |
| 412 Avenue A Westwego, LA | 2.0 | 1.0 | 1103 | $1,500 | $1.36 | 45d | 1 | 1.15mi |
| 1060 Avenue B Unit A Westwego, LA | 3.0 | 2.0 | 1124 | $1,550 | $1.38 | 25d | 1 | 1.17mi |
| 900 Avenue H Unit D Westwego, LA | 2.0 | 1.5 | 992 | $1,300 | $1.31 | 22d | 1 | 1.29mi |
| 958 Avenue B Westwego, LA | 2.0 | 1.0 | 1018 | $1,500 | $1.47 | 45d | 1 | 1.30mi |
| 309 5th St Bridge City, LA | 3.0 | 2.0 | 1160 | $1,550 | $1.34 | 25d | 1 | 1.37mi |
| 1020 Mono Ct Westwego, LA | 3.0 | 2.0 | 1400 | $1,750 | $1.25 | 45d | 1 | 1.39mi |
Listing history 3 events
-
2025-10-21historical Under Contract
-
2025-10-13$87,000 Active
-
1997-11-01soldstatus
ⓘ Source: listings_history table (triggers on properties + properties_extension) + one-shot
backfill from property_details.listing_events for pre-trigger history.
Tax reassessment forecast LA · Resets to sale price
- Current annual tax
- $641 · $53/mo
- Projected year-2 tax
- $641 · $53/mo
- Expected delta
- $0/yr ($0/mo · 0.0%)
ⓘ Screening estimate from a state-policy table — verify with the county assessor before closing.
Climate risk First Street
- Flood 8/10 Severe FEMA zone X · 60% chance over 30 yrs
- Wildfire 1/10 Low
- Heat 10/10 Extreme 7 d/yr ≥109°F today · 21 d/yr by 30 yrs out
- Wind 10/10 Extreme 99% chance of damaging wind over 30 yrs
- Air quality 2/10 Low 1 unhealthy d/yr today · 2 by 30 yrs out
Nearby sold comps map
Loading sold comps map…
Walkable amenities ~0.75 mi
Loading nearby amenities…
Taxation est. · year 1
- Rental income
- $19,822
- − Mortgage interest
- −$4,873
- − Property taxes
- −$641
- − Insurance
- −$1,232
- − Repairs & maintenance
- −$1,586
- − Management
- −$1,586
- − Depreciation
- −$2,531
- Taxable income
- $7,373
- Est. tax owed @ 24.0%
- −$1,769
- After-tax cash flow
- $6,542/yr
For passive investors: Depreciation is non-cash, so a rental often shows a tax loss while cash-flowing — sheltering income. Rental losses are passive: they offset passive income freely, and up to $25,000/yr can offset ordinary (W-2) income if you actively participate and your MAGI is under $100k (phasing out to $0 by $150k); unused losses carry forward. On sale, claimed depreciation is recaptured at up to 25%, and gains may owe capital-gains tax (a 1031 exchange can defer both). Figures are a year-1 estimate at your 24.0% rate — not tax advice; consult a CPA.
Schools (NCES district)
- District
- Jefferson Parish
- NCES district ID
- 2200840
- Math proficiency
- 24% ▼ -36.00%
- Reading proficiency
- 34% ▼ -30.00%
- Median HH income
- $48,421
- Composite
- 25.19/100
- National rank
- #7511
- State rank
- #44 of 98 in LA
Livability — Bridge City
- Score
- 61/100
- State rank
- #225
- US rank
- #17357
Category grades
Schools grade is shown separately in the Schools card above.
Census & demographics
- Census place
- Bridge City, LA
- County
- Jefferson Parish · 426,999 people
- Metro
- New Orleans-Metairie, LA
- Population (ZIP)
- 32,130
- Household income
- $53,597
- Rent vs Own
- Severe rent burden
- 1457.0
Population outlook (Jefferson County) Hauer SSP2
- Today (2025)
- 451,696 people
- By 2030
- 455,451 · +0.8%
- By 2040
- 458,308 · +1.5%
- By 2050
- 461,031 · +2.1%
- By 2075
- 476,351 · +5.5%
- By 2100
- 499,377 · +10.6%
Race, ethnicity, and origin ACS 2023
- Neighborhood character
- Diverse neighborhood (Simpson 0.65)
- Race & ethnicity
- Black 46% White 36% Hispanic / Latino 13% Two or more races 6% Asian 2%
- Hispanic origin (detail)
- Mexican 2% Dominican 2%
- Common ancestry
- Lithuanian 9% Scottish 1%
- Foreign-born
- 8% · Canada, Vietnam
- Languages at home
- 86% English-only · Spanish 11% Vietnamese 2% French/Haitian/Cajun 1%
Political lean MEDSL · Jefferson
- 2024 margin
- R (+12.9) · D 42.5% · R 55.5% · Other 2.1%
- 2008→2024 swing
- +13.6pp toward D · 2008: -26.6pp · 2024: -12.9pp
- All cycles
- 2024: R+12.9 2020: R+11.1 2016: R+14.8 2012: R+18.4 2008: R+26.6
Not yet ingested
- Civics
- —
Market trends
- HPI YoY
- ▼ -111.56%
- Current HPI
- 102.9992
- Rent YoY
- ▼ -0.80%
- Metro
- New Orleans-Metairie, LA
- State GDP YoY
- ▲ 3.29%
- F500 in state
- 10
Industry mix (Fortune 500 HQ in LA)
| Industry | F500 HQs | Revenue |
|---|---|---|
| Telecommunications | 2 | $23B |
|
||
| Utilities | 1 | $12B |
|
||
| Wholesale / Distribution | 1 | $5B |
|
||
| Advertising | 1 | $2B |
|
||
Price history
3 events — show timeline
- 2025-10-21 Contingent — ForSaleByOwner.com
- 2025-10-13 Listed $87,000 ForSaleByOwner.com
- 1997-11-01 Sold (Public Records) — Public Records
Property tax history
+1.1%/yrLatest (2025): $641 · +0.3% YoY. Source: county tax records.
Cash-flow waterfall
monthlySold comps — $/sqft
last 12 mo · ≤1 miLoading sold comps…