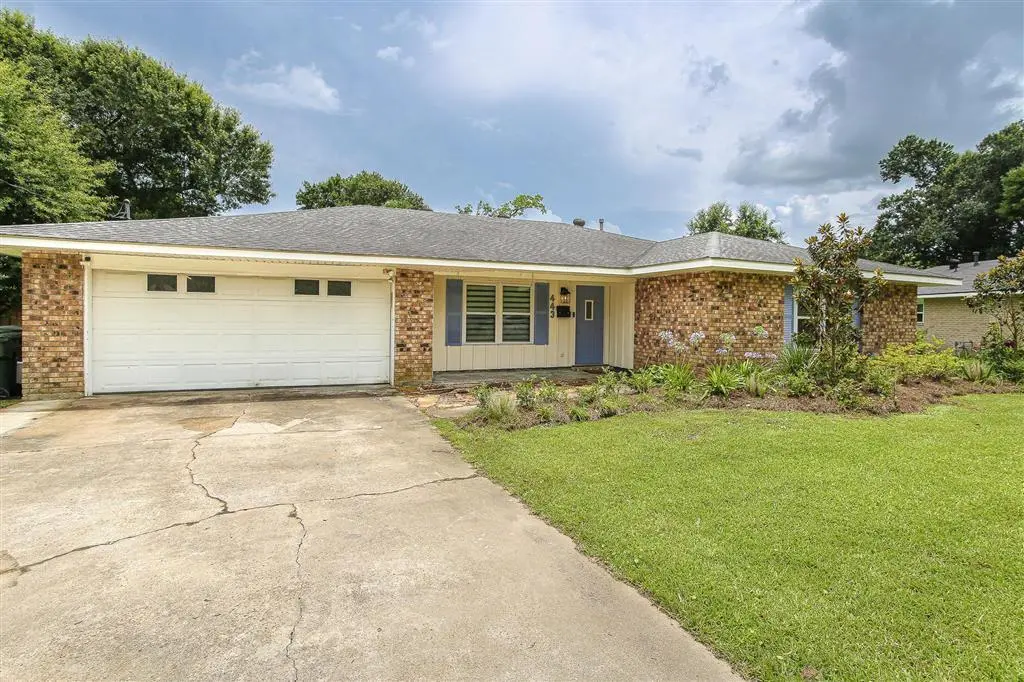
443 Crestwood St · Lake Charles, LA
Flood risk 3/10 · Minor
- FEMA flood zone
- X (unshaded)
- Chance of flooding over 30 yrs
- 0.12%
- Est. flood insurance / yr
- $507 – $1,088
Fire risk 1/10 · Minimal
- Est. fire insurance / yr
- $1,269 – $2,357
Heat risk 9/10 · Severe
- Hot days now (above 109°F)
- 7 days/yr
- Hot days in 30 yrs
- 20 days/yr
Wind risk 9/10 · Severe
- Chance of severe wind over 30 yrs
- 99.0%
Air-quality risk 2/10 · Minimal
- Unhealthy air days now
- 1 days/yr
- Unhealthy air days in 30 yrs
- 1 days/yr
Risk factors via First Street. Map © Google.
Why this score? — see what drove the C- grade
The composite is a weighted blend of 9 inputs, each scored 0–100. Each bar is that input's sub-score; the figure is the points it added to the 100-point composite (weight × sub-score).
- Cash flow +19.4/30.0
- ARV discount +9.4/15.0
- DSCR +6.1/10.0
- Rent growth +5.0/5.0
- 1% rule +4.1/10.0
- Livability +3.4/5.0
- Schools +3.1/10.0
- Condition / age +2.5/5.0
- Appreciation +0.0/10.0
$260,000
🖨 Deal sheet 📄 Offer letter ✓ Due diligence
Listing remarks MLS
If you are looking for a remodeled house in University this is your chance! Large living room and dining room, with wood look tile flooring, opens to a beautifully remodeled kitchen with quartz countertops. 3 large bedrooms, all with walk in closets, and 2 baths, and 2 large storage closets in the hall. Entertaining will be fun on the big covered porch with fans and lighting that overlook one of the largest back yards in all of University. You have plenty of outdoor storage in the 25x25 metal shop that is on a slab. The roof and AC unit were both replaced in 2020. Surround sound in the living room, fiberoptic cable and internet, camera security system and a smart thermostat modernize this home. Within a very short walk you can access the baseball field, pool, park and tennis courts, all the things that really draw people to living in University.
Key facts
- Quartz countertops
- 2 car size shop
- Remodeled kitchen
Tags
Property features AI
Finance
- HOA & community: Suburban community
Exterior
- Parking: Attached garage; Four garage spaces; Workshop in garage; Two open parking spaces (total of 2 additional parking spaces)
- Utilities: Public water; Public sewer; Electricity connected; Natural gas connected; Cable available; Water connected; Sewer connected
- Home design: Single-family residence (house); One-story; Faces north; No common walls; No common-interest association
- Construction: Brick construction; Slab foundation; Built by unknown builder
- Exterior features: Covered rear porch; Patio; Fenced yard with privacy fencing; Back yard and front yard; City lot; Street lights in the neighborhood; Shingle roof; View
Interior
- Kitchen: Kitchen island; Pantry
- Bedrooms: Three main-level bedrooms
- Bathrooms: Two full bathrooms (both on the main level)
- Heating & cooling: Central heating; Central air conditioning
- Interior features: Built-in features; Ceiling fans; Kitchen island; Open floorplan; Pantry; Storage
- Laundry & utility: Laundry room with washer hookup and electric dryer hookup
Neighborhood map
What this means for you Summary
Snapshot
- This is a 3-bed/2.0-bath single-family listed at $260k.
Deal economics
- At list price, monthly cash flow is $290 ($3k/yr) — positive.
- The deal already cash-flows at list — no discount required.
- To meet the 1% rule (rent ≥ 1% of price), the offer needs to be $238k (8.6% below list).
- Recommended offer: $238k (8.6% below list) — sets the bar for 1% rule.
- Cap rate 7.6% vs local median 4.3% in Lake Charles — top-decile yield for the area; either an underpriced asset or a hidden risk that comps aren't pricing in. Stress-test before assuming the spread holds.
Location & tenants
- Location reads 68/100 on livability (#95 in LA) — a middle-class / working-renter tenant base. Strengths: commute A+, cost of living A+, housing A+; Watch: crime F, amenities F, employment D-.
- Calcasieu Parish (other): math 30% / reading 44% proficiency, ranked #29 of 98 in LA (top 30%) — families likely to look elsewhere, expect single-tenant / working-renter base with shorter leases.
- Zoned schools: Dolby Elementary School (math 42% / reading 62%, grade C-, #108 of 646 statewide, top 18%, 381 students, 64% FRL); F. K. White Middle School (math 26% / reading 39%, grade F, #104 of 218 statewide, top 48%, 661 students, 67% FRL); Alfred M. Barbe High School (math 41% / reading 56%, grade D, #41 of 265 statewide, top 16%, 1,991 students, 41% FRL) — zoned schools at 57% FRL track the district average.
- Market conditions: Rents rising fast (+15.1%/yr); 456 active listings in the ZIP; 2 comparable units currently listed for rent nearby; solid renter incomes; 1,298 units permitted in Calcasieu Parish in 2024 (526 in 5+ unit buildings).
- This rent runs 33% of the median local income ($86k/yr) — at the standard rent-burdened threshold; future hikes will face affordability resistance.
Forward outlook
- Local home prices are declining (-3.0%/yr); year-one equity from $2k of loan paydown is wiped out by about $8k of value loss. Plan a longer hold.
- Calcasieu County population projected at +11% by 2050 — modest demand growth; plan on rents tracking national, not racing it.
- At projected returns (-3.0% appreciation + 8.0% rent growth), your $73k cash investment doubles in ~10 years — after that, you're playing with house money.
Negotiation context
- It's been on market 16 days — a 2% lower offer ($256k) is reasonable based on typical stale-listing flexibility.
- 3 sale attempts since 10y ago with the ask held roughly flat each time — persistent listings suggest the price (not the market) is what's stuck; bring a comps-based counter.
Risks & watch-outs
- Climate carrying-cost: severe wind risk, 99% chance of damaging wind over 30y; extreme-heat days projected 7→20/yr by 2055 (HVAC capex compounding) — expect insurance premiums to compound above CPI over the hold.
Questions for the listing agent
- Built in 1979 — when were the roof, HVAC, electrical panel, plumbing, and water heater last replaced?
- Is there a deadline driving the sale (1031 exchange, divorce, estate, relocation)? That informs how much negotiation room exists.
- Schools are B-rated — typically a magnet for longer-tenancy family renters. What's the average tenant stay here, and is there a school-zone premium baked into asking?
- Crime grade is F in this area — have there been break-ins, vandalism, or insurance claims at this property in the last 3 years? What carrier currently insures it and at what premium?
- What's the average days-on-market for RENTAL listings here right now (not sales)? A rising rental-DOM trend means longer vacancies and softer asking-rent achievability than the comps imply.
- What's the recent tenant-quality profile in this submarket — average credit score on applications, eviction rate, late-payment / NSF rate, and stable-employment percentage? A property-management company in the area should have these aggregated.
- How much new for-sale + rental construction is in the pipeline within 1–3 miles? Heavy new supply typically softens prices + rents 12–24 months out; constrained supply supports both.
Investment metrics
- 1% rule
- 0.91% ✗
- Cap rate
- 7.63%
- Cash-on-cash
- 4.79%
- DSCR
- 1.21
- GRM
- 9.1
CMA / ARV
- ARV (on-the-fly)
- $271,189
- Comps found
- 12
Show comp detail 12 sales within ~0.75 mi
| Address | Dist | Beds/Ba | Sqft | Sold | Price | $/sf | Match |
|---|---|---|---|---|---|---|---|
| 209 Vanessa Ave | 0.32mi | 3/2.0 | 1,974 (+1%) | 11mo | $255,000 | $129 | 74 |
| 115 Greenway St | 0.33mi | 4/2.0 (+1) | 1,900 (-3%) | 2mo | $263,400 | $139 | 73 |
| 729 Dianne Ln | 0.42mi | 3/2.0 | 1,959 (+0%) | 12mo | $315,000 | $161 | 70 |
| 401 Montclair St | 0.18mi | 4/2.0 (+1) | 1,760 (-10%) | 4mo | $263,000 | $149 | 67 |
| 450 Greenway St | 0.22mi | 4/3.0 (+1) | 1,827 (-6%) | 4mo | $215,000 | $118 | 67 |
| 629 Becky Ln | 0.48mi | 4/2.0 (+1) | 1,990 (+2%) | 9mo | $305,000 | $153 | 62 |
| 820 Lakeridge Ln | 0.61mi | 3/2.0 | 1,890 (-3%) | 6mo | $245,000 | $130 | 62 |
| 624 Becky Ln | 0.47mi | 3/2.0 | 1,819 (-7%) | 6mo | $290,000 | $159 | 62 |
| 445 Washington | 0.38mi | 4/2.0 (+1) | 2,177 (+12%) | 3mo | $189,000 | $87 | 56 |
| 5702 Stonehaven Ln | 0.62mi | 3/2.0 | 1,777 (-9%) | 13mo | $225,000 | $127 | 46 |
| 1077 Spanish Mission Trl | 0.72mi | 3/2.0 | 1,750 (-10%) | 13mo | $210,000 | $120 | 39 |
| 113 Overhill Dr | 0.53mi | 4/2.0 (+1) | 1,684 (-14%) | 12mo | $260,000 | $154 | 38 |
Match score weights: distance 35% · size 25% · config 20% · recency 20%. Top-matched comps best support the ARV.
Projected returns pro-forma
-3.0% appreciation · 8.0% rent growth · sell at horizon
- IRR
- -3.9%
- Equity multiple
- 0.85×
- Total profit
- $-11,171
- Equity at exit
- $38,767
- IRR
- 10.4%
- Equity multiple
- 1.97×
- Total profit
- $70,872
- Equity at exit
- $22,480
Cash invested: $72,800 (down + closing). Projections, not guarantees.
Landlord ↔ Tenant lean methodology
- Overall (STATE)
- 90 Strongly Landlord-Friendly
- State Louisiana
- 90 Strongly Landlord-Friendly · R+12
- County
- — inherits STATE
- City
- — inherits STATE
ZIP-level market 70605
- Rents YoY
- 15.1%
- Active inventory
- 456
- Price-to-rent
- 9.1×
Monthly cashflow live
- Estimated rent
- $2,376 medium interval (Pro) →
- Mortgage (P&I)
- −$1,363
- Tax from tax record
- −$115 /mo · $1,383/yr
- Insurance
- −$108
- HOA
- −$0
- Vacancy / Maint / Mgmt
- −$499
- Net cashflow
- $290
Break-even live
UW: 25.0% down · 7.5% · 30yr · 1.5% tax · 5.0% vac · 8.0% maint · 8.0% mgmt
Financing live
Cash to close
- Down payment
- $65,000
- Closing costs
- $7,800
- Reserves months
- —
- Total cash needed
- —
Loan-product check · same deal, 3 products live
Conventional
25% down · 7.5% · 30yr
- Down + closing
- —
- Monthly P&I
- —
- Monthly cashflow
- —
- DSCR
- —
- Eligible?
- —
Personal DTI + credit; lowest rate.
DSCR
20% down · 8.5% · 30yr
- Down + closing
- —
- Monthly P&I
- —
- Monthly cashflow
- —
- DSCR
- —
- Eligible?
- —
No personal income docs; deal must DSCR.
Hard money
10% down · 12.0% · 12mo
- Down + closing
- —
- Monthly P&I
- —
- Monthly cashflow
- —
- DSCR
- —
- Eligible?
- —
Short-term bridge; refi at stabilization.
Rent comps 2 comps
| Address | Beds | Baths | Sqft | Rent | $/sqft | DOM | Units | Dist |
|---|---|---|---|---|---|---|---|---|
| 155 Heather St Lake Charles, LA | 3.0 | 2.0 | 1316 | $1,650 | $1.25 | 13d | 1 | 0.22mi |
| 716 Dianne Ln Lake Charles, LA | 3.0 | 2.0 | 2200 | $5,000 | $2.27 | 43d | 1 | 0.37mi |
Listing history 13 events
-
2026-06-19days on market $260,000 Active 16 DOM
-
2026-06-18days on market $260,000 Active 15 DOM
-
2026-06-17days on market $260,000 Active 14 DOM
-
2026-06-16days on market $260,000 Active 13 DOM
-
2026-06-15days on market $260,000 Active 12 DOM
-
2026-06-14days on market $260,000 Active 10 DOM
-
2026-06-13days on market $260,000 Active 9 DOM
-
2026-06-10days on market $260,000 Active 7 DOM
-
2026-06-09days on market $260,000 Active 6 DOM
-
2026-06-08days on market $260,000 Active 5 DOM
-
2026-06-07days on market $260,000 Active 4 DOM
-
2026-06-05remarks 699-char remark
-
2026-06-05$260,000 Active 1 DOM
ⓘ Source: listings_history table (triggers on properties + properties_extension) + one-shot
backfill from property_details.listing_events for pre-trigger history.
Tax reassessment forecast LA · Resets to sale price
- Current annual tax
- $1,383 · $115/mo
- Projected year-2 tax
- $1,430 · $119/mo
- Expected delta
- +$47/yr (+$4/mo · 3.4%)
ⓘ Screening estimate from a state-policy table — verify with the county assessor before closing.
Climate risk First Street
- Flood 3/10 Moderate FEMA zone X (unshaded) · 12% chance over 30 yrs
- Wildfire 1/10 Low
- Heat 9/10 Extreme 7 d/yr ≥109°F today · 20 d/yr by 30 yrs out
- Wind 9/10 Extreme 99% chance of damaging wind over 30 yrs
- Air quality 2/10 Low 1 unhealthy d/yr today · 1 by 30 yrs out
Nearby sold comps map
Loading sold comps map…
Walkable amenities ~0.75 mi
Loading nearby amenities…
Taxation est. · year 1
- Rental income
- $28,518
- − Mortgage interest
- −$14,564
- − Property taxes
- −$1,383
- − Insurance
- −$1,300
- − Repairs & maintenance
- −$2,281
- − Management
- −$2,281
- − Depreciation
- −$7,564
- Taxable loss
- −$856
- Est. tax savings @ 24.0%
- +$205
- After-tax cash flow
- $3,690/yr
For passive investors: Depreciation is non-cash, so a rental often shows a tax loss while cash-flowing — sheltering income. Rental losses are passive: they offset passive income freely, and up to $25,000/yr can offset ordinary (W-2) income if you actively participate and your MAGI is under $100k (phasing out to $0 by $150k); unused losses carry forward. On sale, claimed depreciation is recaptured at up to 25%, and gains may owe capital-gains tax (a 1031 exchange can defer both). Figures are a year-1 estimate at your 24.0% rate — not tax advice; consult a CPA.
Schools (NCES district)
- District
- Calcasieu Parish
- NCES district ID
- 2200330
- Math proficiency
- 30% ▼ -39.00%
- Reading proficiency
- 44% ▼ -33.00%
- Median HH income
- $44,700
- Composite
- 31.45/100
- National rank
- #5979
- State rank
- #29 of 98 in LA
Livability — Lake Charles
- Score
- 68/100
- State rank
- #95
- US rank
- #9820
Category grades
Schools grade is shown separately in the Schools card above.
Census & demographics
- Census place
- Lake Charles, LA
- County
- Calcasieu Parish · 170,889 people
- City population
- 133,538
- Metro
- Lake Charles, LA
- Population (ZIP)
- 40,482
- Household income
- $86,015
- Rent vs Own
- Severe rent burden
- 1328.0
Population outlook (Calcasieu County) Hauer SSP2
- Today (2025)
- 212,179 people
- By 2030
- 218,199 · +2.8%
- By 2040
- 228,486 · +7.7%
- By 2050
- 236,208 · +11.3%
- By 2075
- 251,696 · +18.6%
- By 2100
- 247,848 · +16.8%
Race, ethnicity, and origin ACS 2023
- Neighborhood character
- Predominantly White (79%)
- Race & ethnicity
- White 79% Black 10% Hispanic / Latino 6% Two or more races 6% Asian 3%
- Hispanic origin (detail)
- Mexican 2%
- Common ancestry
- Lithuanian 12% Italian 3% Slovak 2%
- Foreign-born
- 6% · Canada, Jamaica
- Languages at home
- 92% English-only · Spanish 4% Other Indo-European 2% Other Asian/Pacific 1%
Political lean MEDSL · Calcasieu
- 2024 margin
- Solid R (+39.6) · D 29.5% · R 69.0% · Other 1.5%
- 2008→2024 swing
- -15.0pp toward R · 2008: -24.6pp · 2024: -39.6pp
- All cycles
- 2024: R+39.6 2020: R+35.2 2016: R+33.3 2012: R+28.7 2008: R+24.6
Not yet ingested
- Civics
- —
Market trends
- HPI YoY
- ▼ -102.68%
- Current HPI
- 105.1903
- Rent YoY
- ▲ 15.10%
- Metro
- Lake Charles, LA
- State GDP YoY
- ▲ 3.29%
- F500 in state
- 10
Industry mix (Fortune 500 HQ in LA)
| Industry | F500 HQs | Revenue |
|---|---|---|
| Telecommunications | 2 | $23B |
|
||
| Utilities | 1 | $12B |
|
||
| Wholesale / Distribution | 1 | $5B |
|
||
| Advertising | 1 | $2B |
|
||
Price history
+147.9% since first listed9 events — show timeline
- 2026-06-04 Listed $260,000 SWLAR
- 2022-07-28 Sold (Public Records) $229,000 Public Records
- 2022-07-28 Sold (MLS) — SWLAR
- 2022-06-21 Listed $239,000 SWLAR
- 2016-11-09 Sold (Public Records) $194,000 Public Records
- 2016-11-08 Sold (MLS) — SWLAR
- 2016-09-01 Listed $199,900 SWLAR
- 2012-06-19 Sold (Public Records) $155,000 Public Records
- 2000-05-04 Sold (Public Records) $104,900 Public Records
Property tax history
+0.1%/yrLatest (2025): $1,383 · +2.4% YoY. Source: county tax records.
Cash-flow waterfall
monthlySold comps — $/sqft
last 12 mo · ≤1 miLoading sold comps…