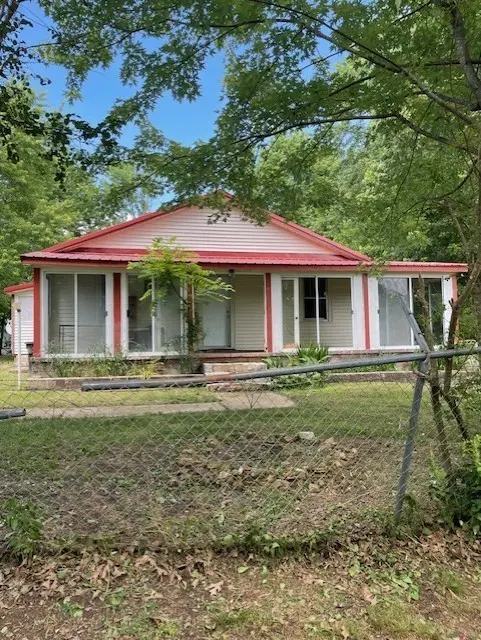
103 E High St · Ethridge, TN
Flood risk 1/10 · Minimal
- FEMA flood zone
- X (unshaded)
- Chance of flooding over 30 yrs
- 0.0%
- Est. flood insurance / yr
- $473 – $860
Fire risk 4/10 · Minor
- Est. fire insurance / yr
- $949 – $1,763
Heat risk 5/10 · Moderate
- Hot days now (above 103°F)
- 7 days/yr
- Hot days in 30 yrs
- 20 days/yr
Wind risk 4/10 · Minor
- Chance of severe wind over 30 yrs
- 20.0%
Air-quality risk 1/10 · Minimal
- Unhealthy air days now
- 0 days/yr
- Unhealthy air days in 30 yrs
- 0 days/yr
Risk factors via First Street. Map © Google.
Why this score? — see what drove the D grade
The composite is a weighted blend of 9 inputs, each scored 0–100. Each bar is that input's sub-score; the figure is the points it added to the 100-point composite (weight × sub-score).
- Cash flow +10.6/30.0
- Appreciation +10.0/10.0
- ARV discount +7.5/15.0
- 1% rule +3.1/10.0
- DSCR +3.1/10.0
- Livability +2.9/5.0
- Rent growth +2.5/5.0
- Condition / age +2.5/5.0
- Schools +2.4/10.0
$130,000
🖨 Deal sheet (PDF) 📄 Offer letter ✓ Due diligence
Listing remarks MLS
This home can be bought in a package for investors, 11 homes total or can be purchased individual. Cute as can be in the heart of Ethridge. Renovated with a wrap-around porch, storm cellar and concrete shop This home has 3 bedrooms and 1 bath, Great location Rented monthly for $900.00 per month
Key facts
- Wrap around porch
- Concrete shop
- Great location
Tags
Property features AI
Finance
- HOA & community: Pets allowed
Exterior
- Parking: No covered parking indicated; No total parking spaces indicated
- Utilities: Public water; Public sewer; Electricity available
- Home design: Single-family residence; One level; Residential property
- Construction: Vinyl siding construction; Existing structure
- Exterior features: Lot roughly 0.2 acres (approx. 100 x 143); Vinyl siding
Interior
- Kitchen: Built-in electric range
- Bedrooms: 3 bedrooms (all on the main level); Bedroom sizes approximately 11x10, 10x11 and 10x10
- Flooring: Wood flooring
- Bathrooms: 1 full bathroom
- Heating & cooling: Electric heating; Electric cooling
- Interior features: Built-in electric range; Wood flooring; No basement
Neighborhood map
What this means for you Summary
Snapshot
- This is a 3-bed/1.0-bath single-family listed at $130k.
Deal economics
- At list price, monthly cash flow is $-64 ($-771/yr) — negative.
- To cash-flow at today's rent, offer at most $121k (7.2% below list).
- To meet the 1% rule (rent ≥ 1% of price), the offer needs to be $106k (18.8% below list).
- Recommended offer: $106k (18.8% below list) — sets the bar for 1% rule.
Location & tenants
- Location reads 58/100 on livability (#308 in TN) — a working-class tenant base; expect higher turnover. Strengths: cost of living A+, housing A+; Watch: health & safety C-, crime F, amenities F.
- Lawrence County (rural): math 29% / reading 29% proficiency, ranked #67 of 139 in TN (top 48%) — low school quality limits family demand, transient renter base, plan for 1-2y turnover.
- Zoned schools: Ethridge Elementary (math 31% / reading 37%, grade F, #351 of 952 statewide, top 37%, 498 students, 0% FRL); E O Coffman Middle School (math 23% / reading 26%, grade F, #154 of 333 statewide, top 48%, 582 students, 0% FRL); Lawrence Co High School (math 26% / reading 23%, grade F, #129 of 332 statewide, top 43%, 1,143 students, 0% FRL) — zoned schools average 0% FRL vs 50% district-wide (50 pts lower); this property's tenant base skews higher-income than the district average.
- Market conditions: 26 active listings in the ZIP; 27 units permitted in Lawrence County in 2024 (0 in 5+ unit buildings).
Forward outlook
- In year one you build about $14k of equity ($899 loan paydown + $13k appreciation (10.0% local appreciation)).
- Lawrence County population projected to shrink 4% by 2050 — rents likely to lag national; underwrite the cash flow, not the appreciation.
- At projected returns (10.0% appreciation + 3.0% rent growth), your $36k cash investment doubles in ~3 years — after that, you're playing with house money.
- By year 3, paydown + projected appreciation supports a ~$35k cash-out refi (75% LTV) — recoverable capital for the next deal without selling this one.
Negotiation context
- It's been on market 19 days — a 2% lower offer ($128k) is reasonable based on typical stale-listing flexibility.
- 6 sale attempts with the ask held roughly flat each time — persistent listings suggest the price (not the market) is what's stuck; bring a comps-based counter.
- Current owner paid $20k; list at $130k implies a 550% gain — meaningful room to come down on a strong offer.
Risks & watch-outs
- Watch-outs: built in 1940 — expect roof / HVAC / electrical / plumbing capex.
- Climate carrying-cost: extreme-heat days projected 7→20/yr by 2055 (HVAC capex compounding) — expect insurance premiums to compound above CPI over the hold.
Questions for the listing agent
- What do current leases actually rent for vs. the listed asking? Can we see a recent rent roll and the last 12 months of T-12 income?
- Built in 1940 — when were the roof, HVAC, electrical panel, plumbing, and water heater last replaced?
- Is there a deadline driving the sale (1031 exchange, divorce, estate, relocation)? That informs how much negotiation room exists.
- Schools are D-rated, which usually means shorter tenancies and higher turnover. Who's the typical renter profile here, and what's been the actual vacancy rate?
- Crime grade is F in this area — have there been break-ins, vandalism, or insurance claims at this property in the last 3 years? What carrier currently insures it and at what premium?
- The area grade is low — what's the realistic commute time and amenity access for the typical tenant pool here? Any planned neighborhood developments (good or bad) we should know about?
- What's the average days-on-market for RENTAL listings here right now (not sales)? A rising rental-DOM trend means longer vacancies and softer asking-rent achievability than the comps imply.
- What's the recent tenant-quality profile in this submarket — average credit score on applications, eviction rate, late-payment / NSF rate, and stable-employment percentage? A property-management company in the area should have these aggregated.
- How much new for-sale + rental construction is in the pipeline within 1–3 miles? Heavy new supply typically softens prices + rents 12–24 months out; constrained supply supports both.
Investment metrics
- 1% rule
- 0.81% ✗
- Cap rate
- 5.70%
- Cash-on-cash
- -2.12%
- DSCR
- 0.91
- GRM
- 10.3
CMA / ARV
No comps found within radius.
Projected returns pro-forma
10.0% appreciation · 3.0% rent growth · sell at horizon
- IRR
- 22.8%
- Equity multiple
- 2.83×
- Total profit
- $66,725
- Equity at exit
- $117,114
- IRR
- 20.4%
- Equity multiple
- 6.49×
- Total profit
- $199,744
- Equity at exit
- $252,561
Cash invested: $36,400 (down + closing). Projections, not guarantees.
Landlord ↔ Tenant lean methodology
- Overall (STATE)
- 87 Strongly Landlord-Friendly
- State Tennessee
- 87 Strongly Landlord-Friendly · R+13
- County
- — inherits STATE
- City
- — inherits STATE
ZIP-level market 38456
- Home prices YoY
- 12.2%
- Active inventory
- 26
- Price-to-rent
- 10.3×
Monthly cashflow live
- Estimated rent
- $1,056 medium interval (Pro) →
- Mortgage (P&I)
- −$682
- Tax est. 1.5%
- −$162 /mo · $1,950/yr
- Insurance
- −$54
- HOA
- −$0
- Vacancy / Maint / Mgmt
- −$222
- Net cashflow
- $-64
Break-even live
Sensitivity live
| Price | -10% $26 | -5% $-19 | +0% $-64 | +5% $-109 | +10% $-154 |
|---|---|---|---|---|---|
| Rent | -10% $-148 | -5% $-106 | +0% $-64 | +5% $-23 | +10% $19 |
| Rate | -1.0pp $1 | -0.5pp $-31 | base $-64 | +0.5pp $-98 | +1.0pp $-132 |
UW: 25.0% down · 7.5% · 30yr · 1.5% tax · 5.0% vac · 8.0% maint · 8.0% mgmt
Financing live
Cash to close
- Down payment
- $32,500
- Closing costs
- $3,900
- Reserves months
- —
- Total cash needed
- —
Loan-product check · same deal, 3 products live
Conventional
25% down · 7.5% · 30yr
- Down + closing
- —
- Monthly P&I
- —
- Monthly cashflow
- —
- DSCR
- —
- Eligible?
- —
Personal DTI + credit; lowest rate.
DSCR
20% down · 8.5% · 30yr
- Down + closing
- —
- Monthly P&I
- —
- Monthly cashflow
- —
- DSCR
- —
- Eligible?
- —
No personal income docs; deal must DSCR.
Hard money
10% down · 12.0% · 12mo
- Down + closing
- —
- Monthly P&I
- —
- Monthly cashflow
- —
- DSCR
- —
- Eligible?
- —
Short-term bridge; refi at stabilization.
Listing history 14 events
-
2026-06-21days on market $130,000 Active 19 DOM
-
2026-06-21days on market $130,000 Active 18 DOM
-
2026-06-18days on market $130,000 Active 16 DOM
-
2026-06-17days on market $130,000 Active 15 DOM
-
2026-06-16days on market $130,000 Active 14 DOM
-
2026-06-15days on market $130,000 Active 13 DOM
-
2026-06-13days on market $130,000 Active 11 DOM
-
2026-06-12days on market $130,000 Active 10 DOM
-
2026-06-09days on market $130,000 Active 7 DOM
-
2026-06-08days on market $130,000 Active 6 DOM
-
2026-06-08days on market $130,000 Active 5 DOM
-
2026-06-07days on market $130,000 Active 4 DOM
-
2026-06-03remarks 265-char remark
-
2026-06-03$130,000 Active 1 DOM
ⓘ Source: listings_history table (triggers on properties + properties_extension) + one-shot
backfill from property_details.listing_events for pre-trigger history.
Climate risk First Street
- Flood 1/10 Low FEMA zone X (unshaded) · 0% chance over 30 yrs
- Wildfire 4/10 Moderate
- Heat 5/10 Major 7 d/yr ≥103°F today · 20 d/yr by 30 yrs out
- Wind 4/10 Moderate 20% chance of damaging wind over 30 yrs
- Air quality 1/10 Low 0 unhealthy d/yr today · 0 by 30 yrs out
Nearby sold comps map
Loading sold comps map…
Walkable amenities ~0.75 mi
Loading nearby amenities…
Taxation est. · year 1
- Rental income
- $12,671
- − Mortgage interest
- −$7,282
- − Property taxes
- −$1,950
- − Insurance
- −$650
- − Repairs & maintenance
- −$1,014
- − Management
- −$1,014
- − Depreciation
- −$3,782
- Taxable loss
- −$3,021
- Est. tax savings @ 24.0%
- +$725
- After-tax cash flow
- $-46/yr
For passive investors: Depreciation is non-cash, so a rental often shows a tax loss while cash-flowing — sheltering income. Rental losses are passive: they offset passive income freely, and up to $25,000/yr can offset ordinary (W-2) income if you actively participate and your MAGI is under $100k (phasing out to $0 by $150k); unused losses carry forward. On sale, claimed depreciation is recaptured at up to 25%, and gains may owe capital-gains tax (a 1031 exchange can defer both). Figures are a year-1 estimate at your 24.0% rate — not tax advice; consult a CPA.
Schools (NCES district)
- District
- Lawrence County
- NCES district ID
- 4702340
- Math proficiency
- 29% ▼ -11.00%
- Reading proficiency
- 29% ▼ -8.00%
- Median HH income
- $37,613
- Composite
- 24.2/100
- National rank
- #7729
- State rank
- #67 of 139 in TN
Livability — Ethridge
- Score
- 58/100
- State rank
- #308
- US rank
- #20983
Category grades
Schools grade is shown separately in the Schools card above.
Census & demographics
- Census place
- Ethridge, TN
- Population (ZIP)
- 4,600
Population outlook (Lawrence County) Hauer SSP2
- Today (2025)
- 42,724 people
- By 2030
- 42,627 · -0.2%
- By 2040
- 42,144 · -1.4%
- By 2050
- 40,800 · -4.5%
- By 2075
- 36,643 · -14.2%
- By 2100
- 29,193 · -31.7%
Race, ethnicity, and origin ACS 2023
- Neighborhood character
- Predominantly White (97%)
- Race & ethnicity
- White 97% Two or more races 2% Hispanic / Latino 1%
- Common ancestry
- Slovak 3% Italian 3% Iranian 2%
- Foreign-born
- 1% · Canada
- Languages at home
- 81% English-only · German/W. Germanic 18% Spanish 1%
Political lean MEDSL · Lawrence
- 2024 margin
- Solid R (+69.1) · D 15.1% · R 84.1%
- 2008→2024 swing
- -35.3pp toward R · 2008: -33.7pp · 2024: -69.1pp
- All cycles
- 2024: R+69.1 2020: R+64.8 2016: R+61.3 2012: R+42.9 2008: R+33.7
Not yet ingested
- Civics
- —
Market trends
- HPI YoY
- ▲ 42.31%
- Current HPI
- 388.7921
- Rent YoY
- —
- Metro
- —
- State GDP YoY
- ▲ 2.78%
- F500 in state
- 22
Industry mix (Fortune 500 HQ in TN)
| Industry | F500 HQs | Revenue |
|---|---|---|
| Healthcare | 3 | $91B |
|
||
| Retail | 3 | $72B |
|
||
| Transportation / Logistics | 1 | $88B |
|
||
| Paper / Packaging | 1 | $19B |
|
||
| Insurance | 1 | $13B |
|
||
| Energy | 1 | $12B |
|
||
Price history
+550.0% since first listed12 events — show timeline
- 2026-06-02 Listed $130,000 REALTRACS as Distributed by MLS Grid
- 2026-03-10 Listing Removed — REALTRACS as Distributed by MLS Grid
- 2026-02-24 Listed $130,000 REALTRACS as Distributed by MLS Grid
- 2026-02-14 Listing Removed — REALTRACS as Distributed by MLS Grid
- 2026-01-06 Relisted — REALTRACS as Distributed by MLS Grid
- 2025-12-08 Contingent — REALTRACS as Distributed by MLS Grid
- 2025-12-08 Relisted — REALTRACS as Distributed by MLS Grid
- 2025-11-30 Listing Removed — REALTRACS as Distributed by MLS Grid
- 2025-11-13 Relisted — REALTRACS as Distributed by MLS Grid
- 2025-10-20 Pending — REALTRACS as Distributed by MLS Grid
- 2025-05-29 Listed $130,000 REALTRACS as Distributed by MLS Grid
- 2013-03-05 Sold (Public Records) $20,000 Public Records
Property tax history
+2.8%/yrLatest (2025): $151 · +0.0% YoY. Source: county tax records.
Cash-flow waterfall
monthlySold comps — $/sqft
last 12 mo · ≤1 miLoading sold comps…