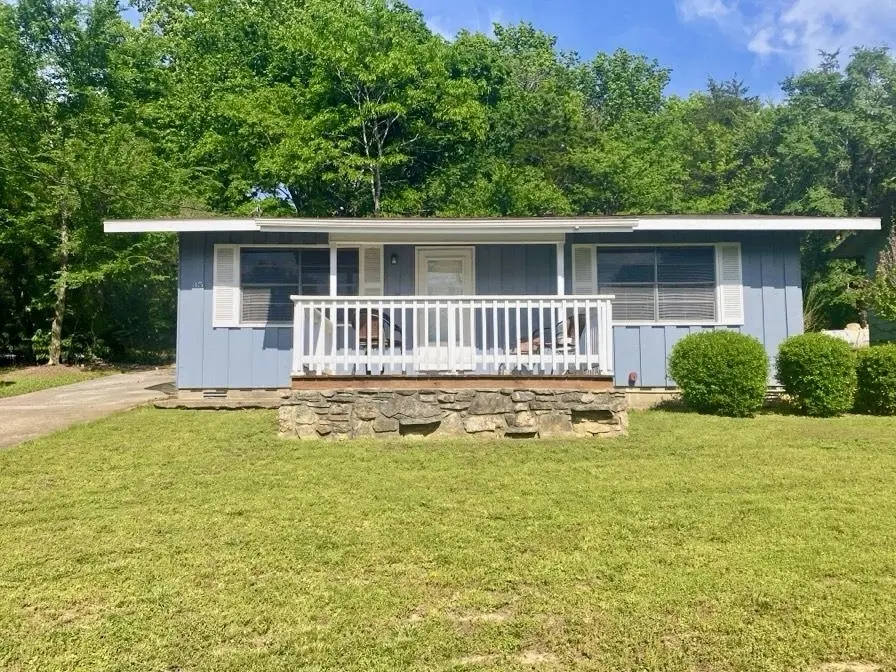
35 E Lakeshore · Cherokee Village, AR
Flood risk 1/10 · Minimal
- FEMA flood zone
- X (unshaded)
- Chance of flooding over 30 yrs
- 0.0%
- Est. flood insurance / yr
- $507 – $1,088
Fire risk 3/10 · Minor
- Est. fire insurance / yr
- $1,499 – $2,785
Heat risk 5/10 · Moderate
- Hot days now (above 108°F)
- 7 days/yr
- Hot days in 30 yrs
- 20 days/yr
Wind risk 2/10 · Minimal
- Chance of severe wind over 30 yrs
- 3.0%
Air-quality risk 1/10 · Minimal
- Unhealthy air days now
- 0 days/yr
- Unhealthy air days in 30 yrs
- 0 days/yr
Risk factors via First Street. Map © Google.
Why this score? — see what drove the C- grade
The composite is a weighted blend of 9 inputs, each scored 0–100. Each bar is that input's sub-score; the figure is the points it added to the 100-point composite (weight × sub-score).
- Cash flow +20.6/30.0
- ARV discount +9.3/15.0
- DSCR +6.6/10.0
- 1% rule +5.4/10.0
- Schools +3.4/10.0
- Livability +3.1/5.0
- Rent growth +2.5/5.0
- Condition / age +2.5/5.0
- Appreciation +0.0/10.0
$127,000
🖨 Deal sheet (PDF) 📄 Offer letter ✓ Due diligence
Listing remarks
Welcome to market 35 E. Lakeshore in Cherokee Village! This is a beautiful 2 bedroom, 1 bathroom home with lake views. Upon entering the home, you will be welcomed by a spacious living room. To the right, you will find 2 bedrooms, and a bathroom. This home also features a large eat in kitchen perfect for any chef! Outside, you will find a spacious yard and a large deck perfect for enjoying morning coffee while looking at the lake views. This home is just minutes away from lake access, Spring River, and shopping in historic downtown Hardy. This home comes partially furnished so it is perfect as a turn key forever home or as an air bnb! This home won't last long so call today to schedule your
Key facts
- Spacious yard
- Large deck
- Large eat in kitchen
Tags
Property features AI
Finance
- Other: Approx. lot size 0.18 acres; Approx. living area 884 (source: tax records)
- Financial info: Financing options include VA, FHA, Conventional, Cash, and USDA/Rural Development
Exterior
- Parking: Carport
- Utilities: Public water; Septic
- Home design: Wood exterior
- Construction: 3-tab shingle roof; Crawl space foundation
- Exterior features: Deck; Paved road access; Sloped lot; Located inside city limits
Interior
- Kitchen: Electric range
- Flooring: Carpet; Vinyl
- Bathrooms: 1 full bathroom
- Heating & cooling: Central heat; Central cooling
- Interior features: Furnished; Washer connection
- Laundry & utility: Washer connection
Neighborhood map
What this means for you Summary
Snapshot
- This is a 2-bed/1.0-bath single-family listed at $127k.
Deal economics
- At list price, monthly cash flow is $171 ($2k/yr) — positive.
- The deal already cash-flows at list — no discount required.
- Meets the 1% rule at list price ($1k rent vs $127k).
- Cap rate 7.9% vs local median 5.7% in Cherokee Village — top-decile yield for the area; either an underpriced asset or a hidden risk that comps aren't pricing in. Stress-test before assuming the spread holds.
Location & tenants
- Location reads 62/100 on livability (#227 in AR) — a middle-class / working-renter tenant base. Strengths: cost of living A+, crime A, housing B+; Watch: amenities F, commute F, employment F.
- Highland School District (town): math 43% / reading 39% proficiency, ranked #66 of 238 in AR (top 28%) — families likely to look elsewhere, expect single-tenant / working-renter base with shorter leases.
- Zoned schools: Highland High School (math 31% / reading 44%, grade F, #62 of 292 statewide, top 21%, 526 students, 100% FRL) — zoned schools average 100% FRL vs 56% district-wide (44 pts higher); higher-poverty schools than district average — tighter screening recommended.
- Market conditions: 692 active listings in the ZIP; 4 units permitted in Sharp County in 2024 (0 in 5+ unit buildings).
Forward outlook
- Local home prices are declining (-3.0%/yr); year-one equity from $878 of loan paydown is wiped out by about $4k of value loss. Plan a longer hold.
- Sharp County population projected at -11% by 2050 — secular population decline; favor cash flow + early exit over multi-decade hold.
Negotiation context
- Only 9 days on market — expect competitive offers; lowballing is unlikely to land.
- Current owner paid $45k; list at $127k implies a 179% gain — meaningful room to come down on a strong offer.
Risks & watch-outs
- Climate carrying-cost: extreme-heat days projected 7→20/yr by 2055 (HVAC capex compounding) — expect insurance premiums to compound above CPI over the hold.
Questions for the listing agent
- Built in 1978 — when were the roof, HVAC, electrical panel, plumbing, and water heater last replaced?
- Is there a deadline driving the sale (1031 exchange, divorce, estate, relocation)? That informs how much negotiation room exists.
- Schools are F-rated, which usually means shorter tenancies and higher turnover. Who's the typical renter profile here, and what's been the actual vacancy rate?
- What's the average days-on-market for RENTAL listings here right now (not sales)? A rising rental-DOM trend means longer vacancies and softer asking-rent achievability than the comps imply.
- What's the recent tenant-quality profile in this submarket — average credit score on applications, eviction rate, late-payment / NSF rate, and stable-employment percentage? A property-management company in the area should have these aggregated.
- How much new for-sale + rental construction is in the pipeline within 1–3 miles? Heavy new supply typically softens prices + rents 12–24 months out; constrained supply supports both.
Investment metrics
- 1% rule
- 1.04% ✓
- Cap rate
- 7.90%
- Cash-on-cash
- 5.76%
- DSCR
- 1.26
- GRM
- 8.0
CMA / ARV
- ARV (median comp)
- $132,160
- List price
- $127,000
- Delta
- -3.90%
- Verdict
- FAIR
- Comps
- 20 within 1.0 mi
Show comp detail 9 sales within ~0.75 mi
| Address | Dist | Beds/Ba | Sqft | Sold | Price | $/sf | Match |
|---|---|---|---|---|---|---|---|
| 14 Broken Bow Dr | 0.19mi | 2/1.0 | 860 (-3%) | 8mo | $110,000 | $128 | 80 |
| 32 Shawnee Dr | 0.52mi | 2/1.0 | 868 (-2%) | 7mo | $35,000 | $40 | 67 |
| 3 Cisco Cir | 0.64mi | 2/1.0 | 848 (-4%) | 9mo | $87,500 | $103 | 56 |
| 3 Geronimo Dr | 0.71mi | 2/1.5 | 899 (+2%) | 8mo | $100,000 | $111 | 55 |
| 106 E Lakeshore Dr | 0.44mi | 2/1.0 | 768 (-13%) | 8mo | $123,000 | $160 | 51 |
| 99 E Lakeshore Dr | 0.33mi | 3/2.0 (+1) | 1,008 (+14%) | 2mo | $151,500 | $150 | 51 |
| 113 E Lakeshore Dr | 0.49mi | 2/1.0 | 1,000 (+13%) | 6mo | $144,900 | $145 | 50 |
| 113 E Lk | 0.51mi | 2/2.0 | 1,000 (+13%) | 6mo | $144,900 | $145 | 46 |
| 3 Dakota Dr | 0.56mi | 2/1.0 | 984 (+11%) | 24mo | $122,400 | $124 | 35 |
Match score weights: distance 35% · size 25% · config 20% · recency 20%. Top-matched comps best support the ARV.
Projected returns pro-forma
-3.0% appreciation · 3.0% rent growth · sell at horizon
- IRR
- -7.4%
- Equity multiple
- 0.73×
- Total profit
- $-9,694
- Equity at exit
- $18,936
- IRR
- 2.2%
- Equity multiple
- 1.16×
- Total profit
- $5,630
- Equity at exit
- $10,981
Cash invested: $35,560 (down + closing). Projections, not guarantees.
Landlord ↔ Tenant lean methodology
- Overall (STATE)
- 92 Strongly Landlord-Friendly
- State Arkansas
- 92 Strongly Landlord-Friendly · R+14
- County
- — inherits STATE
- City
- — inherits STATE
ZIP-level market 72529
- Home prices YoY
- -18.2%
- Active inventory
- 692
- Price-to-rent
- 8.0×
Monthly cashflow live
- Estimated rent
- $1,327 medium interval (Pro) →
- Mortgage (P&I)
- −$666
- Tax est. 1.5%
- −$159 /mo · $1,905/yr
- Insurance
- −$53
- HOA
- −$0
- Vacancy / Maint / Mgmt
- −$279
- Net cashflow
- $171
Break-even live
Sensitivity live
| Price | -10% $258 | -5% $214 | +0% $171 | +5% $127 | +10% $83 |
|---|---|---|---|---|---|
| Rent | -10% $66 | -5% $118 | +0% $171 | +5% $223 | +10% $275 |
| Rate | -1.0pp $235 | -0.5pp $203 | base $171 | +0.5pp $138 | +1.0pp $104 |
UW: 25.0% down · 7.5% · 30yr · 1.5% tax · 5.0% vac · 8.0% maint · 8.0% mgmt
Financing live
Cash to close
- Down payment
- $31,750
- Closing costs
- $3,810
- Reserves months
- —
- Total cash needed
- —
Loan-product check · same deal, 3 products live
Conventional
25% down · 7.5% · 30yr
- Down + closing
- —
- Monthly P&I
- —
- Monthly cashflow
- —
- DSCR
- —
- Eligible?
- —
Personal DTI + credit; lowest rate.
DSCR
20% down · 8.5% · 30yr
- Down + closing
- —
- Monthly P&I
- —
- Monthly cashflow
- —
- DSCR
- —
- Eligible?
- —
No personal income docs; deal must DSCR.
Hard money
10% down · 12.0% · 12mo
- Down + closing
- —
- Monthly P&I
- —
- Monthly cashflow
- —
- DSCR
- —
- Eligible?
- —
Short-term bridge; refi at stabilization.
Listing history 7 events
-
2026-05-05status Under Contract 713-char remark
-
2026-04-27$127,000 New Listing 713-char remark
-
2012-10-18soldstatus $45,476
-
1996-05-10soldstatus $32,000
-
1994-01-24soldstatus $28,000
-
1992-08-17soldstatus $27,000
-
1988-05-13soldstatus $19,000
ⓘ Source: listings_history table (triggers on properties + properties_extension) + one-shot
backfill from property_details.listing_events for pre-trigger history.
Climate risk First Street
- Flood 1/10 Low FEMA zone X (unshaded) · 0% chance over 30 yrs
- Wildfire 3/10 Moderate
- Heat 5/10 Major 7 d/yr ≥108°F today · 20 d/yr by 30 yrs out
- Wind 2/10 Low 3% chance of damaging wind over 30 yrs
- Air quality 1/10 Low 0 unhealthy d/yr today · 0 by 30 yrs out
Nearby sold comps map
Loading sold comps map…
Walkable amenities ~0.75 mi
Loading nearby amenities…
Taxation est. · year 1
- Rental income
- $15,923
- − Mortgage interest
- −$7,114
- − Property taxes
- −$1,905
- − Insurance
- −$635
- − Repairs & maintenance
- −$1,274
- − Management
- −$1,274
- − Depreciation
- −$3,695
- Taxable income
- $27
- Est. tax owed @ 24.0%
- −$6
- After-tax cash flow
- $2,041/yr
For passive investors: Depreciation is non-cash, so a rental often shows a tax loss while cash-flowing — sheltering income. Rental losses are passive: they offset passive income freely, and up to $25,000/yr can offset ordinary (W-2) income if you actively participate and your MAGI is under $100k (phasing out to $0 by $150k); unused losses carry forward. On sale, claimed depreciation is recaptured at up to 25%, and gains may owe capital-gains tax (a 1031 exchange can defer both). Figures are a year-1 estimate at your 24.0% rate — not tax advice; consult a CPA.
Schools (NCES district)
- District
- Highland School District
- NCES district ID
- 0507770
- Math proficiency
- 43% ▼ -7.00%
- Reading proficiency
- 39% ▼ -9.00%
- Median HH income
- $32,066
- Composite
- 33.63/100
- National rank
- #5400
- State rank
- #66 of 238 in AR
Livability — Cherokee Village
- Score
- 62/100
- State rank
- #227
- US rank
- #17211
Category grades
Schools grade is shown separately in the Schools card above.
Census & demographics
- Census place
- Cherokee Village, AR
- City population
- 5,090
- Population (ZIP)
- 5,090
Population outlook (Sharp County) Hauer SSP2
- Today (2025)
- 16,170 people
- By 2030
- 15,711 · -2.8%
- By 2040
- 14,974 · -7.4%
- By 2050
- 14,420 · -10.8%
- By 2075
- 13,235 · -18.2%
- By 2100
- 11,492 · -28.9%
Race, ethnicity, and origin ACS 2023
- Neighborhood character
- Predominantly White (90%)
- Race & ethnicity
- White 90% Two or more races 5% Hispanic / Latino 4% Native American 2%
- Common ancestry
- Lithuanian 6% Italian 3% Romanian 3%
- Foreign-born
- 1%
Political lean MEDSL · Sharp
- 2024 margin
- Solid R (+62.7) · D 17.7% · R 80.4% · Other 1.9%
- 2008→2024 swing
- -33.7pp toward R · 2008: -28.9pp · 2024: -62.7pp
- All cycles
- 2024: R+62.7 2020: R+60.0 2016: R+54.7 2012: R+38.8 2008: R+28.9
Not yet ingested
- Civics
- —
Market trends
- HPI YoY
- ▼ -40.53%
- Current HPI
- 182.4438
- Rent YoY
- —
- Metro
- —
- State GDP YoY
- ▲ 3.80%
- F500 in state
- 10
Industry mix (Fortune 500 HQ in AR)
| Industry | F500 HQs | Revenue |
|---|---|---|
| Retail | 1 | $681B |
|
||
| Food / Agriculture | 1 | $53B |
|
||
| Retail / Energy | 1 | $22B |
|
||
| Transportation / Logistics | 1 | $12B |
|
||
| Energy | 1 | $4B |
|
||
Price history
+568.4% since first listed7 events — show timeline
- 2026-05-05 Pending — CARMLS
- 2026-04-27 Listed $127,000 CARMLS
- 2012-10-18 Sold (Public Records) $45,476 Public Records
- 1996-05-10 Sold (Public Records) $32,000 Public Records
- 1994-01-24 Sold (Public Records) $28,000 Public Records
- 1992-08-17 Sold (Public Records) $27,000 Public Records
- 1988-05-13 Sold (Public Records) $19,000 Public Records
Property tax history
+1.4%/yrLatest (2025): $144 · +0.0% YoY. Source: county tax records.
Cash-flow waterfall
monthlySold comps — $/sqft
last 12 mo · ≤1 miLoading sold comps…