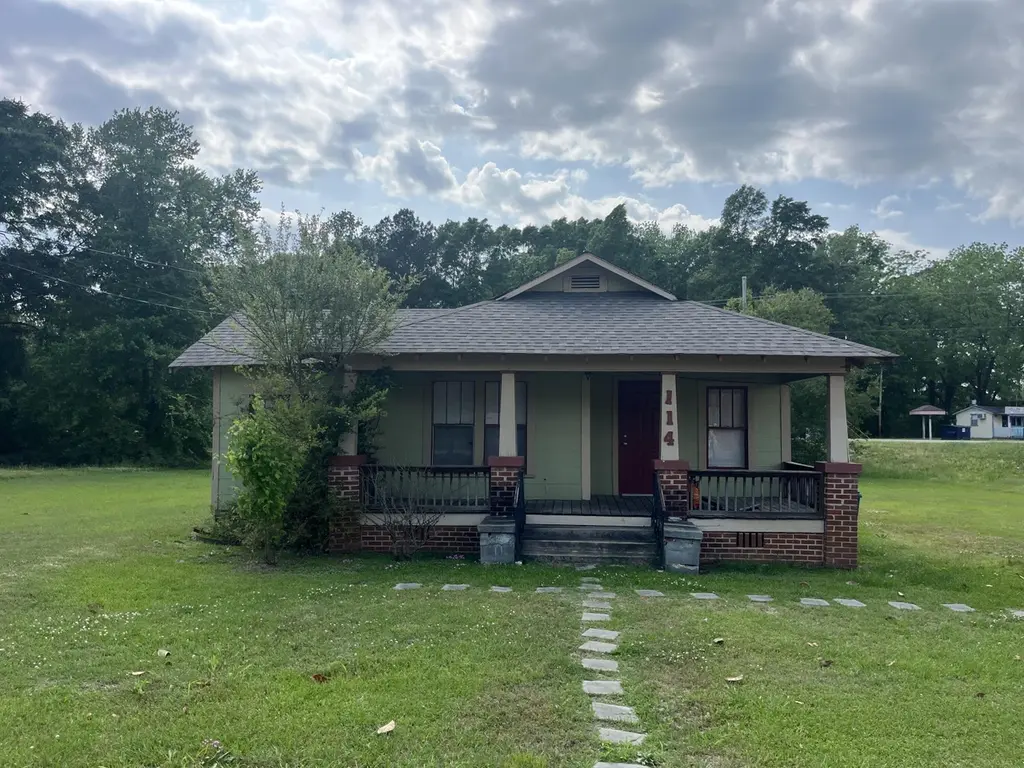
114 S Canal St · Tupelo, MS
Flood risk 9/10 · Severe
- FEMA flood zone
- X (unshaded)
- Chance of flooding over 30 yrs
- 0.99%
- Est. flood insurance / yr
- $507 – $1,088
Fire risk 1/10 · Minimal
- Est. fire insurance / yr
- $1,241 – $2,305
Heat risk 7/10 · Major
- Hot days now (above 108°F)
- 7 days/yr
- Hot days in 30 yrs
- 21 days/yr
Wind risk 6/10 · Moderate
- Chance of severe wind over 30 yrs
- 27.0%
Air-quality risk 1/10 · Minimal
- Unhealthy air days now
- 0 days/yr
- Unhealthy air days in 30 yrs
- 0 days/yr
Risk factors via First Street. Map © Google.
Why this score? — see what drove the C+ grade
The composite is a weighted blend of 9 inputs, each scored 0–100. Each bar is that input's sub-score; the figure is the points it added to the 100-point composite (weight × sub-score).
- Cash flow +25.5/30.0
- DSCR +8.4/10.0
- ARV discount +8.3/15.0
- 1% rule +6.1/10.0
- Schools +3.7/10.0
- Livability +3.6/5.0
- Rent growth +2.5/5.0
- Condition / age +2.5/5.0
- Appreciation +0.0/10.0
$112,000
🖨 Deal sheet 📄 Offer letter ✓ Due diligence
Listing remarks MLS
Are you THAT investor? Here's a package deal for you! 3 homes and a lot for a reasonable price! Homes are 114, 116 & 117 Canal St. Lot on Wayside Drive. 2 - 2BD/1BA, 1 - 3BD/1BA. All info subject to verification.
Key facts
- 0.51 acre lot
- Built 1930
- Listed 50 days
Property features AI
Finance
- Financial info: Annual tax listed
Exterior
- Utilities: Public water; Public sewer
- Home design: Single-family residential property
- Exterior features: Lot roughly 150 x 150.77 feet; Approximately 0.51 acre lot
Interior
- Kitchen: Range; Refrigerator
- Bedrooms: Total of 5 rooms (includes bedrooms and common areas)
- Bathrooms: 1 full bathroom
- Interior features: Range; Refrigerator; Central air conditioning; Central electric heating
Neighborhood map
What this means for you Summary
Snapshot
- This is a 2-bed/1.0-bath single-family listed at $112k.
Deal economics
- At list price, monthly cash flow is $194 ($2k/yr) — positive.
- The deal already cash-flows at list — no discount required.
- Meets the 1% rule at list price ($1k rent vs $112k).
- Recommended offer: $109k (3.0% below list) — sets the bar for market timing.
Location & tenants
- Location reads 72/100 on livability (#26 in MS) — a middle-class / working-renter tenant base. Strengths: cost of living A+, housing A+, health & safety A-; Watch: schools C-, amenities D+, employment D+.
- Tupelo Public School District (town): math 46% / reading 42% proficiency, ranked #28 of 130 in MS (top 22%) — families likely to look elsewhere, expect single-tenant / working-renter base with shorter leases.
- Market conditions: 172 active listings in the ZIP; 1 comparable units currently listed for rent nearby; 154 units permitted in Lee County in 2024 (24 in 5+ unit buildings).
Forward outlook
- Local home prices are declining (-3.0%/yr); year-one equity from $774 of loan paydown is wiped out by about $3k of value loss. Plan a longer hold.
- Lee County population projected at +6% by 2050 — modest demand growth; plan on rents tracking national, not racing it.
Negotiation context
- It's been on market 51 days — a 3% lower offer ($109k) is reasonable based on typical stale-listing flexibility.
- 2 sale attempts since 10y ago with the ask held roughly flat each time — persistent listings suggest the price (not the market) is what's stuck; bring a comps-based counter.
Risks & watch-outs
- Watch-outs: flood insurance adds $66/mo; built in 1930 — expect roof / HVAC / electrical / plumbing capex.
- Climate carrying-cost: severe flood risk; major wind risk, 27% chance of damaging wind over 30y; extreme-heat days projected 7→21/yr by 2055 (HVAC capex compounding) — expect insurance premiums to compound above CPI over the hold.
Questions for the listing agent
- It's been on market 51 days. Have you received any prior offers? Is the seller open to a 3% concession, seller financing, or rate buy-down credit?
- Built in 1930 — when were the roof, HVAC, electrical panel, plumbing, and water heater last replaced?
- What's the actual annual flood-insurance premium (NFIP or private), and is the property in a SFHA with mandatory coverage?
- Is there a deadline driving the sale (1031 exchange, divorce, estate, relocation)? That informs how much negotiation room exists.
- Crime grade is F in this area — have there been break-ins, vandalism, or insurance claims at this property in the last 3 years? What carrier currently insures it and at what premium?
- What's the average days-on-market for RENTAL listings here right now (not sales)? A rising rental-DOM trend means longer vacancies and softer asking-rent achievability than the comps imply.
- What's the recent tenant-quality profile in this submarket — average credit score on applications, eviction rate, late-payment / NSF rate, and stable-employment percentage? A property-management company in the area should have these aggregated.
- How much new for-sale + rental construction is in the pipeline within 1–3 miles? Heavy new supply typically softens prices + rents 12–24 months out; constrained supply supports both.
Investment metrics
- 1% rule
- 1.11% ✓
- Cap rate
- 9.09%
- Cash-on-cash
- 9.98%
- DSCR
- 1.44
- GRM
- 7.5
CMA / ARV
- ARV (median comp)
- $113,972
- List price
- $112,000
- Delta
- -1.73%
- Verdict
- FAIR
- Comps
- 9 within 1.0 mi
Show comp detail 1 sale within ~0.75 mi
| Address | Dist | Beds/Ba | Sqft | Sold | Price | $/sf | Match |
|---|---|---|---|---|---|---|---|
| 117 S Canal St | 0.03mi | 2/2.0 | 975 (+2%) | 22mo | $75,000 | $77 | 73 |
Match score weights: distance 35% · size 25% · config 20% · recency 20%. Top-matched comps best support the ARV.
Projected returns pro-forma
-3.0% appreciation · 3.0% rent growth · sell at horizon
- IRR
- -4.9%
- Equity multiple
- 0.82×
- Total profit
- $-5,750
- Equity at exit
- $16,700
- IRR
- 4.8%
- Equity multiple
- 1.35×
- Total profit
- $11,037
- Equity at exit
- $9,684
Cash invested: $31,360 (down + closing). Projections, not guarantees.
Landlord ↔ Tenant lean methodology
- Overall (STATE)
- 90 Strongly Landlord-Friendly
- State Mississippi
- 90 Strongly Landlord-Friendly · R+11
- County
- — inherits STATE
- City
- — inherits STATE
ZIP-level market 38804
- Active inventory
- 172
- Price-to-rent
- 7.5×
Monthly cashflow live
- Estimated rent
- $1,245 medium interval (Pro) →
- Mortgage (P&I)
- −$587
- Tax from tax record
- −$89 /mo · $1,062/yr
- Insurance
- −$47
- Flood insurance flood zone
- −$66 /mo · $798/yr
- HOA
- −$0
- Vacancy / Maint / Mgmt
- −$261
- Net cashflow
- $194
Break-even live
UW: 25.0% down · 7.5% · 30yr · 1.5% tax · 5.0% vac · 8.0% maint · 8.0% mgmt
Financing live
Cash to close
- Down payment
- $28,000
- Closing costs
- $3,360
- Reserves months
- —
- Total cash needed
- —
Loan-product check · same deal, 3 products live
Conventional
25% down · 7.5% · 30yr
- Down + closing
- —
- Monthly P&I
- —
- Monthly cashflow
- —
- DSCR
- —
- Eligible?
- —
Personal DTI + credit; lowest rate.
DSCR
20% down · 8.5% · 30yr
- Down + closing
- —
- Monthly P&I
- —
- Monthly cashflow
- —
- DSCR
- —
- Eligible?
- —
No personal income docs; deal must DSCR.
Hard money
10% down · 12.0% · 12mo
- Down + closing
- —
- Monthly P&I
- —
- Monthly cashflow
- —
- DSCR
- —
- Eligible?
- —
Short-term bridge; refi at stabilization.
Rent comps 1 comps
| Address | Beds | Baths | Sqft | Rent | $/sqft | DOM | Units | Dist |
|---|---|---|---|---|---|---|---|---|
| 151 S Green St Unit 4 Tupelo, MS | 2.0 | 1.0 | 950 | $1,235 | $1.30 | 43d | 1 | 1.39mi |
Listing history 20 events
-
2026-06-19days on market $112,000 Active 51 DOM
-
2026-06-18days on market $112,000 Active 50 DOM
-
2026-06-17days on market $112,000 Active 49 DOM
-
2026-06-16days on market $112,000 Active 48 DOM
-
2026-06-15days on market $112,000 Active 47 DOM
-
2026-06-14days on market $112,000 Active 45 DOM
-
2026-06-12days on market $112,000 Active 44 DOM
-
2026-06-09days on market $112,000 Active 41 DOM
-
2026-06-08days on market $112,000 Active 40 DOM
-
2026-06-07days on market $112,000 Active 39 DOM
-
2026-06-05days on market $112,000 Active 36 DOM
-
2026-06-03days on market $112,000 Active 35 DOM
-
2026-06-02days on market $112,000 Active 34 DOM
-
2026-06-01days on market $112,000 Active 33 DOM
-
2026-05-31days on market $112,000 Active 32 DOM
-
2026-05-30days on market $112,000 Active 31 DOM
-
2026-04-28$112,000 Active 383-char remark
-
2016-11-15soldstatus 218-char remark
Show marketing remark (218 chars)
Are you THAT investor? Here's a package deal for you! 3 homes and a lot for a reasonable price! Homes are 114, 116 & 117 Canal St. Lot on Wayside Drive. 2 - 2BD/1BA, 1 - 3BD/1BA. All info subject to verification.
-
2016-11-15soldstatus
Show marketing remark (218 chars)
Are you THAT investor? Here's a package deal for you! 3 homes and a lot for a reasonable price! Homes are 114, 116 & 117 Canal St. Lot on Wayside Drive. 2 - 2BD/1BA, 1 - 3BD/1BA. All info subject to verification.
-
2016-08-19$70,000 218-char remark
Show marketing remark (218 chars)
Are you THAT investor? Here's a package deal for you! 3 homes and a lot for a reasonable price! Homes are 114, 116 & 117 Canal St. Lot on Wayside Drive. 2 - 2BD/1BA, 1 - 3BD/1BA. All info subject to verification.
ⓘ Source: listings_history table (triggers on properties + properties_extension) + one-shot
backfill from property_details.listing_events for pre-trigger history.
Tax reassessment forecast MS · Resets to sale price
- Current annual tax
- $1,062 · $89/mo
- Projected year-2 tax
- $1,062 · $89/mo
- Expected delta
- $0/yr ($0/mo · 0.0%)
ⓘ Screening estimate from a state-policy table — verify with the county assessor before closing.
Climate risk First Street
- Flood 9/10 Extreme FEMA zone X (unshaded) · 99% chance over 30 yrs
- Wildfire 1/10 Low
- Heat 7/10 Severe 7 d/yr ≥108°F today · 21 d/yr by 30 yrs out
- Wind 6/10 Major 27% chance of damaging wind over 30 yrs
- Air quality 1/10 Low 0 unhealthy d/yr today · 0 by 30 yrs out
Nearby sold comps map
Loading sold comps map…
Walkable amenities ~0.75 mi
Loading nearby amenities…
Taxation est. · year 1
- Rental income
- $14,935
- − Mortgage interest
- −$6,274
- − Property taxes
- −$1,062
- − Insurance
- −$1,358
- − Repairs & maintenance
- −$1,195
- − Management
- −$1,195
- − Depreciation
- −$3,258
- Taxable income
- $594
- Est. tax owed @ 24.0%
- −$143
- After-tax cash flow
- $2,188/yr
For passive investors: Depreciation is non-cash, so a rental often shows a tax loss while cash-flowing — sheltering income. Rental losses are passive: they offset passive income freely, and up to $25,000/yr can offset ordinary (W-2) income if you actively participate and your MAGI is under $100k (phasing out to $0 by $150k); unused losses carry forward. On sale, claimed depreciation is recaptured at up to 25%, and gains may owe capital-gains tax (a 1031 exchange can defer both). Figures are a year-1 estimate at your 24.0% rate — not tax advice; consult a CPA.
Schools (NCES district)
- District
- Tupelo Public School District
- NCES district ID
- 2804320
- Math proficiency
- 46% ▼ -13.00%
- Reading proficiency
- 42% ▼ -7.00%
- Median HH income
- $44,002
- Composite
- 37.26/100
- National rank
- #4456
- State rank
- #28 of 130 in MS
Livability — Tupelo
- Score
- 72/100
- State rank
- #26
- US rank
- #6369
Category grades
Schools grade is shown separately in the Schools card above.
Census & demographics
- Census place
- Tupelo, MS
- County
- Lee County · 52,445 people
- City population
- 46,551
- Metro
- Tupelo, MS
- Population (ZIP)
- 16,693
- Household income
- $64,420
- Rent vs Own
- Severe rent burden
- 642.0
Population outlook (Lee County) Hauer SSP2
- Today (2025)
- 90,253 people
- By 2030
- 92,125 · +2.1%
- By 2040
- 94,914 · +5.2%
- By 2050
- 95,841 · +6.2%
- By 2075
- 94,189 · +4.4%
- By 2100
- 83,736 · -7.2%
Race, ethnicity, and origin ACS 2023
- Neighborhood character
- Majority White (63%)
- Race & ethnicity
- White 63% Black 30% Two or more races 3% Hispanic / Latino 3% Native American 1%
- Common ancestry
- Serbian 3% Slovak 2% Italian 2%
- Foreign-born
- 1%
- Languages at home
- 98% English-only · Spanish 1% Other Indo-European 1%
Political lean MEDSL · Lee
- 2024 margin
- Solid R (+38.8) · D 30.0% · R 68.9% · Other 1.1%
- 2008→2024 swing
- -8.3pp toward R · 2008: -30.5pp · 2024: -38.8pp
- All cycles
- 2024: R+38.8 2020: R+32.5 2016: R+37.7 2012: R+29.0 2008: R+30.5
Not yet ingested
- Civics
- —
Market trends
- HPI YoY
- ▼ -111.19%
- Current HPI
- 172.0153
- Rent YoY
- —
- Metro
- Tupelo, MS
- State GDP YoY
- —
- F500 in state
- 0
Price history
+60.0% since first listed4 events — show timeline
- 2026-04-28 Listed $112,000 NEMSBD
- 2016-11-15 Sold (Public Records) — Public Records
- 2016-11-15 Sold (MLS) — NEMSBD
- 2016-08-19 Listed $70,000 NEMSBD
Property tax history
+5.0%/yrLatest (2025): $1,062 · +6.0% YoY. Source: county tax records.
Cash-flow waterfall
monthlySold comps — $/sqft
last 12 mo · ≤1 miLoading sold comps…