527 Collin Dr · Tomah, WI
Flood risk No data
- FEMA flood zone
- —
- Chance of flooding over 30 yrs
- —
- Est. flood insurance / yr
- —
Fire risk No data
- Est. fire insurance / yr
- —
Heat risk No data
- Hot days now (above threshold)
- —
- Hot days in 30 yrs
- —
Wind risk No data
- Chance of severe wind over 30 yrs
- —
Air-quality risk No data
- Unhealthy air days now
- —
- Unhealthy air days in 30 yrs
- —
Risk factors via First Street. Map © Google.
Why this score? — see what drove the C grade
The composite is a weighted blend of 9 inputs, each scored 0–100. Each bar is that input's sub-score; the figure is the points it added to the 100-point composite (weight × sub-score).
- Cash flow +23.3/30.0
- DSCR +7.5/10.0
- ARV discount +7.5/15.0
- 1% rule +6.1/10.0
- Livability +4.0/5.0
- Condition / age +3.8/5.0
- Rent growth +2.5/5.0
- Schools +2.4/10.0
- Appreciation +0.0/10.0
$125,900
🖨 Deal sheet (PDF) 📄 Offer letter ✓ Due diligence
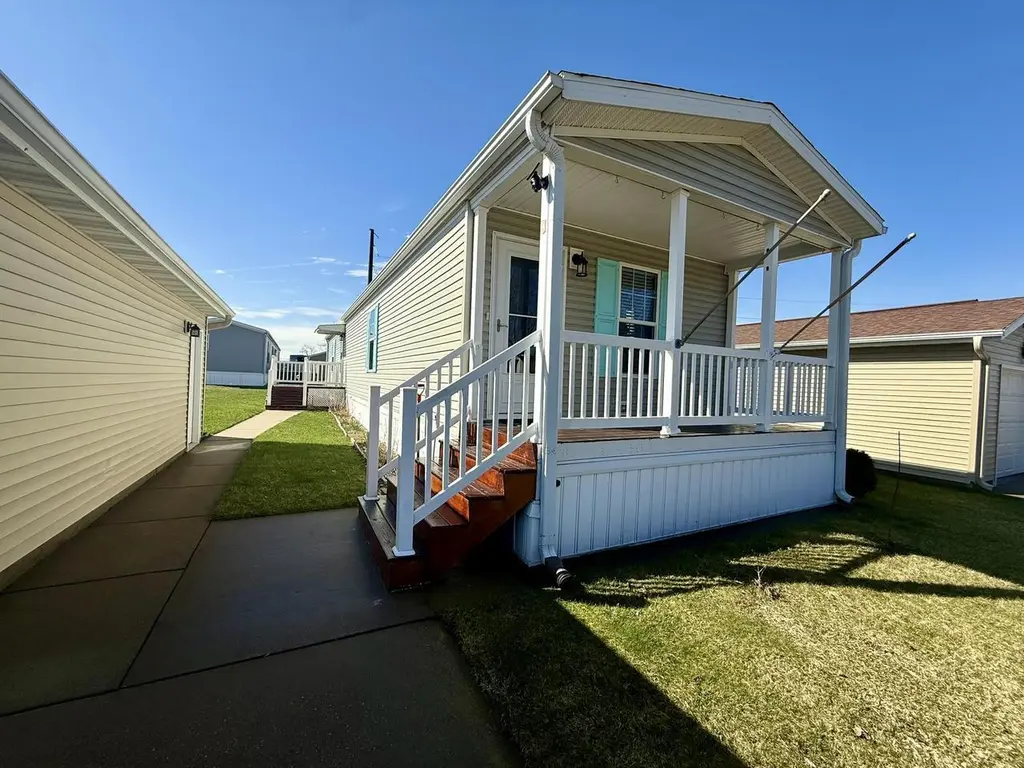
Listing remarks
Come home to Lakeshore Landing! This 3 bed 2 bath single wide manufactured home sits on a quiet dead end road with a view of the pond. A front porch will be the perfect spot to enjoy the view! The kitchen is complete with newer stainless steel appliances and a breakfast bar. A single car detached garage offers needed storage. Lot rent includes lawn mowing. Snow removal available for an extra fee. Purchaser must be approved by Lakeshore Landing to reside in the park.
Key facts
- Front porch
- Quiet dead end road
- View of the pond
Tags
Property features AI
Finance
- Other: Listed by Century 21 Affiliated
Exterior
- Parking: Detached 1-car garage with opener
- Utilities: Municipal water; Municipal sewer
- Home design: Single-family, 1-story home; Located in Lakeshore Landing subdivision; Zoned residential
- Construction: Estimated 1,280 finished above-grade square feet; No finished below-grade area
- Exterior features: Deck; Pond with waterview (no frontage); Vinyl exterior
Interior
- Kitchen: Range/Oven; Refrigerator; Microwave; Breakfast bar
- Bedrooms: Main-level master bedroom (12 x 12); Main-level second bedroom (10 x 12); Main-level third bedroom (8 x 8)
- Bathrooms: Two full bathrooms; Master bathroom includes a full bath and walk-in shower
- Heating & cooling: Forced air heating; Central air conditioning; Natural gas heat
- Interior features: Open living area with 16 x 16 living room; Breakfast bar in kitchen; No basement (slab)
- Laundry & utility: Washer; Dryer
Neighborhood map
What this means for you Summary
Snapshot
- This is a 3-bed/2.0-bath single-family listed at $126k. Condition is rated good.
Deal economics
- At list price, monthly cash flow is $229 ($3k/yr) — positive.
- The deal already cash-flows at list — no discount required.
- Meets the 1% rule at list price ($1k rent vs $126k).
- Recommended offer: $122k (3.0% below list) — sets the bar for market timing.
- Cap rate 8.5% vs local median 3.7% in Tomah — top-decile yield for the area; either an underpriced asset or a hidden risk that comps aren't pricing in. Stress-test before assuming the spread holds.
Location & tenants
- Location reads 79/100 on livability (#83 in WI, #2,189 nationally) — a middle-class / working-renter tenant base. Strengths: cost of living A+, housing A+, health & safety A+; Watch: crime C-, amenities F.
- Tomah Area School District (town): math 27% / reading 28% proficiency, ranked #293 of 342 in WI (top 86%) — low school quality limits family demand, transient renter base, plan for 1-2y turnover.
- Zoned schools: Lemonweir Elementary (math 22% / reading 22%, grade F, #823 of 1,041 statewide, top 82%, 290 students, 71% FRL); Tomah Middle (math 28% / reading 29%, grade F, #282 of 383 statewide, top 76%, 676 students, 46% FRL); Tomah High (math 11% / reading 25%, grade F, #397 of 483 statewide, top 82%, 868 students, 41% FRL) — zoned schools average 53% FRL vs 36% district-wide (17 pts higher); higher-poverty schools than district average — tighter screening recommended.
- Market conditions: 86 active listings in the ZIP; 5 comparable units currently listed for rent nearby; rentals at typical pace (median 25d on market — plan ~3-4 weeks tenant-placement turnaround); 93 units permitted in Monroe County in 2024 (0 in 5+ unit buildings).
Forward outlook
- Local home prices are declining (-3.0%/yr); year-one equity from $870 of loan paydown is wiped out by about $4k of value loss. Plan a longer hold.
- Monroe County population projected to shrink 9% by 2050 — rents likely to lag national; underwrite the cash flow, not the appreciation.
Negotiation context
- It's been on market 33 days — a 3% lower offer ($122k) is reasonable based on typical stale-listing flexibility.
- 2 sale attempts with the ask held roughly flat each time — persistent listings suggest the price (not the market) is what's stuck; bring a comps-based counter.
Questions for the listing agent
- It's been on market 33 days. Have you received any prior offers? Is the seller open to a 3% concession, seller financing, or rate buy-down credit?
- Is there a deadline driving the sale (1031 exchange, divorce, estate, relocation)? That informs how much negotiation room exists.
- What's the average days-on-market for RENTAL listings here right now (not sales)? A rising rental-DOM trend means longer vacancies and softer asking-rent achievability than the comps imply.
- What's the recent tenant-quality profile in this submarket — average credit score on applications, eviction rate, late-payment / NSF rate, and stable-employment percentage? A property-management company in the area should have these aggregated.
- How much new for-sale + rental construction is in the pipeline within 1–3 miles? Heavy new supply typically softens prices + rents 12–24 months out; constrained supply supports both.
Investment metrics
- 1% rule
- 1.11% ✓
- Cap rate
- 8.48%
- Cash-on-cash
- 7.81%
- DSCR
- 1.35
- GRM
- 7.5
CMA / ARV
No comps found within radius.
Projected returns pro-forma
-3.0% appreciation · 3.0% rent growth · sell at horizon
- IRR
- -4.4%
- Equity multiple
- 0.84×
- Total profit
- $-5,767
- Equity at exit
- $18,772
- IRR
- 5.3%
- Equity multiple
- 1.39×
- Total profit
- $13,881
- Equity at exit
- $10,886
Cash invested: $35,252 (down + closing). Projections, not guarantees.
Landlord ↔ Tenant lean methodology
- Overall (STATE)
- 73 Landlord-Friendly
- State Wisconsin
- 73 Landlord-Friendly · R+2
- County
- — inherits STATE
- City
- — inherits STATE
ZIP-level market 54660
- Home prices YoY
- -23.5%
- Active inventory
- 86
- Price-to-rent
- 7.5×
Monthly cashflow live
- Estimated rent
- $1,392 high interval (Pro) →
- Mortgage (P&I)
- −$660
- Tax est. 1.5%
- −$157 /mo · $1,888/yr
- Insurance
- −$52
- HOA
- −$0
- Vacancy / Maint / Mgmt
- −$292
- Net cashflow
- $229
Break-even live
Sensitivity live
| Price | -10% $316 | -5% $273 | +0% $229 | +5% $186 | +10% $142 |
|---|---|---|---|---|---|
| Rent | -10% $119 | -5% $174 | +0% $229 | +5% $284 | +10% $339 |
| Rate | -1.0pp $293 | -0.5pp $261 | base $229 | +0.5pp $197 | +1.0pp $164 |
UW: 25.0% down · 7.5% · 30yr · 1.5% tax · 5.0% vac · 8.0% maint · 8.0% mgmt
Financing live
Cash to close
- Down payment
- $31,475
- Closing costs
- $3,777
- Reserves months
- —
- Total cash needed
- —
Loan-product check · same deal, 3 products live
Conventional
25% down · 7.5% · 30yr
- Down + closing
- —
- Monthly P&I
- —
- Monthly cashflow
- —
- DSCR
- —
- Eligible?
- —
Personal DTI + credit; lowest rate.
DSCR
20% down · 8.5% · 30yr
- Down + closing
- —
- Monthly P&I
- —
- Monthly cashflow
- —
- DSCR
- —
- Eligible?
- —
No personal income docs; deal must DSCR.
Hard money
10% down · 12.0% · 12mo
- Down + closing
- —
- Monthly P&I
- —
- Monthly cashflow
- —
- DSCR
- —
- Eligible?
- —
Short-term bridge; refi at stabilization.
Rent comps 5 comps
| Address | Beds | Baths | Sqft | Rent | $/sqft | DOM | Units | Dist |
|---|---|---|---|---|---|---|---|---|
| 834 Evergreen Pass Tomah, WI | 4.0 | 2.5 | 1418 | $1,729 | $1.22 | 16d | 1 | 1.41mi |
| 205 E Veterans St Tomah, WI | 2.0 | 1.0 | 950 | $1,300 | $1.37 | 25d | 1 | 1.45mi |
| 209 E Veterans St Tomah, WI | 1.0–2.0 | 1.0 | 825 | $1,300 | $1.58 | 16d | 2 | 1.45mi |
| 220 Murdock St Tomah, WI | 2.0 | 1.0 | 1096 | $1,200 | $1.09 | 45d | 1 | 1.49mi |
| 260 Murdock St Tomah, WI | 3.0 | 1.0 | 1114 | $1,450 | $1.30 | 25d | 1 | 1.50mi |
Listing history 19 events
-
2026-06-21days on market $125,900 Active 33 DOM
-
2026-06-18days on market $125,900 Active 30 DOM
-
2026-06-17days on market $125,900 Active 29 DOM
-
2026-06-16days on market $125,900 Active 28 DOM
-
2026-06-15days on market $125,900 Active 27 DOM
-
2026-06-14days on market $125,900 Active 25 DOM
-
2026-06-10days on market $125,900 Active 22 DOM
-
2026-06-09days on market $125,900 Active 21 DOM
-
2026-06-08days on market $125,900 Active 20 DOM
-
2026-06-07days on market $125,900 Active 19 DOM
-
2026-06-05days on market $125,900 Active 16 DOM
-
2026-06-03days on market $125,900 Active 15 DOM
-
2026-06-02days on market $125,900 Active 14 DOM
-
2026-06-01days on market $125,900 Active 13 DOM
-
2026-05-31days on market $125,900 Active 12 DOM
-
2026-05-31days on market $125,900 Active 11 DOM
-
2026-05-20status Active
-
2026-04-14status Pending
-
2026-04-13$125,900 Active
ⓘ Source: listings_history table (triggers on properties + properties_extension) + one-shot
backfill from property_details.listing_events for pre-trigger history.
Nearby sold comps map
Loading sold comps map…
Walkable amenities ~0.75 mi
Loading nearby amenities…
Taxation est. · year 1
- Rental income
- $16,701
- − Mortgage interest
- −$7,052
- − Property taxes
- −$1,888
- − Insurance
- −$630
- − Repairs & maintenance
- −$1,336
- − Management
- −$1,336
- − Depreciation
- −$3,663
- Taxable income
- $796
- Est. tax owed @ 24.0%
- −$191
- After-tax cash flow
- $2,562/yr
For passive investors: Depreciation is non-cash, so a rental often shows a tax loss while cash-flowing — sheltering income. Rental losses are passive: they offset passive income freely, and up to $25,000/yr can offset ordinary (W-2) income if you actively participate and your MAGI is under $100k (phasing out to $0 by $150k); unused losses carry forward. On sale, claimed depreciation is recaptured at up to 25%, and gains may owe capital-gains tax (a 1031 exchange can defer both). Figures are a year-1 estimate at your 24.0% rate — not tax advice; consult a CPA.
Condition & rehab AI · 12 photos
This single-wide manufactured home is in good condition with minimal repairs needed. It offers a good balance of curb appeal and interior updates, making it a solid investment.
Value-add opportunities
- Both Paint exterior trim — Enhances curb appeal and value
- Both Clean gutters — Improves drainage and aesthetics
- Both Replace carpet with hardwood or tile — Increases value and reduces maintenance
- Both Install new kitchen backsplash — Modernizes kitchen and adds value
Renovation cost estimate screening
Value-add ROI direction
- Both Paint exterior trim — Enhances curb appeal and value ↑
- Both Clean gutters — Improves drainage and aesthetics ↑
- Both Replace carpet with hardwood or tile — Increases value and reduces maintenance ↑
- Both Install new kitchen backsplash — Modernizes kitchen and adds value ↑
ⓘ Cost ranges are severity-bucket heuristics (US national rule-of-thumb). Get contractor quotes + a written scope before underwriting a rehab budget.
Schools (NCES district)
- District
- Tomah Area School District
- NCES district ID
- 5514910
- Math proficiency
- 27% ▼ -4.00%
- Reading proficiency
- 28% ▼ -5.00%
- Median HH income
- $50,063
- Composite
- 24.14/100
- National rank
- #7747
- State rank
- #293 of 342 in WI
Livability — Tomah
- Score
- 79/100
- State rank
- #83
- US rank
- #2189
Category grades
Schools grade is shown separately in the Schools card above.
Census & demographics
- Census place
- Tomah, WI
- County
- Monroe County · 16,124 people
- City population
- 16,124
- Metro
- nan
- Population (ZIP)
- 16,124
- Household income
- $61,186
- Rent vs Own
- Severe rent burden
- 427.0
Population outlook (Monroe County) Hauer SSP2
- Today (2025)
- 45,682 people
- By 2030
- 45,187 · -1.1%
- By 2040
- 43,768 · -4.2%
- By 2050
- 41,596 · -8.9%
- By 2075
- 35,555 · -22.2%
- By 2100
- 28,278 · -38.1%
Race, ethnicity, and origin ACS 2023
- Neighborhood character
- Predominantly White (89%)
- Race & ethnicity
- White 89% Two or more races 5% Hispanic / Latino 4% Black 1% Native American 1%
- Common ancestry
- Portuguese 12% Romanian 3% Lithuanian 2%
- Foreign-born
- 2% · Canada
- Languages at home
- 96% English-only · German/W. Germanic 1% Spanish 1%
Political lean MEDSL · Monroe
- 2024 margin
- Strong R (+26.1) · D 36.3% · R 62.5% · Other 1.2%
- 2008→2024 swing
- -34.1pp toward R · 2008: 8.0pp · 2024: -26.1pp
- All cycles
- 2024: R+26.1 2020: R+23.6 2016: R+22.5 2012: R+0.7 2008: D+8.0
Not yet ingested
- Civics
- —
Market trends
- HPI YoY
- ▼ -64.36%
- Current HPI
- 209.1207
- Rent YoY
- —
- Metro
- nan
- State GDP YoY
- ▲ 2.10%
- F500 in state
- 20
Industry mix (Fortune 500 HQ in WI)
| Industry | F500 HQs | Revenue |
|---|---|---|
| Industrial Machinery | 4 | $23B |
|
||
| Industrial Technology | 2 | $36B |
|
||
| Insurance | 1 | $36B |
|
||
| Professional Services | 1 | $19B |
|
||
| Utilities | 1 | $9B |
|
||
| Consumer Goods | 1 | $3B |
|
||
Price history
3 events — show timeline
- 2026-05-20 Relisted — SCWMLS
- 2026-04-14 Pending — SCWMLS
- 2026-04-13 Listed $125,900 SCWMLS
Cash-flow waterfall
monthlySold comps — $/sqft
last 12 mo · ≤1 miLoading sold comps…