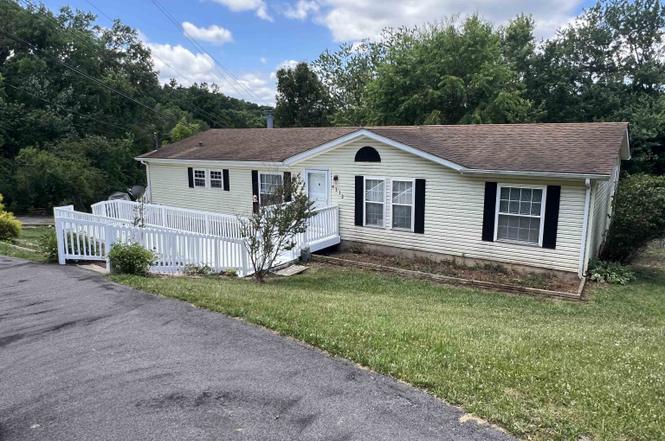
4212 Christie Ln · Christiansburg, VA
Flood risk 1/10 · Minimal
- FEMA flood zone
- X (unshaded)
- Chance of flooding over 30 yrs
- 0.0%
- Est. flood insurance / yr
- $507 – $1,088
Fire risk 5/10 · Moderate
- Est. fire insurance / yr
- $666 – $1,236
Heat risk 3/10 · Minor
- Hot days now (above 96°F)
- 7 days/yr
- Hot days in 30 yrs
- 18 days/yr
Wind risk 2/10 · Minimal
- Chance of severe wind over 30 yrs
- 1.0%
Air-quality risk 1/10 · Minimal
- Unhealthy air days now
- 0 days/yr
- Unhealthy air days in 30 yrs
- 0 days/yr
Risk factors via First Street. Map © Google.
Why this score? — see what drove the C- grade
The composite is a weighted blend of 9 inputs, each scored 0–100. Each bar is that input's sub-score; the figure is the points it added to the 100-point composite (weight × sub-score).
- Cash flow +24.7/30.0
- DSCR +8.0/10.0
- 1% rule +5.5/10.0
- Schools +5.4/10.0
- Livability +4.0/5.0
- Rent growth +2.8/5.0
- Condition / age +2.5/5.0
- ARV discount +0.5/15.0
- Appreciation +0.0/10.0
$179,900
🖨 Deal sheet 📄 Offer letter ✓ Due diligence
Listing remarks MLS
This Charming 3 Bedroom 2 Bath Home sits just inside town limits with beautiful mountain views only minutes from local Shopping and Restaurants. Open floor plan, New Gas Fire Place, Laminate Floors, Freshly Painted. Architectural Shingle Roof, Quality Landscaping with plenty of yard space. Transferable Home Warranty. Great Starter Home, Move-in Ready. Come see for yourself!
Key facts
- 0.7 acre lot
- Built 1998
- Listed 2 days
Property features AI
Exterior
- Parking: Asphalt parking
- Utilities: Public water; Septic tank
- Home design: Mobile home (detached); One story
- Construction: Block and vinyl siding construction
- Exterior features: Garden; Deck; Porch; Storm door(s); Fenced yard; Shed(s)
Interior
- Kitchen: Dishwasher; Electric range; Microwave; Refrigerator; Electric water heater
- Bedrooms: Total rooms: 7
- Bathrooms: 2 full bathrooms
- Heating & cooling: Heat pump heating; Ceiling fan(s) for cooling
- Interior features: Walk-in closets; Skylights; Window coverings; Gas log fireplace; Crawl space basement
- Laundry & utility: Washer; Dryer
Neighborhood map
What this means for you Summary
Snapshot
- This is a 3-bed/2.0-bath manufactured listed at $180k.
Deal economics
- At list price, monthly cash flow is $374 ($4k/yr) — positive.
- The deal already cash-flows at list — no discount required.
- Meets the 1% rule at list price ($2k rent vs $180k).
- Cap rate 8.8% vs local median 3.8% in Christiansburg — top-decile yield for the area; either an underpriced asset or a hidden risk that comps aren't pricing in. Stress-test before assuming the spread holds.
Location & tenants
- Location reads 81/100 on livability (#53 in VA, #1,452 nationally) — a professional / high-income tenant draw. Strengths: cost of living A+, housing A+, commute A-; Watch: amenities F.
- Montgomery County Public School District (urban): math 57% / reading 70% proficiency, ranked #47 of 131 in VA (top 36%) — acceptable for families but not a draw, mixed tenant base, ~2y average lease.
- Zoned schools: Falling Branch Elementary (math 56% / reading 68%, grade B, #480 of 1,108 statewide, top 46%, 576 students, 52% FRL); Christiansburg Middle (math 38% / reading 63%, grade C, #226 of 342 statewide, top 67%, 752 students, 44% FRL); Christiansburg High (math 79% / reading 77%, grade A-, #80 of 319 statewide, top 25%, 1,116 students, 41% FRL).
- Market conditions: Rents rising (+1.1%/yr); 248 active listings in the ZIP; solid renter incomes; 323 units permitted in Montgomery County in 2024 (0 in 5+ unit buildings).
Forward outlook
- Local home prices are declining (-3.0%/yr); year-one equity from $1k of loan paydown is wiped out by about $5k of value loss. Plan a longer hold.
- Montgomery County population projected at +13% by 2050 — modest demand growth; plan on rents tracking national, not racing it.
Negotiation context
- Only 2 days on market — expect competitive offers; lowballing is unlikely to land.
- 2 sale attempts since 6y ago with the ask held roughly flat each time — persistent listings suggest the price (not the market) is what's stuck; bring a comps-based counter.
- Current owner paid $152k; 18% above their basis — modest negotiation headroom, anchor on the comps not their cost.
Risks & watch-outs
- Climate carrying-cost: moderate wildfire risk — expect insurance premiums to compound above CPI over the hold.
Questions for the listing agent
- Is there a deadline driving the sale (1031 exchange, divorce, estate, relocation)? That informs how much negotiation room exists.
- Schools are A-rated — typically a magnet for longer-tenancy family renters. What's the average tenant stay here, and is there a school-zone premium baked into asking?
- What's the average days-on-market for RENTAL listings here right now (not sales)? A rising rental-DOM trend means longer vacancies and softer asking-rent achievability than the comps imply.
- What's the recent tenant-quality profile in this submarket — average credit score on applications, eviction rate, late-payment / NSF rate, and stable-employment percentage? A property-management company in the area should have these aggregated.
- How much new for-sale + rental construction is in the pipeline within 1–3 miles? Heavy new supply typically softens prices + rents 12–24 months out; constrained supply supports both.
Investment metrics
- 1% rule
- 1.05% ✓
- Cap rate
- 8.79%
- Cash-on-cash
- 8.92%
- DSCR
- 1.40
- GRM
- 7.9
CMA / ARV
- ARV (on-the-fly)
- $155,736
- Comps found
- 1
Show comp detail 1 sale within ~0.75 mi
| Address | Dist | Beds/Ba | Sqft | Sold | Price | $/sf | Match |
|---|---|---|---|---|---|---|---|
| 155 Mount Pleasant Rd | 0.26mi | 3/2.0 | 1,552 (+3%) | 17mo | $160,000 | $103 | 69 |
Match score weights: distance 35% · size 25% · config 20% · recency 20%. Top-matched comps best support the ARV.
Projected returns pro-forma
-3.0% appreciation · 1.05% rent growth · sell at horizon
- IRR
- -4.9%
- Equity multiple
- 0.82×
- Total profit
- $-8,984
- Equity at exit
- $26,824
- IRR
- 2.5%
- Equity multiple
- 1.17×
- Total profit
- $8,355
- Equity at exit
- $15,554
Cash invested: $50,372 (down + closing). Projections, not guarantees.
Landlord ↔ Tenant lean methodology
- Overall (STATE)
- 55 Moderately Landlord-Leaning
- State Virginia
- 55 Moderately Landlord-Leaning · D+2
- County
- — inherits STATE
- City
- — inherits STATE
ZIP-level market 24073
- Home prices YoY
- -26.2%
- Rents YoY
- 1.1%
- Active inventory
- 248
- Price-to-rent
- 7.9×
Monthly cashflow live
- Estimated rent
- $1,887 medium interval (Pro) →
- Mortgage (P&I)
- −$943
- Tax from tax record
- −$98 /mo · $1,173/yr
- Insurance
- −$75
- HOA
- −$0
- Vacancy / Maint / Mgmt
- −$396
- Net cashflow
- $374
Break-even live
UW: 25.0% down · 7.5% · 30yr · 1.5% tax · 5.0% vac · 8.0% maint · 8.0% mgmt
Financing live
Cash to close
- Down payment
- $44,975
- Closing costs
- $5,397
- Reserves months
- —
- Total cash needed
- —
Loan-product check · same deal, 3 products live
Conventional
25% down · 7.5% · 30yr
- Down + closing
- —
- Monthly P&I
- —
- Monthly cashflow
- —
- DSCR
- —
- Eligible?
- —
Personal DTI + credit; lowest rate.
DSCR
20% down · 8.5% · 30yr
- Down + closing
- —
- Monthly P&I
- —
- Monthly cashflow
- —
- DSCR
- —
- Eligible?
- —
No personal income docs; deal must DSCR.
Hard money
10% down · 12.0% · 12mo
- Down + closing
- —
- Monthly P&I
- —
- Monthly cashflow
- —
- DSCR
- —
- Eligible?
- —
Short-term bridge; refi at stabilization.
Listing history 4 events
-
2026-06-18status $179,900 Pending 2 DOM
-
2026-06-18days on market $179,900 Active 2 DOM
-
2026-06-17remarks 661-char remark
-
2026-06-17$179,900 Active 1 DOM
ⓘ Source: listings_history table (triggers on properties + properties_extension) + one-shot
backfill from property_details.listing_events for pre-trigger history.
Tax reassessment forecast VA · Resets to sale price
- Current annual tax
- $1,173 · $98/mo
- Projected year-2 tax
- $1,475 · $123/mo
- Expected delta
- +$302/yr (+$25/mo · 25.8%)
ⓘ Screening estimate from a state-policy table — verify with the county assessor before closing.
Climate risk First Street
- Flood 1/10 Low FEMA zone X (unshaded) · 0% chance over 30 yrs
- Wildfire 5/10 Major
- Heat 3/10 Moderate 7 d/yr ≥96°F today · 18 d/yr by 30 yrs out
- Wind 2/10 Low 100% chance of damaging wind over 30 yrs
- Air quality 1/10 Low 0 unhealthy d/yr today · 0 by 30 yrs out
Nearby sold comps map
Loading sold comps map…
Walkable amenities ~0.75 mi
Loading nearby amenities…
Taxation est. · year 1
- Rental income
- $22,641
- − Mortgage interest
- −$10,077
- − Property taxes
- −$1,173
- − Insurance
- −$900
- − Repairs & maintenance
- −$1,811
- − Management
- −$1,811
- − Depreciation
- −$5,233
- Taxable income
- $1,636
- Est. tax owed @ 24.0%
- −$393
- After-tax cash flow
- $4,101/yr
For passive investors: Depreciation is non-cash, so a rental often shows a tax loss while cash-flowing — sheltering income. Rental losses are passive: they offset passive income freely, and up to $25,000/yr can offset ordinary (W-2) income if you actively participate and your MAGI is under $100k (phasing out to $0 by $150k); unused losses carry forward. On sale, claimed depreciation is recaptured at up to 25%, and gains may owe capital-gains tax (a 1031 exchange can defer both). Figures are a year-1 estimate at your 24.0% rate — not tax advice; consult a CPA.
Schools (NCES district)
- District
- Montgomery County Public School District
- NCES district ID
- 5102520
- Math proficiency
- 57% ▼ -29.00%
- Reading proficiency
- 70% ▼ -11.00%
- Median HH income
- $46,618
- Composite
- 53.6/100
- National rank
- #1440
- State rank
- #47 of 131 in VA
Livability — Christiansburg
- Score
- 81/100
- State rank
- #53
- US rank
- #1452
Category grades
Schools grade is shown separately in the Schools card above.
Census & demographics
- Census place
- Christiansburg, VA
- County
- Montgomery County · 78,218 people
- City population
- 29,677
- Metro
- Blacksburg-Christiansburg, VA
- Population (ZIP)
- 29,677
- Household income
- $76,800
- Rent vs Own
- Severe rent burden
- 861.0
Population outlook (Montgomery County) Hauer SSP2
- Today (2025)
- 105,748 people
- By 2030
- 110,301 · +4.3%
- By 2040
- 115,652 · +9.4%
- By 2050
- 119,651 · +13.1%
- By 2075
- 126,005 · +19.2%
- By 2100
- 129,771 · +22.7%
Race, ethnicity, and origin ACS 2023
- Neighborhood character
- Predominantly White (86%)
- Race & ethnicity
- White 86% Two or more races 5% Black 4% Hispanic / Latino 4% Asian 3%
- Common ancestry
- Italian 3% Slovak 3% Serbian 2%
- Foreign-born
- 5% · Canada, South Korea, Jamaica
- Languages at home
- 94% English-only · Spanish 3% Other Indo-European 2% Korean 1%
Political lean MEDSL · Montgomery
- 2024 margin
- Toss-up / Even · D 50.9% · R 47.4% · Other 1.7%
- 2008→2024 swing
- -1.4pp toward R · 2008: 4.9pp · 2024: 3.5pp
- All cycles
- 2024: D+3.5 2020: D+5.8 2016: D+1.3 2012: R+0.2 2008: D+4.9
Not yet ingested
- Civics
- —
Market trends
- HPI YoY
- ▼ -94.98%
- Current HPI
- 267.2504
- Rent YoY
- ▲ 1.05%
- Metro
- Blacksburg-Christiansburg, VA
- State GDP YoY
- ▲ 2.40%
- F500 in state
- 50
Industry mix (Fortune 500 HQ in VA)
| Industry | F500 HQs | Revenue |
|---|---|---|
| Aerospace / Defense | 4 | $236B |
|
||
| Technology / Defense | 3 | $32B |
|
||
| Financial Services | 2 | $176B |
|
||
| Utilities | 2 | $27B |
|
||
| Insurance | 2 | $25B |
|
||
| Technology | 2 | $15B |
|
||
Price history
+124.9% since first listed5 events — show timeline
- 2026-06-16 Listed $179,900 NRVMLS
- 2020-10-13 Sold (Public Records) $152,000 Public Records
- 2020-10-09 Sold (MLS) $152,000 NRVMLS
- 2020-06-13 Listed $149,900 NRVMLS
- 2007-11-29 Sold (Public Records) $80,000 Public Records
Property tax history
+1.0%/yrLatest (2025): $1,173 · +1.3% YoY. Source: county tax records.
Cash-flow waterfall
monthlySold comps — $/sqft
last 12 mo · ≤1 miLoading sold comps…