1007 S Church St · Salisbury, NC
Flood risk 1/10 · Minimal
- FEMA flood zone
- X (unshaded)
- Chance of flooding over 30 yrs
- 0.0%
- Est. flood insurance / yr
- $507 – $1,088
Fire risk 1/10 · Minimal
- Est. fire insurance / yr
- $906 – $1,684
Heat risk 6/10 · Moderate
- Hot days now (above 104°F)
- 7 days/yr
- Hot days in 30 yrs
- 17 days/yr
Wind risk 4/10 · Minor
- Chance of severe wind over 30 yrs
- 13.0%
Air-quality risk 3/10 · Minor
- Unhealthy air days now
- 2 days/yr
- Unhealthy air days in 30 yrs
- 3 days/yr
Risk factors via First Street. Map © Google.
Why this score? — see what drove the C grade
The composite is a weighted blend of 9 inputs, each scored 0–100. Each bar is that input's sub-score; the figure is the points it added to the 100-point composite (weight × sub-score).
- Cash flow +21.7/30.0
- ARV discount +15.0/15.0
- DSCR +6.9/10.0
- 1% rule +4.8/10.0
- Livability +3.2/5.0
- Schools +2.6/10.0
- Rent growth +2.5/5.0
- Condition / age +2.5/5.0
- Appreciation +0.0/10.0
$159,900
🖨 Deal sheet 📄 Offer letter ✓ Due diligence
Listing remarks
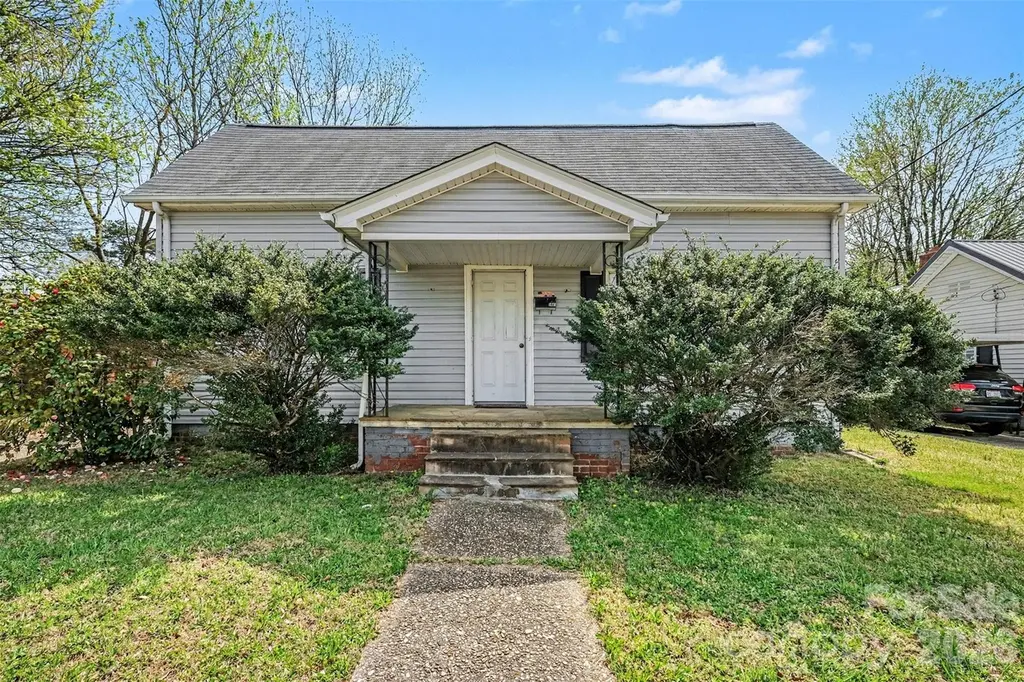
Charming and full of character, this inviting Salisbury home offers a warm and welcoming feel from the moment you arrive. Set on a tree-lined lot, the home features classic curb appeal with a covered front porch that creates the perfect spot to relax and enjoy the surrounding neighborhood. Inside, you’ll find spacious living areas filled with natural light and a comfortable, easy-flow layout. The main living room offers a cozy atmosphere with plenty of room to gather, while the adjoining dining area connects seamlessly to the kitchen, creating a functional space for everyday living. The kitchen showcases extra wood cabinetry and generous workspace, blending charm with practicality. Th
Key facts
- Covered front porch
- Flexible spaces
- Covered patio
Tags
Property features AI
Finance
- HOA & community: No HOA
Exterior
- Parking: Attached carport (1 car); Driveway
- Utilities: City water; Public sewer
- Home design: Single-family residential home; One story; Crawl space foundation
- Construction: Site-built construction; Hardboard siding and vinyl exterior; Composition roof
- Exterior features: Covered front porch and patio; Level, partly wooded lot; Concrete and paved roads, publicly maintained
Interior
- Kitchen: Electric range; Exhaust hood; Refrigerator
- Bedrooms: Three bedrooms on the main level
- Flooring: Carpet; Linoleum; Tile; Wood
- Bathrooms: Two full bathrooms on the main level
- Heating & cooling: Electric heating; Natural gas heating; Central air; Ceiling fan(s); Wall and window air units
- Interior features: Open room flow with 8 total rooms; Living room fireplace
- Laundry & utility: Laundry located in the kitchen on the main level; Electric water heater
Neighborhood map
What this means for you Summary
Snapshot
- This is a 3-bed/2.0-bath single-family listed at $160k.
Deal economics
- At list price, monthly cash flow is $245 ($3k/yr) — positive.
- The deal already cash-flows at list — no discount required.
- To meet the 1% rule (rent ≥ 1% of price), the offer needs to be $157k (1.7% below list).
- Recommended offer: $150k (6.0% below list) — sets the bar for market timing.
- Cap rate 8.1% vs local median 3.2% in Salisbury — top-decile yield for the area; either an underpriced asset or a hidden risk that comps aren't pricing in. Stress-test before assuming the spread holds.
Location & tenants
- Location reads 64/100 on livability (#365 in NC) — a middle-class / working-renter tenant base. Strengths: cost of living A+, housing A+, health & safety A+; Watch: crime F, amenities D-, commute F.
- Rowan-Salisbury Schools (rural): math 26% / reading 35% proficiency, ranked #142 of 178 in NC (top 80%) — families likely to look elsewhere, expect single-tenant / working-renter base with shorter leases.
- Zoned schools: Salisbury High (math 27% / reading 47%, grade F, #414 of 535 statewide, top 79%, 959 students, 66% FRL).
- Market conditions: 291 active listings in the ZIP; 14 comparable units currently listed for rent nearby; rentals at typical pace (median 24d on market — plan ~3-4 weeks tenant-placement turnaround); 592 units permitted in Rowan County in 2024 (5 in 5+ unit buildings).
- This rent runs 36% of the median local income ($53k/yr) — at the standard rent-burdened threshold; future hikes will face affordability resistance.
Forward outlook
- Local home prices are declining (-3.0%/yr); year-one equity from $1k of loan paydown is wiped out by about $5k of value loss. Plan a longer hold.
- Rowan County population projected to shrink 6% by 2050 — rents likely to lag national; underwrite the cash flow, not the appreciation.
Negotiation context
- It's been on market 77 days — a 6% lower offer ($150k) is reasonable based on typical stale-listing flexibility.
Risks & watch-outs
- Watch-outs: built in 1945 — expect roof / HVAC / electrical / plumbing capex.
- Climate carrying-cost: extreme-heat days projected 7→17/yr by 2055 (HVAC capex compounding) — expect insurance premiums to compound above CPI over the hold.
Questions for the listing agent
- It's been on market 77 days. Have you received any prior offers? Is the seller open to a 6% concession, seller financing, or rate buy-down credit?
- Built in 1945 — when were the roof, HVAC, electrical panel, plumbing, and water heater last replaced?
- Why hasn't it sold? Are there any deal-killer items the seller is aware of (foundation, flood, title, zoning, code violations)?
- Is there a deadline driving the sale (1031 exchange, divorce, estate, relocation)? That informs how much negotiation room exists.
- Schools are F-rated, which usually means shorter tenancies and higher turnover. Who's the typical renter profile here, and what's been the actual vacancy rate?
- Crime grade is F in this area — have there been break-ins, vandalism, or insurance claims at this property in the last 3 years? What carrier currently insures it and at what premium?
- What's the average days-on-market for RENTAL listings here right now (not sales)? A rising rental-DOM trend means longer vacancies and softer asking-rent achievability than the comps imply.
- What's the recent tenant-quality profile in this submarket — average credit score on applications, eviction rate, late-payment / NSF rate, and stable-employment percentage? A property-management company in the area should have these aggregated.
- How much new for-sale + rental construction is in the pipeline within 1–3 miles? Heavy new supply typically softens prices + rents 12–24 months out; constrained supply supports both.
Investment metrics
- 1% rule
- 0.98% ✗
- Cap rate
- 8.13%
- Cash-on-cash
- 6.56%
- DSCR
- 1.29
- GRM
- 8.5
CMA / ARV
- ARV (on-the-fly)
- $236,070
- Comps found
- 12
Show comp detail 12 sales within ~0.75 mi
| Address | Dist | Beds/Ba | Sqft | Sold | Price | $/sf | Match |
|---|---|---|---|---|---|---|---|
| 102 Crawford St | 0.19mi | 3/2.0 | 1,304 (+1%) | 4mo | $245,000 | $188 | 86 |
| 513 Lincolnton Rd | 0.23mi | 3/2.0 | 1,232 (-4%) | 3mo | $220,000 | $179 | 80 |
| 201 W Mccubbins St | 0.19mi | 2/1.0 (-1) | 1,311 (+2%) | 0mo | $170,000 | $130 | 79 |
| 7 Cooper St | 0.35mi | 3/2.0 | 1,200 (-7%) | 3mo | $237,000 | $198 | 70 |
| 1013 Locke St | 0.53mi | 3/2.0 | 1,326 (+3%) | 3mo | $242,500 | $183 | 68 |
| 9 Cooper St | 0.34mi | 3/2.5 | 1,399 (+8%) | 4mo | $260,000 | $186 | 64 |
| 406 Grace St | 0.59mi | 3/2.0 | 1,250 (-3%) | 5mo | $229,000 | $183 | 63 |
| 406 S Shaver St | 0.71mi | 3/1.5 | 1,282 (-1%) | 3mo | $137,050 | $107 | 61 |
| 120 Mitchell St | 0.28mi | 3/2.0 | 1,110 (-14%) | 3mo | $214,900 | $194 | 61 |
| 915 Lincolnton Rd | 0.64mi | 2/1.5 (-1) | 1,239 (-4%) | 3mo | $207,000 | $167 | 54 |
| 1418 Crosby St | 0.43mi | 2/1.5 (-1) | 1,125 (-13%) | 2mo | $178,000 | $158 | 50 |
| 1617 3rd St | 0.59mi | 2/1.0 (-1) | 1,395 (+8%) | 3mo | $205,000 | $147 | 48 |
Match score weights: distance 35% · size 25% · config 20% · recency 20%. Top-matched comps best support the ARV.
Projected returns pro-forma
-3.0% appreciation · 3.0% rent growth · sell at horizon
- IRR
- -6.2%
- Equity multiple
- 0.77×
- Total profit
- $-10,365
- Equity at exit
- $23,842
- IRR
- 3.4%
- Equity multiple
- 1.24×
- Total profit
- $10,874
- Equity at exit
- $13,825
Cash invested: $44,772 (down + closing). Projections, not guarantees.
Landlord ↔ Tenant lean methodology
- Overall (STATE)
- 85 Strongly Landlord-Friendly
- State North Carolina
- 85 Strongly Landlord-Friendly · R+3
- County
- — inherits STATE
- City
- — inherits STATE
ZIP-level market 28144
- Active inventory
- 291
- Price-to-rent
- 8.5×
Monthly cashflow live
- Estimated rent
- $1,572 high interval (Pro) →
- Mortgage (P&I)
- −$839
- Tax from tax record
- −$92 /mo · $1,103/yr
- Insurance
- −$67
- HOA
- −$0
- Vacancy / Maint / Mgmt
- −$330
- Net cashflow
- $245
Break-even live
UW: 25.0% down · 7.5% · 30yr · 1.5% tax · 5.0% vac · 8.0% maint · 8.0% mgmt
Financing live
Cash to close
- Down payment
- $39,975
- Closing costs
- $4,797
- Reserves months
- —
- Total cash needed
- —
Loan-product check · same deal, 3 products live
Conventional
25% down · 7.5% · 30yr
- Down + closing
- —
- Monthly P&I
- —
- Monthly cashflow
- —
- DSCR
- —
- Eligible?
- —
Personal DTI + credit; lowest rate.
DSCR
20% down · 8.5% · 30yr
- Down + closing
- —
- Monthly P&I
- —
- Monthly cashflow
- —
- DSCR
- —
- Eligible?
- —
No personal income docs; deal must DSCR.
Hard money
10% down · 12.0% · 12mo
- Down + closing
- —
- Monthly P&I
- —
- Monthly cashflow
- —
- DSCR
- —
- Eligible?
- —
Short-term bridge; refi at stabilization.
Rent comps 14 comps
| Address | Beds | Baths | Sqft | Rent | $/sqft | DOM | Units | Dist |
|---|---|---|---|---|---|---|---|---|
| 322 W McCubbins St Salisbury, NC | 2.0 | 1.0 | 900 | $1,050 | $1.17 | 2d | 1 | 0.21mi |
| 1039 Old Plank Rd Salisbury, NC | 2.0 | 1.0 | 923 | $1,290 | $1.40 | 23d | 1 | 0.70mi |
| 839 Carpenters Cir Salisbury, NC | 3.0 | 2.0 | 1188 | $1,560 | $1.31 | 23d | 1 | 0.80mi |
| 201 E Innes St #204 Salisbury, NC | 2.0 | 2.0 | 912 | $1,650 | $1.81 | 23d | 1 | 0.82mi |
| 100 Emerson Ln Salisbury, NC | 2.0–3.0 | 2.0 | 1101 | $1,242 | $1.13 | 23d | 1 | 1.12mi |
| 210 Sunset Dr Salisbury, NC | 1.0–2.0 | 1.0–2.0 | 1018 | $1,475 | $1.45 | 23d | 1 | 1.20mi |
| 200 Hamilton Dr Salisbury, NC | 3.0 | 1.0–2.0 | 750 | $1,510 | $2.01 | 1d | 18 | 1.20mi |
| 321 Woodson St Salisbury, NC | 1.0–3.0 | 1.0–2.5 | 1091 | $1,625 | $1.49 | 12d | 13 | 1.24mi |
| 718 Park Ave Salisbury, NC | 3.0 | 2.0 | 1199 | $1,700 | $1.42 | 17d | 1 | 1.29mi |
| 237 Century Dr Salisbury, NC | 3.0 | 2.5 | 1500 | $1,475 | $0.98 | 4d | 1 | 1.29mi |
| 706 N Main St Salisbury, NC | 3.0 | 2.0 | 1176 | $1,700 | $1.45 | 17d | 1 | 1.33mi |
| 808 Crown Point Dr Salisbury, NC | 3.0 | 2.5 | 1500 | $1,830 | $1.22 | 23d | 1 | 1.48mi |
| 202 N Merritt Ave Salisbury, NC | 3.0 | 1.5 | 1591 | $1,495 | $0.94 | 20d | 1 | 1.49mi |
| 816 Crown Point Dr Salisbury, NC | 3.0 | 3.0 | 1500 | $3,500 | $2.33 | 23d | 1 | 1.49mi |
Listing history 15 events
-
2026-06-18days on market $159,900 Active 77 DOM
-
2026-06-17days on market $159,900 Active 76 DOM
-
2026-06-16days on market $159,900 Active 75 DOM
-
2026-06-15days on market $159,900 Active 74 DOM
-
2026-06-13days on market $159,900 Active 72 DOM
-
2026-06-09days on market $159,900 Active 68 DOM
-
2026-06-08days on market $159,900 Active 67 DOM
-
2026-06-07days on market $159,900 Active 66 DOM
-
2026-06-04days on market $159,900 Active 63 DOM
-
2026-06-03days on market $159,900 Active 62 DOM
-
2026-06-02days on market $159,900 Active 61 DOM
-
2026-06-01days on market $159,900 Active 60 DOM
-
2026-05-31days on market $159,900 Active 59 DOM
-
2026-04-22price $159,900
-
2026-04-02$169,900 Active
ⓘ Source: listings_history table (triggers on properties + properties_extension) + one-shot
backfill from property_details.listing_events for pre-trigger history.
Tax reassessment forecast NC · Resets to sale price
- Current annual tax
- $1,103 · $92/mo
- Projected year-2 tax
- $1,311 · $109/mo
- Expected delta
- +$208/yr (+$17/mo · 18.9%)
ⓘ Screening estimate from a state-policy table — verify with the county assessor before closing.
Climate risk First Street
- Flood 1/10 Low FEMA zone X (unshaded) · 0% chance over 30 yrs
- Wildfire 1/10 Low
- Heat 6/10 Major 7 d/yr ≥104°F today · 17 d/yr by 30 yrs out
- Wind 4/10 Moderate 13% chance of damaging wind over 30 yrs
- Air quality 3/10 Moderate 2 unhealthy d/yr today · 3 by 30 yrs out
Nearby sold comps map
Loading sold comps map…
Walkable amenities ~0.75 mi
Loading nearby amenities…
Taxation est. · year 1
- Rental income
- $18,863
- − Mortgage interest
- −$8,957
- − Property taxes
- −$1,103
- − Insurance
- −$800
- − Repairs & maintenance
- −$1,509
- − Management
- −$1,509
- − Depreciation
- −$4,652
- Taxable income
- $334
- Est. tax owed @ 24.0%
- −$80
- After-tax cash flow
- $2,857/yr
For passive investors: Depreciation is non-cash, so a rental often shows a tax loss while cash-flowing — sheltering income. Rental losses are passive: they offset passive income freely, and up to $25,000/yr can offset ordinary (W-2) income if you actively participate and your MAGI is under $100k (phasing out to $0 by $150k); unused losses carry forward. On sale, claimed depreciation is recaptured at up to 25%, and gains may owe capital-gains tax (a 1031 exchange can defer both). Figures are a year-1 estimate at your 24.0% rate — not tax advice; consult a CPA.
Schools (NCES district)
- District
- Rowan-Salisbury Schools
- NCES district ID
- 3704050
- Math proficiency
- 26% ▲ 2.00%
- Reading proficiency
- 35% ▲ 1.00%
- Median HH income
- $43,953
- Composite
- 26.01/100
- National rank
- #7317
- State rank
- #142 of 178 in NC
Livability — Salisbury
- Score
- 64/100
- State rank
- #365
- US rank
- #14533
Category grades
Schools grade is shown separately in the Schools card above.
Census & demographics
- Census place
- Salisbury, NC
- County
- Rowan County · 103,630 people
- City population
- 85,081
- Metro
- Charlotte-Concord-Gastonia, NC-SC
- Population (ZIP)
- 27,977
- Household income
- $52,568
- Rent vs Own
- Severe rent burden
- 1438.0
Population outlook (Rowan County) Hauer SSP2
- Today (2025)
- 140,430 people
- By 2030
- 140,193 · -0.2%
- By 2040
- 137,617 · -2.0%
- By 2050
- 131,826 · -6.1%
- By 2075
- 115,123 · -18.0%
- By 2100
- 92,774 · -33.9%
Race, ethnicity, and origin ACS 2023
- Neighborhood character
- Diverse neighborhood (Simpson 0.63)
- Race & ethnicity
- White 49% Black 35% Hispanic / Latino 12% Two or more races 7%
- Hispanic origin (detail)
- Mexican 4% Puerto Rican 2%
- Common ancestry
- Serbian 3% Slovak 2% Lithuanian 1%
- Foreign-born
- 5% · Canada
- Languages at home
- 91% English-only · Spanish 7% Other Indo-European 1%
Political lean MEDSL · Rowan
- 2024 margin
- Solid R (+35.9) · D 31.6% · R 67.5%
- 2008→2024 swing
- -13.1pp toward R · 2008: -22.8pp · 2024: -35.9pp
- All cycles
- 2024: R+35.9 2020: R+35.7 2016: R+36.8 2012: R+26.0 2008: R+22.8
Not yet ingested
- Civics
- —
Market trends
- HPI YoY
- ▼ -217.00%
- Current HPI
- 276.1097
- Rent YoY
- —
- Metro
- Charlotte-Concord-Gastonia, NC-SC
- State GDP YoY
- ▲ 3.28%
- F500 in state
- 26
Industry mix (Fortune 500 HQ in NC)
| Industry | F500 HQs | Revenue |
|---|---|---|
| Financial Services | 2 | $213B |
|
||
| Retail | 2 | $95B |
|
||
| Industrial Conglomerate | 1 | $38B |
|
||
| Metals / Steel | 1 | $35B |
|
||
| Utilities | 1 | $30B |
|
||
| Industrial Machinery | 1 | $19B |
|
||
Price history
-5.9% since first listed2 events — show timeline
- 2026-04-22 Price Changed $159,900 CANOPYMLS as Distributed by MLS Grid
- 2026-04-02 Listed $169,900 CANOPYMLS as Distributed by MLS Grid
Property tax history
+4.0%/yrLatest (2025): $1,103 · +0.0% YoY. Source: county tax records.
Cash-flow waterfall
monthlySold comps — $/sqft
last 12 mo · ≤1 miLoading sold comps…