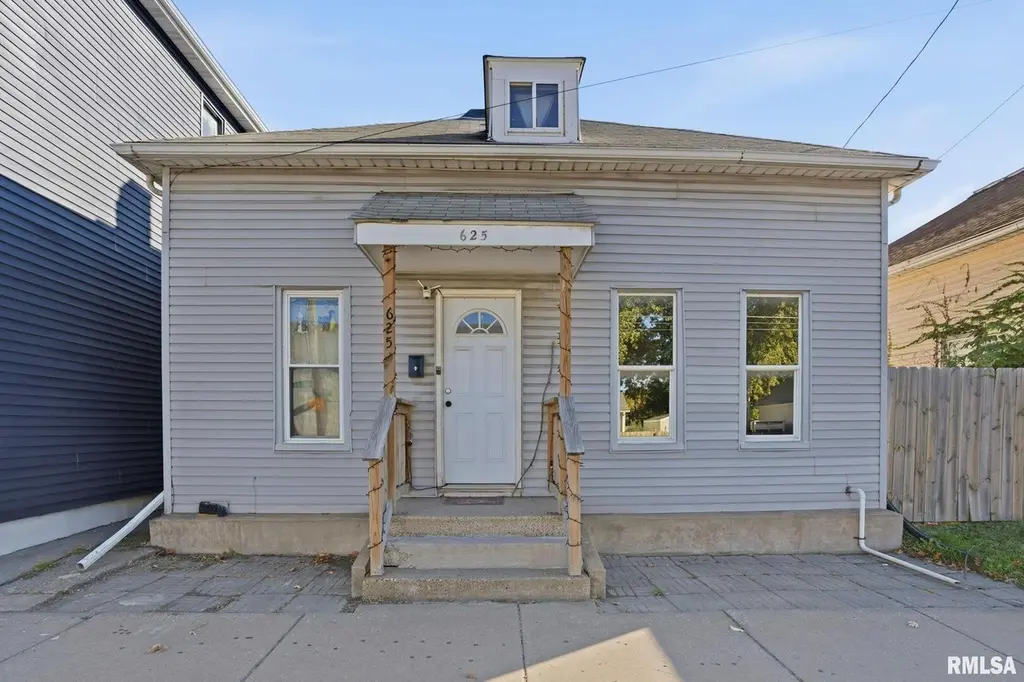
625 N Division St · Davenport, IA
Flood risk 6/10 · Moderate
- FEMA flood zone
- X (unshaded)
- Chance of flooding over 30 yrs
- 0.68%
- Est. flood insurance / yr
- $473 – $860
Fire risk 1/10 · Minimal
- Est. fire insurance / yr
- $902 – $1,676
Heat risk 3/10 · Minor
- Hot days now (above 103°F)
- 7 days/yr
- Hot days in 30 yrs
- 16 days/yr
Wind risk 2/10 · Minimal
- Chance of severe wind over 30 yrs
- —
Air-quality risk 3/10 · Minor
- Unhealthy air days now
- 2 days/yr
- Unhealthy air days in 30 yrs
- 3 days/yr
Risk factors via First Street. Map © Google.
Why this score? — see what drove the D+ grade
The composite is a weighted blend of 9 inputs, each scored 0–100. Each bar is that input's sub-score; the figure is the points it added to the 100-point composite (weight × sub-score).
- Cash flow +20.5/30.0
- DSCR +6.5/10.0
- 1% rule +4.8/10.0
- Livability +4.0/5.0
- Schools +3.9/10.0
- Rent growth +2.5/5.0
- Condition / age +2.5/5.0
- ARV discount +1.3/15.0
- Appreciation +0.0/10.0
$95,000
🖨 Deal sheet 📄 Offer letter ✓ Due diligence
Listing remarks MLS
Solid single-family home offering strong upside in a convenient Davenport location. This 1-story, 3 bedroom, 1 bath residence features 1,026 SF of living space with a full basement providing excellent potential for additional finished space or storage. Mechanical updates include a newer water heater (2023) and a high-efficiency gas furnace, along with central air for year-round comfort. Exterior highlights include low-maintenance vinyl siding and a private patio ideal for outdoor enjoyment. Street and shared parking available. With flexible space, solid construction, and proven rental appeal, this property is well-suited for both investors and owner-occupants looking to add value. Don't miss the opportunity to unlock this home's potential
Key facts
- Full basement
- Private patio
- Newer water heater
Tags
Neighborhood map
What this means for you Summary
Snapshot
- This is a 2-bed/1.5-bath single-family listed at $95k.
Deal economics
- At list price, monthly cash flow is $124 ($1k/yr) — positive.
- The deal already cash-flows at list — no discount required.
- To meet the 1% rule (rent ≥ 1% of price), the offer needs to be $93k (2.3% below list).
- Recommended offer: $86k (9.0% below list) — sets the bar for market timing.
- Cap rate 7.9% vs local median 4.4% in Davenport — top-decile yield for the area; either an underpriced asset or a hidden risk that comps aren't pricing in. Stress-test before assuming the spread holds.
Location & tenants
- Location reads 79/100 on livability (#126 in IA, #2,312 nationally) — a middle-class / working-renter tenant base. Strengths: cost of living A+, housing A+, health & safety A+; Watch: employment C-, crime F.
- Davenport Community School District (urban): math 43% / reading 50% proficiency, ranked #288 of 289 in IA (top 100%) — families likely to look elsewhere, expect single-tenant / working-renter base with shorter leases.
- Market conditions: 68 active listings in the ZIP; 33 comparable units currently listed for rent nearby; rentals lingering (median 44d on market — plan ~5-8 weeks vacancy on turnover, expect pricing pressure); 58% of comp listings sitting > 30 days — soft ceiling on asking rent; 805 units permitted in Scott County in 2024 (479 in 5+ unit buildings).
Forward outlook
- Local home prices are declining (-3.0%/yr); year-one equity from $657 of loan paydown is wiped out by about $3k of value loss. Plan a longer hold.
- Scott County population projected at +19% by 2050 — long-run rental-demand tailwind backs the buy-and-hold thesis.
Negotiation context
- It's been on market 115 days — a 9% lower offer ($86k) is reasonable based on typical stale-listing flexibility.
- 7 sale attempts with the ask held roughly flat each time — persistent listings suggest the price (not the market) is what's stuck; bring a comps-based counter.
- Current owner paid $20k; list at $95k implies a 375% gain — meaningful room to come down on a strong offer.
Risks & watch-outs
- Watch-outs: built in 1900 — expect roof / HVAC / electrical / plumbing capex.
- Climate carrying-cost: major flood risk — expect insurance premiums to compound above CPI over the hold.
Questions for the listing agent
- It's been on market 115 days. Have you received any prior offers? Is the seller open to a 9% concession, seller financing, or rate buy-down credit?
- Built in 1900 — when were the roof, HVAC, electrical panel, plumbing, and water heater last replaced?
- Why hasn't it sold? Are there any deal-killer items the seller is aware of (foundation, flood, title, zoning, code violations)?
- Is there a deadline driving the sale (1031 exchange, divorce, estate, relocation)? That informs how much negotiation room exists.
- Crime grade is F in this area — have there been break-ins, vandalism, or insurance claims at this property in the last 3 years? What carrier currently insures it and at what premium?
- The area grade is low — what's the realistic commute time and amenity access for the typical tenant pool here? Any planned neighborhood developments (good or bad) we should know about?
- What's the average days-on-market for RENTAL listings here right now (not sales)? A rising rental-DOM trend means longer vacancies and softer asking-rent achievability than the comps imply.
- What's the recent tenant-quality profile in this submarket — average credit score on applications, eviction rate, late-payment / NSF rate, and stable-employment percentage? A property-management company in the area should have these aggregated.
- How much new for-sale + rental construction is in the pipeline within 1–3 miles? Heavy new supply typically softens prices + rents 12–24 months out; constrained supply supports both.
Investment metrics
- 1% rule
- 0.98% ✗
- Cap rate
- 7.87%
- Cash-on-cash
- 5.61%
- DSCR
- 1.25
- GRM
- 8.5
CMA / ARV
- ARV (median comp)
- $83,528
- List price
- $95,000
- Delta
- 13.73%
- Verdict
- OVERPRICED
- Comps
- 20 within 1.0 mi
Show comp detail 12 sales within ~0.75 mi
| Address | Dist | Beds/Ba | Sqft | Sold | Price | $/sf | Match |
|---|---|---|---|---|---|---|---|
| 1621 W 7th St | 0.09mi | 2/1.0 | 997 (-3%) | 2mo | $45,101 | $45 | 88 |
| 1701 W 8th St | 0.09mi | 3/1.0 (+1) | 1,090 (+6%) | 3mo | $78,500 | $72 | 76 |
| 2025 W 3rd St | 0.49mi | 3/1.0 (+1) | 1,020 (-1%) | 2mo | $125,000 | $123 | 67 |
| 636 Cedar St | 0.36mi | 2/1.0 | 944 (-8%) | 3mo | $68,000 | $72 | 66 |
| 1824 W 8th St | 0.11mi | 3/1.0 (+1) | 1,140 (+11%) | 6mo | $112,000 | $98 | 64 |
| 1207 N Marquette St | 0.62mi | 3/1.5 (+1) | 1,038 (+1%) | 6mo | $138,000 | $133 | 58 |
| 1703 N Division St | 0.72mi | 2/1.0 | 960 (-6%) | 3mo | $95,000 | $99 | 51 |
| 1417 W 12th St | 0.47mi | 2/1.0 | 872 (-15%) | 1mo | $77,000 | $88 | 50 |
| 1901 W 16th St | 0.66mi | 2/1.0 | 917 (-11%) | 3mo | $139,900 | $153 | 47 |
| 809 Cimarron Dr | 0.74mi | 3/1.0 (+1) | 1,092 (+6%) | 3mo | $164,000 | $150 | 45 |
| 2008 Dixwell St | 0.65mi | 3/1.0 (+1) | 1,140 (+11%) | 4mo | $118,000 | $104 | 41 |
| 507 Waverly Rd | 0.74mi | 3/1.0 (+1) | 1,116 (+9%) | 10mo | $67,500 | $60 | 35 |
Match score weights: distance 35% · size 25% · config 20% · recency 20%. Top-matched comps best support the ARV.
Projected returns pro-forma
-3.0% appreciation · 3.0% rent growth · sell at horizon
- IRR
- -7.6%
- Equity multiple
- 0.72×
- Total profit
- $-7,482
- Equity at exit
- $14,165
- IRR
- 1.9%
- Equity multiple
- 1.14×
- Total profit
- $3,630
- Equity at exit
- $8,214
Cash invested: $26,600 (down + closing). Projections, not guarantees.
Landlord ↔ Tenant lean methodology
- Overall (STATE)
- 83 Strongly Landlord-Friendly
- State Iowa
- 83 Strongly Landlord-Friendly · R+6
- County
- — inherits STATE
- City
- — inherits STATE
ZIP-level market 52802
- Home prices YoY
- -28.3%
- Active inventory
- 68
- Price-to-rent
- 8.5×
Monthly cashflow live
- Estimated rent
- $928 high interval (Pro) →
- Mortgage (P&I)
- −$498
- Tax from tax record
- −$71 /mo · $852/yr
- Insurance
- −$40
- HOA
- −$0
- Vacancy / Maint / Mgmt
- −$195
- Net cashflow
- $124
Break-even live
UW: 25.0% down · 7.5% · 30yr · 1.5% tax · 5.0% vac · 8.0% maint · 8.0% mgmt
Financing live
Cash to close
- Down payment
- $23,750
- Closing costs
- $2,850
- Reserves months
- —
- Total cash needed
- —
Loan-product check · same deal, 3 products live
Conventional
25% down · 7.5% · 30yr
- Down + closing
- —
- Monthly P&I
- —
- Monthly cashflow
- —
- DSCR
- —
- Eligible?
- —
Personal DTI + credit; lowest rate.
DSCR
20% down · 8.5% · 30yr
- Down + closing
- —
- Monthly P&I
- —
- Monthly cashflow
- —
- DSCR
- —
- Eligible?
- —
No personal income docs; deal must DSCR.
Hard money
10% down · 12.0% · 12mo
- Down + closing
- —
- Monthly P&I
- —
- Monthly cashflow
- —
- DSCR
- —
- Eligible?
- —
Short-term bridge; refi at stabilization.
Rent comps 33 comps
| Address | Beds | Baths | Sqft | Rent | $/sqft | DOM | Units | Dist |
|---|---|---|---|---|---|---|---|---|
| 627 N Division St Davenport, IA | 2.0 | 1.0 | 800 | $800 | $1.00 | 43d | 1 | 0.02mi |
| 1529 W 6th St Davenport, IA | 2.0 | 1.0 | 794 | $850 | $1.07 | 13d | 1 | 0.17mi |
| 1603 W 10th St Unit 2 Davenport, IA | 1.0 | 1.0 | 900 | $700 | $0.78 | 43d | 1 | 0.20mi |
| 1607 W 12th St Davenport, IA | 1.0–2.0 | 1.0 | 800 | $740 | $0.93 | 43d | 3 | 0.27mi |
| 1455 W 12th St Davenport, IA | 3.0 | 1.0 | 942 | $1,095 | $1.16 | 13d | 1 | 0.40mi |
| 1341 W 4th St Davenport, IA | 3.0 | 1.5 | 979 | $1,394 | $1.42 | 43d | 1 | 0.46mi |
| 1445 W 16th St Unit 3 Davenport, IA | 2.0 | 1.0 | 765 | $915 | $1.20 | 43d | 1 | 0.66mi |
| 445 Waverly Rd Davenport, IA | 2.0 | 1.0 | 980 | $1,200 | $1.22 | 43d | 1 | 0.74mi |
| 730 Brown St Unit 3 Davenport, IA | 2.0 | 1.0 | 1000 | $800 | $0.80 | 43d | 1 | 0.85mi |
| 308 S Lincoln Ave Davenport, IA | 1.0 | 1.0 | 825 | $825 | $1.00 | 21d | 1 | 0.87mi |
| 915 W 14th St Davenport, IA | 3.0 | 1.0 | 1390 | $900 | $0.65 | 43d | 1 | 0.89mi |
| 510 S Lincoln Ave Davenport, IA | 2.0 | 1.0 | 1184 | $1,195 | $1.01 | 21d | 1 | 0.92mi |
| 1318 1/2 Brown St Davenport, IA | 2.0 | 1.0 | 900 | $875 | $0.97 | 21d | 1 | 0.97mi |
| 1315 Brown St Unit 2 Davenport, IA | 3.0 | 1.0 | 1300 | $1,250 | $0.96 | 21d | 1 | 0.99mi |
| 301 S Thornwood Ave Davenport, IA | 3.0 | 1.0 | 1242 | $1,395 | $1.12 | 13d | 1 | 1.00mi |
| 1011 W Locust St Apt 1 Davenport, IA | 1.0 | 1.0 | 750 | $675 | $0.90 | 43d | 1 | 1.02mi |
| 619 W 16th St Unit 4 Davenport, IA | 1.0 | 1.0 | 700 | $745 | $1.06 | 43d | 1 | 1.16mi |
| 537 W 16th St Davenport, IA | 3.0 | 1.0 | 1311 | $1,400 | $1.07 | 43d | 1 | 1.19mi |
| 2608 Wilkes Ave Davenport, IA | 2.0 | 1.0 | 755 | $950 | $1.26 | 21d | 1 | 1.30mi |
| 1519 N Ripley St Davenport, IA | 2.0 | 1.0 | 1144 | $1,100 | $0.96 | 13d | 1 | 1.33mi |
| 410 N Main St Unit 230 Davenport, IA | 2.0 | 1.0 | 800 | $1,250 | $1.56 | 43d | 1 | 1.33mi |
| 901 W 15th St Davenport, IA | 1.0–2.0 | 1.0–2.0 | 950 | $895 | $0.94 | 13d | 1 | 1.33mi |
| 1615 1/2 N Ripley St Davenport, IA | 2.0 | 1.0 | 900 | $825 | $0.92 | 43d | 1 | 1.36mi |
| 108 W 5th St Unit 5 Davenport, IA | 1.0 | 1.0 | 737 | $875 | $1.19 | 43d | 1 | 1.38mi |
| 133 W 13th St Apt 3 Davenport, IA | 2.0 | 1.0 | 800 | $1,150 | $1.44 | 13d | 1 | 1.39mi |
| 401 Brady St Davenport, IA | 1.0–3.0 | 1.0–2.0 | 870 | $1,625 | $1.87 | 13d | 2 | 1.42mi |
| 421 N Brady St Unit 5 Davenport, IA | 1.0 | 1.0 | 780 | $968 | $1.24 | 43d | 1 | 1.43mi |
| 421 N Brady St Unit 11 Davenport, IA | 1.0 | 1.0 | 945 | $1,059 | $1.12 | 13d | 1 | 1.43mi |
| 1421 N Main St #2 Davenport, IA | 3.0 | 1.0 | 1350 | $1,095 | $0.81 | 43d | 1 | 1.43mi |
| 212 N Brady St Davenport, IA | 2.0–3.0 | 2.0–3.0 | 1428 | $1,900 | $1.33 | 13d | 4 | 1.43mi |
| 427 N Brady St Unit 6 Davenport, IA | 2.0 | 1.0 | 916 | $995 | $1.09 | 43d | 1 | 1.43mi |
| 427 N Brady St Unit 1 Davenport, IA | 3.0 | 1.5 | 1126 | $1,359 | $1.21 | 43d | 1 | 1.43mi |
| 106 E 3rd St Davenport, IA | 1.0–2.0 | 1.0 | 812 | $1,299 | $1.60 | 43d | 1 | 1.44mi |
Listing history 29 events
-
2026-06-18days on market $95,000 Active 115 DOM
-
2026-06-17days on market $95,000 Active 114 DOM
-
2026-06-16days on market $95,000 Active 113 DOM
-
2026-06-15days on market $95,000 Active 112 DOM
-
2026-06-14days on market $95,000 Active 110 DOM
-
2026-06-13days on market $95,000 Active 109 DOM
-
2026-06-10days on market $95,000 Active 107 DOM
-
2026-06-09days on market $95,000 Active 106 DOM
-
2026-06-08days on market $95,000 Active 105 DOM
-
2026-06-07days on market $95,000 Active 104 DOM
-
2026-06-03days on market $95,000 Active 100 DOM
-
2026-06-02days on market $95,000 Active 99 DOM
-
2026-06-01days on market $95,000 Active 98 DOM
-
2026-05-31days on market $95,000 Active 97 DOM
-
2026-05-30days on market $95,000 Active 96 DOM
-
2026-02-23historical
Show marketing remark (748 chars)
Solid single-family home offering strong upside in a convenient Davenport location. This 1-story, 3 bedroom, 1 bath residence features 1,026 SF of living space with a full basement providing excellent potential for additional finished space or storage. Mechanical updates include a newer water heater (2023) and a high-efficiency gas furnace, along with central air for year-round comfort. Exterior highlights include low-maintenance vinyl siding and a private patio ideal for outdoor enjoyment. Street and shared parking available. With flexible space, solid construction, and proven rental appeal, this property is well-suited for both investors and owner-occupants looking to add value. Don't miss the opportunity to unlock this home's potential
-
2026-02-23$95,000 Active 748-char remark
Show marketing remark (748 chars)
Solid single-family home offering strong upside in a convenient Davenport location. This 1-story, 3 bedroom, 1 bath residence features 1,026 SF of living space with a full basement providing excellent potential for additional finished space or storage. Mechanical updates include a newer water heater (2023) and a high-efficiency gas furnace, along with central air for year-round comfort. Exterior highlights include low-maintenance vinyl siding and a private patio ideal for outdoor enjoyment. Street and shared parking available. With flexible space, solid construction, and proven rental appeal, this property is well-suited for both investors and owner-occupants looking to add value. Don't miss the opportunity to unlock this home's potential
-
2026-01-08status Active
-
2026-01-07historical
-
2026-01-06historical
-
2026-01-06status Active
-
2026-01-05historical
-
2025-12-18historical
-
2025-12-18historical
-
2025-12-18Active
-
2025-12-18Active
-
2025-12-18Active
-
2025-12-18Active
-
2018-05-30soldstatus $20,000
ⓘ Source: listings_history table (triggers on properties + properties_extension) + one-shot
backfill from property_details.listing_events for pre-trigger history.
Tax reassessment forecast IA · Partial reset (capped growth)
- Current annual tax
- $852 · $71/mo
- Projected year-2 tax
- $1,172 · $98/mo
- Expected delta
- +$320/yr (+$27/mo · 37.5%)
ⓘ Screening estimate from a state-policy table — verify with the county assessor before closing.
Climate risk First Street
- Flood 6/10 Major FEMA zone X (unshaded) · 68% chance over 30 yrs
- Wildfire 1/10 Low
- Heat 3/10 Moderate 7 d/yr ≥103°F today · 16 d/yr by 30 yrs out
- Wind 2/10 Low
- Air quality 3/10 Moderate 2 unhealthy d/yr today · 3 by 30 yrs out
Nearby sold comps map
Loading sold comps map…
Walkable amenities ~0.75 mi
Loading nearby amenities…
Taxation est. · year 1
- Rental income
- $11,138
- − Mortgage interest
- −$5,321
- − Property taxes
- −$852
- − Insurance
- −$475
- − Repairs & maintenance
- −$891
- − Management
- −$891
- − Depreciation
- −$2,764
- Taxable loss
- −$56
- Est. tax savings @ 24.0%
- +$14
- After-tax cash flow
- $1,507/yr
For passive investors: Depreciation is non-cash, so a rental often shows a tax loss while cash-flowing — sheltering income. Rental losses are passive: they offset passive income freely, and up to $25,000/yr can offset ordinary (W-2) income if you actively participate and your MAGI is under $100k (phasing out to $0 by $150k); unused losses carry forward. On sale, claimed depreciation is recaptured at up to 25%, and gains may owe capital-gains tax (a 1031 exchange can defer both). Figures are a year-1 estimate at your 24.0% rate — not tax advice; consult a CPA.
Schools (NCES district)
- District
- Davenport Community School District
- NCES district ID
- 1908580
- Math proficiency
- 43% ▼ -11.00%
- Reading proficiency
- 50% ▼ -3.00%
- Median HH income
- $46,157
- Composite
- 39.49/100
- National rank
- #3951
- State rank
- #288 of 289 in IA
Livability — Davenport
- Score
- 79/100
- State rank
- #126
- US rank
- #2312
Category grades
Schools grade is shown separately in the Schools card above.
Census & demographics
- Census place
- Davenport, IA
- County
- Scott County · 144,583 people
- City population
- 103,319
- Metro
- Davenport-Moline-Rock Island, IA-IL
- Population (ZIP)
- 9,466
- Household income
- $54,380
- Rent vs Own
- Severe rent burden
- 244.0
Population outlook (Scott County) Hauer SSP2
- Today (2025)
- 188,878 people
- By 2030
- 196,648 · +4.1%
- By 2040
- 210,860 · +11.6%
- By 2050
- 224,359 · +18.8%
- By 2075
- 258,884 · +37.1%
- By 2100
- 286,447 · +51.7%
Race, ethnicity, and origin ACS 2023
- Neighborhood character
- Predominantly White (71%)
- Race & ethnicity
- White 71% Hispanic / Latino 14% Two or more races 10% Black 5% Asian 1%
- Hispanic origin (detail)
- Mexican 13%
- Common ancestry
- Romanian 2% Lithuanian 1% Italian 1%
- Foreign-born
- 4% · Canada, Vietnam
- Languages at home
- 92% English-only · Spanish 7%
Political lean MEDSL · Scott
- 2024 margin
- Toss-up / Even · D 47.3% · R 51.2% · Other 1.4%
- 2008→2024 swing
- -18.4pp toward R · 2008: 14.6pp · 2024: -3.9pp
- All cycles
- 2024: R+3.9 2020: D+3.5 2016: D+1.4 2012: D+13.8 2008: D+14.6
Not yet ingested
- Civics
- —
Market trends
- HPI YoY
- ▼ -59.59%
- Current HPI
- 151.2076
- Rent YoY
- —
- Metro
- Davenport-Moline-Rock Island, IA-IL
- State GDP YoY
- ▲ 2.48%
- F500 in state
- 4
Industry mix (Fortune 500 HQ in IA)
| Industry | F500 HQs | Revenue |
|---|---|---|
| Financial Services | 1 | $16B |
|
||
| Retail / Convenience | 1 | $15B |
|
||
Price history
+375.0% since first listed14 events — show timeline
- 2026-02-23 Listed $95,000 MRED as Distributed by MLS Grid
- 2026-02-23 Listing Removed — MRED as Distributed by MLS Grid
- 2026-01-08 Relisted — MRED as Distributed by MLS Grid
- 2026-01-07 Listing Removed — MRED as Distributed by MLS Grid
- 2026-01-06 Listing Removed — RMLSA as Distributed by MLS Grid
- 2026-01-06 Relisted — MRED as Distributed by MLS Grid
- 2026-01-05 Listing Removed — MRED as Distributed by MLS Grid
- 2025-12-18 Listing Removed — MRED as Distributed by MLS Grid
- 2025-12-18 Listing Removed — RMLSA as Distributed by MLS Grid
- 2025-12-18 Listed — RMLSA as Distributed by MLS Grid
- 2025-12-18 Listed — MRED as Distributed by MLS Grid
- 2025-12-18 Listed — RMLSA as Distributed by MLS Grid
- 2025-12-18 Listed — MRED as Distributed by MLS Grid
- 2018-05-30 Sold (Public Records) $20,000 Public Records
Property tax history
+0.8%/yrLatest (2025): $852 · -25.5% YoY. Source: county tax records.
Cash-flow waterfall
monthlySold comps — $/sqft
last 12 mo · ≤1 miLoading sold comps…