26152 Azalea Oak Cres · Leesburg, FL
Flood risk 1/10 · Minimal
- FEMA flood zone
- A
- Chance of flooding over 30 yrs
- 0.0%
- Est. flood insurance / yr
- $1,009 – $1,996
Fire risk 5/10 · Moderate
- Est. fire insurance / yr
- $947 – $1,759
Heat risk 8/10 · Major
- Hot days now (above 108°F)
- 6 days/yr
- Hot days in 30 yrs
- 19 days/yr
Wind risk 9/10 · Severe
- Chance of severe wind over 30 yrs
- 99.0%
Air-quality risk 2/10 · Minimal
- Unhealthy air days now
- 1 days/yr
- Unhealthy air days in 30 yrs
- 2 days/yr
Risk factors via First Street. Map © Google.
Why this score? — see what drove the D+ grade
The composite is a weighted blend of 9 inputs, each scored 0–100. Each bar is that input's sub-score; the figure is the points it added to the 100-point composite (weight × sub-score).
- Cash flow +17.1/30.0
- ARV discount +8.6/15.0
- DSCR +5.3/10.0
- 1% rule +4.6/10.0
- Schools +4.2/10.0
- Condition / age +4.0/5.0
- Livability +3.1/5.0
- Rent growth +2.9/5.0
- Appreciation +0.0/10.0
$376,960
🖨 Deal sheet 📄 Offer letter ✓ Due diligence
Listing remarks
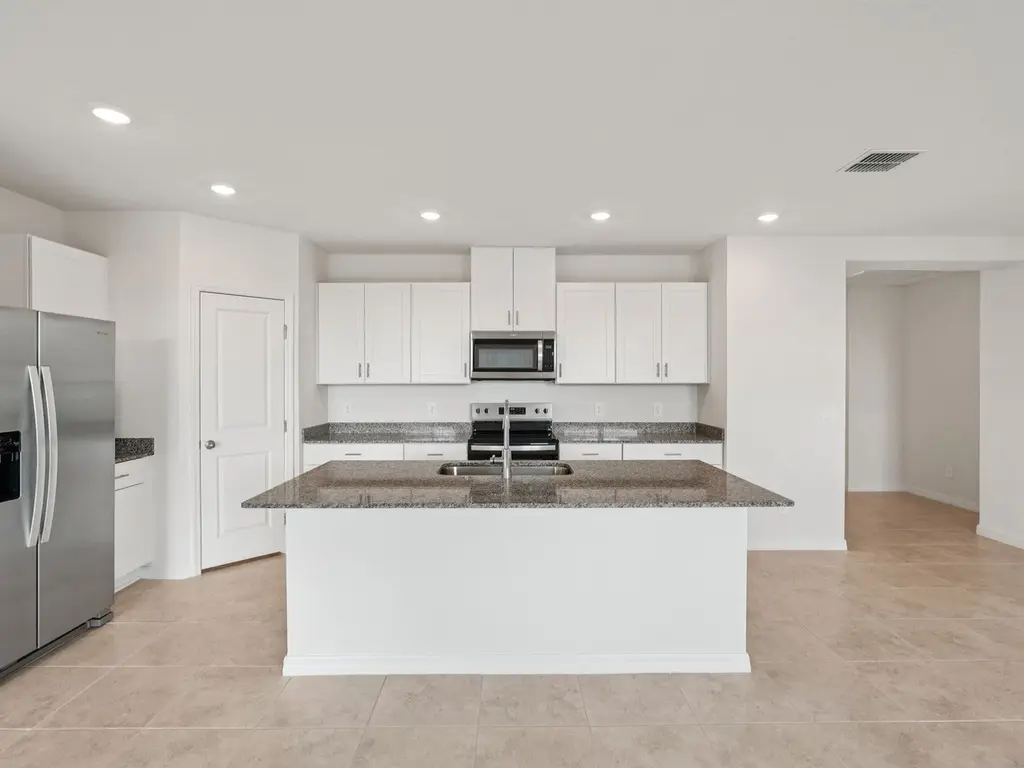
Prepare dinner from this home's open kitchen which overlooks a spacious great room.
Key facts
- Spacious great room
- Open kitchen
- 2 garage spots
Tags
Property features AI
Finance
- Financial info: List price $376,960
Exterior
- Parking: 2 total parking spaces; 2-car garage
- Home design: Single-family home (spec new construction), Foxglove plan; Active listing
- Exterior features: Living area approximately 1,840 (living area reported)
Interior
- Bedrooms: 4 bedrooms
- Bathrooms: 2 full bathrooms
- Interior features: Spec home, Foxglove plan
Neighborhood map
What this means for you Summary
Snapshot
- This is a 4-bed/2.0-bath single-family listed at $377k. Condition is rated good.
Deal economics
- At list price, monthly cash flow is $134 ($2k/yr) — positive.
- The deal already cash-flows at list — no discount required.
- To meet the 1% rule (rent ≥ 1% of price), the offer needs to be $363k (3.8% below list).
- Recommended offer: $363k (3.8% below list) — sets the bar for 1% rule.
- Cap rate 7.1% vs local median 4.5% in Leesburg — top-decile yield for the area; either an underpriced asset or a hidden risk that comps aren't pricing in. Stress-test before assuming the spread holds.
Location & tenants
- Location reads 62/100 on livability (#751 in FL) — a middle-class / working-renter tenant base. Strengths: cost of living A+, housing A+; Watch: schools D+, crime D, amenities F.
- Lake (suburban): math 49% / reading 50% proficiency, ranked #37 of 73 in FL (top 51%) — families likely to look elsewhere, expect single-tenant / working-renter base with shorter leases.
- Market conditions: Rents rising (+1.7%/yr); 585 active listings in the ZIP; 2 comparable units currently listed for rent nearby; solid renter incomes; 4,799 units permitted in Lake County in 2024 (814 in 5+ unit buildings).
- At $3,625/mo this rent would consume 48% of the median local household income ($91k/yr) (locally 216% of renters already pay >50% of income on rent) — very limited rent-growth headroom before tenants either downsize or default.
Forward outlook
- Local home prices are declining (-3.0%/yr); year-one equity from $3k of loan paydown is wiped out by about $11k of value loss. Plan a longer hold.
- Lake County population projected at +37% by 2050 — long-run rental-demand tailwind backs the buy-and-hold thesis.
Negotiation context
- Only 2 days on market — expect competitive offers; lowballing is unlikely to land.
Risks & watch-outs
- Watch-outs: flood insurance adds $125/mo.
- Climate carrying-cost: in FEMA flood zone A (mandatory federal flood insurance); severe wind risk, 99% chance of damaging wind over 30y; moderate wildfire risk; extreme-heat days projected 6→19/yr by 2055 (HVAC capex compounding) — expect insurance premiums to compound above CPI over the hold.
Questions for the listing agent
- What's the actual annual flood-insurance premium (NFIP or private), and is the property in a SFHA with mandatory coverage?
- Is there a deadline driving the sale (1031 exchange, divorce, estate, relocation)? That informs how much negotiation room exists.
- Schools are D-rated, which usually means shorter tenancies and higher turnover. Who's the typical renter profile here, and what's been the actual vacancy rate?
- Crime grade is D in this area — have there been break-ins, vandalism, or insurance claims at this property in the last 3 years? What carrier currently insures it and at what premium?
- The area grade is low — what's the realistic commute time and amenity access for the typical tenant pool here? Any planned neighborhood developments (good or bad) we should know about?
- What's the average days-on-market for RENTAL listings here right now (not sales)? A rising rental-DOM trend means longer vacancies and softer asking-rent achievability than the comps imply.
- What's the recent tenant-quality profile in this submarket — average credit score on applications, eviction rate, late-payment / NSF rate, and stable-employment percentage? A property-management company in the area should have these aggregated.
- How much new for-sale + rental construction is in the pipeline within 1–3 miles? Heavy new supply typically softens prices + rents 12–24 months out; constrained supply supports both.
Investment metrics
- 1% rule
- 0.96% ✗
- Cap rate
- 7.12%
- Cash-on-cash
- 2.94%
- DSCR
- 1.13
- GRM
- 8.7
CMA / ARV
- ARV (on-the-fly)
- $386,400
- Comps found
- 9
Show comp detail 9 sales within ~0.75 mi
| Address | Dist | Beds/Ba | Sqft | Sold | Price | $/sf | Match |
|---|---|---|---|---|---|---|---|
| 3782 Arlington Ridge Blvd | 0.31mi | 3/2.0 (-1) | 1,725 (-6%) | 4mo | $424,000 | $246 | 67 |
| 3805 Arlington Ridge Blvd | 0.23mi | 3/2.0 (-1) | 2,001 (+9%) | 4mo | $449,000 | $224 | 66 |
| 26535 Manassas Dr | 0.57mi | 3/2.0 (-1) | 1,862 (+1%) | 4mo | $480,000 | $258 | 64 |
| 26653 Otter Creek Ln | 0.36mi | 3/2.0 (-1) | 1,711 (-7%) | 10mo | $345,000 | $202 | 58 |
| 26633 Otter Creek Ln | 0.40mi | 3/2.0 (-1) | 2,001 (+9%) | 15mo | $410,000 | $205 | 49 |
| 4131 Arlington Ridge Blvd | 0.47mi | 3/2.0 (-1) | 1,776 (-4%) | 23mo | $429,900 | $242 | 48 |
| 4541 Shenandoah River Trl | 0.70mi | 3/2.0 (-1) | 2,034 (+10%) | 2mo | $396,000 | $195 | 44 |
| 4656 Shenandoah River Trl | 0.51mi | 3/2.0 (-1) | 2,048 (+11%) | 19mo | $430,000 | $210 | 36 |
| 4419 Clear Brook Ct | 0.69mi | 3/2.0 (-1) | 2,094 (+14%) | 14mo | $440,000 | $210 | 28 |
Match score weights: distance 35% · size 25% · config 20% · recency 20%. Top-matched comps best support the ARV.
Projected returns pro-forma
-3.0% appreciation · 1.67% rent growth · sell at horizon
- IRR
- -15.4%
- Equity multiple
- 0.46×
- Total profit
- $-57,220
- Equity at exit
- $56,206
- IRR
- -9.4%
- Equity multiple
- 0.46×
- Total profit
- $-57,449
- Equity at exit
- $32,593
Cash invested: $105,549 (down + closing). Projections, not guarantees.
Landlord ↔ Tenant lean methodology
- Overall (STATE)
- 87 Strongly Landlord-Friendly
- State Florida
- 87 Strongly Landlord-Friendly · R+3
- County
- — inherits STATE
- City
- — inherits STATE
ZIP-level market 34736
- Home prices YoY
- -22.5%
- Rents YoY
- 1.7%
- Active inventory
- 585
- Price-to-rent
- 8.7×
Monthly cashflow live
- Estimated rent
- $3,625 medium interval (Pro) →
- Mortgage (P&I)
- −$1,977
- Tax est. 1.5%
- −$471 /mo · $5,654/yr
- Insurance
- −$157
- Flood insurance flood zone
- −$125 /mo · $1,502/yr
- HOA
- −$0
- Vacancy / Maint / Mgmt
- −$761
- Net cashflow
- $134
Break-even live
UW: 25.0% down · 7.5% · 30yr · 1.5% tax · 5.0% vac · 8.0% maint · 8.0% mgmt
Financing live
Cash to close
- Down payment
- $94,240
- Closing costs
- $11,309
- Reserves months
- —
- Total cash needed
- —
Loan-product check · same deal, 3 products live
Conventional
25% down · 7.5% · 30yr
- Down + closing
- —
- Monthly P&I
- —
- Monthly cashflow
- —
- DSCR
- —
- Eligible?
- —
Personal DTI + credit; lowest rate.
DSCR
20% down · 8.5% · 30yr
- Down + closing
- —
- Monthly P&I
- —
- Monthly cashflow
- —
- DSCR
- —
- Eligible?
- —
No personal income docs; deal must DSCR.
Hard money
10% down · 12.0% · 12mo
- Down + closing
- —
- Monthly P&I
- —
- Monthly cashflow
- —
- DSCR
- —
- Eligible?
- —
Short-term bridge; refi at stabilization.
Rent comps 2 comps
| Address | Beds | Baths | Sqft | Rent | $/sqft | DOM | Units | Dist |
|---|---|---|---|---|---|---|---|---|
| 3690 Arlington Ridge Blvd Leesburg, FL | 3.0 | 2.0 | 1699 | $2,200 | $1.29 | 18d | 1 | 0.56mi |
| 26645 County Road 33 Groveland, FL | 3.0 | 2.0 | 2134 | $6,000 | $2.81 | 24d | 1 | 0.68mi |
Listing history 3 events
-
2026-06-18days on market $376,960 Active 2 DOM
-
2026-06-17remarks 83-char remark
-
2026-06-17$376,960 Active 1 DOM
ⓘ Source: listings_history table (triggers on properties + properties_extension) + one-shot
backfill from property_details.listing_events for pre-trigger history.
Climate risk First Street
- Flood 1/10 Low FEMA zone A · 0% chance over 30 yrs
- Wildfire 5/10 Major
- Heat 8/10 Severe 6 d/yr ≥108°F today · 19 d/yr by 30 yrs out
- Wind 9/10 Extreme 99% chance of damaging wind over 30 yrs
- Air quality 2/10 Low 1 unhealthy d/yr today · 2 by 30 yrs out
Nearby sold comps map
Loading sold comps map…
Walkable amenities ~0.75 mi
Loading nearby amenities…
Taxation est. · year 1
- Rental income
- $43,505
- − Mortgage interest
- −$21,116
- − Property taxes
- −$5,654
- − Insurance
- −$3,387
- − Repairs & maintenance
- −$3,480
- − Management
- −$3,480
- − Depreciation
- −$10,966
- Taxable loss
- −$4,579
- Est. tax savings @ 24.0%
- +$1,099
- After-tax cash flow
- $2,704/yr
For passive investors: Depreciation is non-cash, so a rental often shows a tax loss while cash-flowing — sheltering income. Rental losses are passive: they offset passive income freely, and up to $25,000/yr can offset ordinary (W-2) income if you actively participate and your MAGI is under $100k (phasing out to $0 by $150k); unused losses carry forward. On sale, claimed depreciation is recaptured at up to 25%, and gains may owe capital-gains tax (a 1031 exchange can defer both). Figures are a year-1 estimate at your 24.0% rate — not tax advice; consult a CPA.
Condition & rehab AI · 12 photos
This home is in good condition with a modern kitchen and bathrooms. It has potential for increasing its value with exterior painting and flooring upgrades.
Value-add opportunities
- Both Painting the exterior and landscaping — Enhances curb appeal and resale value.
- Resale Upgrading the flooring in the bathrooms — Improves the overall aesthetic and functionality of the bathrooms.
Renovation cost estimate screening
Value-add ROI direction
- Both Painting the exterior and landscaping — Enhances curb appeal and resale value. ↑
- Resale Upgrading the flooring in the bathrooms — Improves the overall aesthetic and functionality of the bathrooms. ↑
ⓘ Cost ranges are severity-bucket heuristics (US national rule-of-thumb). Get contractor quotes + a written scope before underwriting a rehab budget.
Schools (NCES district)
- District
- Lake
- NCES district ID
- 1201050
- Math proficiency
- 49% ▼ -7.00%
- Reading proficiency
- 50% ▼ -4.00%
- Median HH income
- $46,632
- Composite
- 42.05/100
- National rank
- #3327
- State rank
- #37 of 73 in FL
Livability — Leesburg
- Score
- 62/100
- State rank
- #751
- US rank
- #16429
Category grades
Schools grade is shown separately in the Schools card above.
Census & demographics
- Census place
- Leesburg, FL
- County
- Lake County · 364,602 people
- City population
- 70,232
- Metro
- Orlando-Kissimmee-Sanford, FL
- Population (ZIP)
- 28,001
- Household income
- $90,545
- Rent vs Own
- Severe rent burden
- 216.0
Population outlook (Lake County) Hauer SSP2
- Today (2025)
- 386,640 people
- By 2030
- 417,107 · +7.9%
- By 2040
- 476,676 · +23.3%
- By 2050
- 531,296 · +37.4%
- By 2075
- 648,303 · +67.7%
- By 2100
- 698,530 · +80.7%
Race, ethnicity, and origin ACS 2023
- Neighborhood character
- Diverse neighborhood (Simpson 0.65)
- Race & ethnicity
- White 52% Hispanic / Latino 25% Two or more races 17% Black 15% Asian 4%
- Hispanic origin (detail)
- Mexican 3% Puerto Rican 15% Cuban 2%
- Common ancestry
- Romanian 2% Hispanic 2% Lithuanian 1%
- Foreign-born
- 13% · Canada, Guatemala
- Languages at home
- 81% English-only · Spanish 14% French/Haitian/Cajun 2% Other Indo-European 1%
Political lean MEDSL · Lake
- 2024 margin
- Strong R (+24.7) · D 37.3% · R 62.0%
- 2008→2024 swing
- -11.2pp toward R · 2008: -13.5pp · 2024: -24.7pp
- All cycles
- 2024: R+24.7 2020: R+20.0 2016: R+23.1 2012: R+17.1 2008: R+13.5
Not yet ingested
- Civics
- —
Market trends
- HPI YoY
- ▼ -77.23%
- Current HPI
- 265.3457
- Rent YoY
- ▲ 1.67%
- Metro
- Orlando-Kissimmee-Sanford, FL
- State GDP YoY
- ▲ 3.28%
- F500 in state
- 36
Industry mix (Fortune 500 HQ in FL)
| Industry | F500 HQs | Revenue |
|---|---|---|
| Industrial Technology | 2 | $29B |
|
||
| Insurance | 2 | $17B |
|
||
| Retail | 1 | $60B |
|
||
| Technology Distribution | 1 | $58B |
|
||
| Homebuilding | 1 | $35B |
|
||
| Technology Manufacturing | 1 | $35B |
|
||
Cash-flow waterfall
monthlySold comps — $/sqft
last 12 mo · ≤1 miLoading sold comps…