 Fourplex
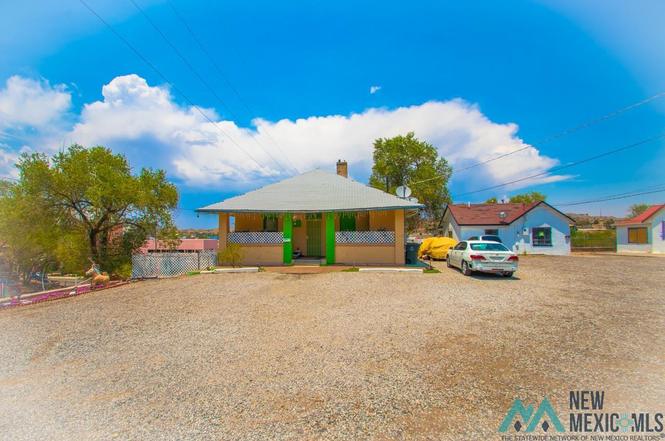
302 E Coal Ave · Gallup, NM
Flood risk 1/10 · Minimal
- FEMA flood zone
- X (unshaded)
- Chance of flooding over 30 yrs
- 0.0%
- Est. flood insurance / yr
- $507 – $1,088
Fire risk 3/10 · Minor
- Est. fire insurance / yr
- $706 – $1,312
Heat risk 3/10 · Minor
- Hot days now (above 90°F)
- 6 days/yr
- Hot days in 30 yrs
- 15 days/yr
Wind risk 1/10 · Minimal
- Chance of severe wind over 30 yrs
- —
Air-quality risk 1/10 · Minimal
- Unhealthy air days now
- 0 days/yr
- Unhealthy air days in 30 yrs
- 0 days/yr
Risk factors via First Street. Map © Google.
Why this score? — see what drove the B- grade
The composite is a weighted blend of 9 inputs, each scored 0–100. Each bar is that input's sub-score; the figure is the points it added to the 100-point composite (weight × sub-score).
- Cash flow +30.0/30.0
- 1% rule +10.0/10.0
- DSCR +10.0/10.0
- ARV discount +7.5/15.0
- Livability +3.6/5.0
- Rent growth +2.5/5.0
- Condition / age +2.5/5.0
- Schools +2.2/10.0
- Appreciation +0.0/10.0
$129,000
🖨 Deal sheet 📄 Offer letter ✓ Due diligence
Multi-family units
County records classify this as Multi-Family (2-4 Unit). Listing-text estimate: 4 units. confirmed
Listing remarks
Prime 4-Unit Multi-Family Investment Opportunity Discover an exceptional income-producing property in a desirable location, perfect for investors or owner-occupants seeking rental income. This 4-unit multi-family property, situated on a spacious 0.47-acre lot, offers a diverse mix of living spaces to attract a variety of tenants. With a total of 4,257 square feet of living space across four distinct units, this property is a rare find with strong rental potential. Property Details: • House #1: Spacious 3-bedroom, 1-bathroom home with 1,509 sq. ft. of living space. Ideal for families or professionals, this unit boasts generous room sizes and a comfortable layout, perfect for long-term t
Key facts
- 4 unit multi family
- Spacious lot
- Prime location
Tags
Property features AI
Exterior
- Parking: Guest parking
- Utilities: Public water; Natural gas available and connected; Electricity connected; Sewer connected; Cable connected
- Home design: Multi-family residential (2–4 units); One story
- Construction: Brick, stone and stucco construction; Metal roof; Shingle roof; Unfinished basement
- Exterior features: Covered patio; Deck; Fenced yard
Interior
- Kitchen: Free-standing range; Refrigerator
- Flooring: Carpet; Hardwood; Laminate; Tile; Vinyl
- Heating & cooling: Forced air heating; Wall furnace; Floor furnace; Fireplace heating; Ceiling fans; Electric cooling; Evaporative cooling
- Interior features: Ceiling fans; Masonry fireplace
Neighborhood map
What this means for you Summary
Snapshot
- This is a 4 × 2-bed/3.0-bath units multifamily listed at $129k.
Deal economics
- At list price, monthly cash flow is $2k ($27k/yr) — positive. Per door: $558/mo.
- The deal already cash-flows at list — no discount required.
- Meets the 1% rule at list price ($4k rent vs $129k).
- Recommended offer: $114k (12.0% below list) — sets the bar for market timing.
Location & tenants
- Location reads 71/100 on livability (#15 in NM) — a middle-class / working-renter tenant base. Strengths: cost of living A+, housing A+, health & safety A+; Watch: employment D+, schools F, crime F.
- Gallup-Mckinley Cty Schools (rural): math 17% / reading 30% proficiency, ranked #54 of 95 in NM (top 57%) — low school quality limits family demand, transient renter base, plan for 1-2y turnover; 84% free/reduced lunch — lower-income household profile, screen leases tightly.
- Market conditions: 96 active listings in the ZIP; 1 units permitted in McKinley County in 2024 (0 in 5+ unit buildings).
Forward outlook
- Local home prices are declining (-3.0%/yr); year-one equity from $892 of loan paydown is wiped out by about $4k of value loss. Plan a longer hold.
- McKinley County population projected at +36% by 2050 — long-run rental-demand tailwind backs the buy-and-hold thesis.
- At projected returns (-3.0% appreciation + 3.0% rent growth), your $36k cash investment doubles in ~2 years — after that, you're playing with house money.
Negotiation context
- It's been on market 337 days — a 12% lower offer ($114k) is reasonable based on typical stale-listing flexibility.
Risks & watch-outs
- Watch-outs: built in 1940 — expect roof / HVAC / electrical / plumbing capex.
Questions for the listing agent
- It's been on market 337 days. Have you received any prior offers? Is the seller open to a 12% concession, seller financing, or rate buy-down credit?
- Can we see the unit-by-unit rent roll, current vacancy, and any below-market leases? What's the average tenancy length?
- What capital expenditures (roof, boiler, parking lot, exteriors) have been made in the last 5 years, and what's planned in the next 2?
- Built in 1940 — when were the roof, HVAC, electrical panel, plumbing, and water heater last replaced?
- Why hasn't it sold? Are there any deal-killer items the seller is aware of (foundation, flood, title, zoning, code violations)?
- Is there a deadline driving the sale (1031 exchange, divorce, estate, relocation)? That informs how much negotiation room exists.
- Schools are F-rated, which usually means shorter tenancies and higher turnover. Who's the typical renter profile here, and what's been the actual vacancy rate?
- Crime grade is F in this area — have there been break-ins, vandalism, or insurance claims at this property in the last 3 years? What carrier currently insures it and at what premium?
- What's the average days-on-market for RENTAL listings here right now (not sales)? A rising rental-DOM trend means longer vacancies and softer asking-rent achievability than the comps imply.
- What's the recent tenant-quality profile in this submarket — average credit score on applications, eviction rate, late-payment / NSF rate, and stable-employment percentage? A property-management company in the area should have these aggregated.
- How much new apartment / multifamily construction is in the pipeline within 1–3 miles? Heavy new supply (>2% of stock underway) typically softens rents 12–24 months out; light construction supports rent growth.
Investment metrics
- 1% rule
- 3.07% ✓
- Cap rate
- 27.06%
- Cash-on-cash
- 74.16%
- DSCR
- 4.30
- GRM
- 2.7
CMA / ARV
No comps found within radius.
Projected returns pro-forma
-3.0% appreciation · 3.0% rent growth · sell at horizon
- IRR
- 74.0%
- Equity multiple
- 4.36×
- Total profit
- $121,324
- Equity at exit
- $19,234
- IRR
- 77.8%
- Equity multiple
- 9.00×
- Total profit
- $288,954
- Equity at exit
- $11,154
Cash invested: $36,120 (down + closing). Projections, not guarantees.
Landlord ↔ Tenant lean methodology
- Overall (STATE)
- 55 Moderately Landlord-Leaning
- State New Mexico
- 55 Moderately Landlord-Leaning · D+3
- County
- — inherits STATE
- City
- — inherits STATE
ZIP-level market 87301
- Active inventory
- 96
- Price-to-rent
- 10.9×
Monthly cashflow live
- Estimated rent
- $3,954 medium interval (Pro) →
- Mortgage (P&I)
- −$676
- Tax est. 1.5%
- −$161 /mo · $1,935/yr
- Insurance
- −$54
- HOA
- −$0
- Vacancy / Maint / Mgmt
- −$830
- Net cashflow
- $2,232
Break-even live
4-unit breakdown (identical units grouped — click to expand)
| Units | Beds | Baths | Est. rent |
|---|---|---|---|
| 4× units | 2 | 3 | $3,952 |
| #1 | 2 | 3 | $988 |
| #2 | 2 | 3 | $988 |
| #3 | 2 | 3 | $988 |
| #4 | 2 | 3 | $988 |
| Total (4 units) | $3,954 | ||
UW: 25.0% down · 7.5% · 30yr · 1.5% tax · 5.0% vac · 8.0% maint · 8.0% mgmt
Financing live
Cash to close
- Down payment
- $32,250
- Closing costs
- $3,870
- Reserves months
- —
- Total cash needed
- —
Loan-product check · same deal, 3 products live
Conventional
25% down · 7.5% · 30yr
- Down + closing
- —
- Monthly P&I
- —
- Monthly cashflow
- —
- DSCR
- —
- Eligible?
- —
Personal DTI + credit; lowest rate.
DSCR
20% down · 8.5% · 30yr
- Down + closing
- —
- Monthly P&I
- —
- Monthly cashflow
- —
- DSCR
- —
- Eligible?
- —
No personal income docs; deal must DSCR.
Hard money
10% down · 12.0% · 12mo
- Down + closing
- —
- Monthly P&I
- —
- Monthly cashflow
- —
- DSCR
- —
- Eligible?
- —
Short-term bridge; refi at stabilization.
Listing history 18 events
-
2026-06-18days on market $129,000 Active 337 DOM
-
2026-06-17days on market $129,000 Active 336 DOM
-
2026-06-16days on market $129,000 Active 335 DOM
-
2026-06-15days on market $129,000 Active 334 DOM
-
2026-06-13days on market $129,000 Active 332 DOM
-
2026-06-12days on market $129,000 Active 331 DOM
-
2026-06-09days on market $129,000 Active 328 DOM
-
2026-06-08days on market $129,000 Active 327 DOM
-
2026-06-07days on market $129,000 Active 326 DOM
-
2026-06-07days on market $129,000 Active 325 DOM
-
2026-06-04days on market $129,000 Active 322 DOM
-
2026-06-02days on market $129,000 Active 321 DOM
-
2026-06-01days on market $129,000 Active 320 DOM
-
2026-05-31days on market $129,000 Active 319 DOM
-
2026-05-13price $129,000
-
2025-12-31price $139,000
-
2025-08-08price $145,000
-
2025-07-16$165,000 Active
ⓘ Source: listings_history table (triggers on properties + properties_extension) + one-shot
backfill from property_details.listing_events for pre-trigger history.
Climate risk First Street
- Flood 1/10 Low FEMA zone X (unshaded) · 0% chance over 30 yrs
- Wildfire 3/10 Moderate
- Heat 3/10 Moderate 6 d/yr ≥90°F today · 15 d/yr by 30 yrs out
- Wind 1/10 Low
- Air quality 1/10 Low 0 unhealthy d/yr today · 0 by 30 yrs out
Nearby sold comps map
Loading sold comps map…
Walkable amenities ~0.75 mi
Loading nearby amenities…
Taxation est. · year 1
- Rental income
- $47,448
- − Mortgage interest
- −$7,226
- − Property taxes
- −$1,935
- − Insurance
- −$645
- − Repairs & maintenance
- −$3,796
- − Management
- −$3,796
- − Depreciation
- −$3,753
- Taxable income
- $26,298
- Est. tax owed @ 24.0%
- −$6,311
- After-tax cash flow
- $20,475/yr
For passive investors: Depreciation is non-cash, so a rental often shows a tax loss while cash-flowing — sheltering income. Rental losses are passive: they offset passive income freely, and up to $25,000/yr can offset ordinary (W-2) income if you actively participate and your MAGI is under $100k (phasing out to $0 by $150k); unused losses carry forward. On sale, claimed depreciation is recaptured at up to 25%, and gains may owe capital-gains tax (a 1031 exchange can defer both). Figures are a year-1 estimate at your 24.0% rate — not tax advice; consult a CPA.
Schools (NCES district)
- District
- Gallup-Mckinley Cty Schools
- NCES district ID
- 3501110
- Math proficiency
- 17% —
- Reading proficiency
- 30% —
- Median HH income
- $30,298
- Composite
- 22.01/100
- National rank
- #13541
- State rank
- #54 of 95 in NM
Livability — Gallup
- Score
- 71/100
- State rank
- #15
- US rank
- #6953
Category grades
Schools grade is shown separately in the Schools card above.
Census & demographics
- Census place
- Gallup, NM
- City population
- 21,981
- Population (ZIP)
- 21,981
Population outlook (McKinley County) Hauer SSP2
- Today (2025)
- 88,386 people
- By 2030
- 94,451 · +6.9%
- By 2040
- 107,369 · +21.5%
- By 2050
- 119,937 · +35.7%
- By 2075
- 148,818 · +68.4%
- By 2100
- 160,771 · +81.9%
Race, ethnicity, and origin ACS 2023
- Neighborhood character
- Highly diverse neighborhood (Simpson 0.91)
- Race & ethnicity
- Native American 51% Hispanic / Latino 24% White 17% Two or more races 10% Asian 3% Black 1%
- Hispanic origin (detail)
- Mexican 19%
- Common ancestry
- Lithuanian 1% Italian 1% Iranian 1%
- Foreign-born
- 6% · Canada
- Languages at home
- 66% English-only · Spanish 11% Other Indo-European 2% Tagalog/Filipino 2%
Political lean MEDSL · McKinley
- 2024 margin
- Strong D (+24.5) · D 60.7% · R 36.2% · Other 3.1%
- 2008→2024 swing
- -19.4pp toward R · 2008: 43.9pp · 2024: 24.5pp
- All cycles
- 2024: D+24.5 2020: D+38.6 2016: D+39.8 2012: D+46.6 2008: D+43.9
Not yet ingested
- Civics
- —
Market trends
- HPI YoY
- ▼ -77.73%
- Current HPI
- 143.4008
- Rent YoY
- —
- Metro
- —
- State GDP YoY
- —
- F500 in state
- 0
Price history
-21.8% since first listed4 events — show timeline
- 2026-05-13 Price Changed $129,000 NMMLS
- 2025-12-31 Price Changed $139,000 NMMLS
- 2025-08-08 Price Changed $145,000 NMMLS
- 2025-07-16 Listed $165,000 NMMLS
Cash-flow waterfall
monthlySold comps — $/sqft
last 12 mo · ≤1 miLoading sold comps…