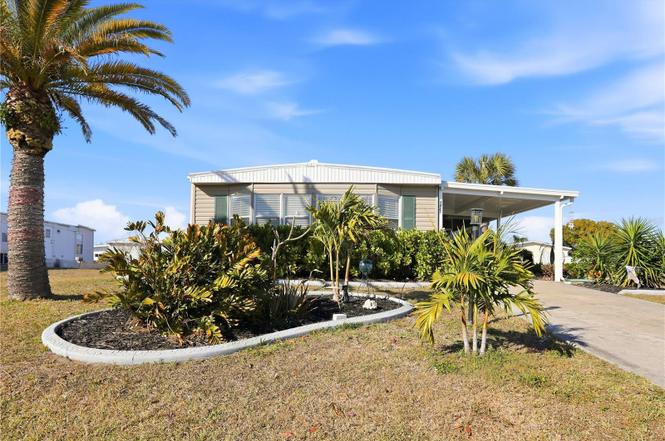
1427 Sanderling Dr · Englewood, FL
Flood risk 7/10 · Major
- FEMA flood zone
- X (shaded)
- Chance of flooding over 30 yrs
- 0.74%
- Est. flood insurance / yr
- $507 – $1,088
Fire risk 5/10 · Moderate
- Est. fire insurance / yr
- $947 – $1,759
Heat risk 10/10 · Severe
- Hot days now (above 107°F)
- 7 days/yr
- Hot days in 30 yrs
- 30 days/yr
Wind risk 10/10 · Severe
- Chance of severe wind over 30 yrs
- 99.0%
Air-quality risk 2/10 · Minimal
- Unhealthy air days now
- 1 days/yr
- Unhealthy air days in 30 yrs
- 1 days/yr
Risk factors via First Street. Map © Google.
Why this score? — see what drove the D- grade
The composite is a weighted blend of 9 inputs, each scored 0–100. Each bar is that input's sub-score; the figure is the points it added to the 100-point composite (weight × sub-score).
- Cash flow +15.5/30.0
- DSCR +4.8/10.0
- Schools +4.6/10.0
- 1% rule +3.9/10.0
- Livability +3.7/5.0
- Rent growth +2.5/5.0
- Condition / age +2.5/5.0
- ARV discount +0.0/15.0
- Appreciation +0.0/10.0
$204,900
🖨 Deal sheet (PDF) 📄 Offer letter ✓ Due diligence
Listing remarks
A Double Wide Manufactured Mobile Home in the 55+ Holiday Mobile Home Estates that offers so much, yet likely the LOWEST HOA & FEE IN THE STATE OF FLORIDA & YOU OWN YOUR OWN LAND! Sounds good? Let's list the really great things now. This one is brightly updated and refreshed to meet anyone's tastes. The Florida Style is apparent in each room so you always know you are in Paradise. A Turn-Key home (Yes. .. just bring your clothes & toothbrush) and you are set. Pulling into your driveway, you are greeted by a very nice carport and lush landscaping accenting a massive living room window for all of the Florida sunshine. A sizeable living room area for your family & guest
Key facts
- Own your own land
- Carport
- Lush landscaping
Tags
Property features AI
Finance
- Other: Furnished; Association contact name provided
- Financial info: Total annual fees noted; Lease restrictions apply
- HOA & community: Has HOA (optional fees; association approval required); Annual association fee: $35 (management included); Monthly HOA amount noted; Community amenities include clubhouse, pool, fitness center, tennis courts, pickleball and shuffleboard courts, recreation facilities; Deed restrictions; Buyer approval required; Senior community; Pets allowed; Golf carts permitted
Exterior
- Parking: Covered driveway; Carport (1 space)
- Security: Smoke detectors
- Utilities: Public water; Public sewer; Electricity connected; Water connected; Sewer connected; Cable available
- Home design: Manufactured double-wide home; Single-story (one level); South-facing
- Construction: Vinyl siding; Membrane roof; Slab foundation; Built as a double wide
- Exterior features: Covered front porch; Screened porch; Covered patio/porch elements; Sliding doors; Shed(s); Landscaped, level and paved lot
Interior
- Kitchen: Built-in oven; Cooktop; Dishwasher; Microwave; Range hood; Refrigerator; Eat-in kitchen
- Bedrooms: 2 bedrooms
- Flooring: Laminate; Linoleum; Vinyl
- Bathrooms: 2 full bathrooms
- Heating & cooling: Electric heat; Heat pump; Central air
- Interior features: Ceiling fans; Eat-in kitchen; Open floor plan; Thermostat; Walk-in closet(s); Wet bar; Window treatments; Double-pane and insulated windows; Storm windows; Curtain rods
- Laundry & utility: Washer and dryer included; Electric water heater; Laundry located inside; Inside utility / family room area
Neighborhood map
What this means for you Summary
Snapshot
- This is a 2-bed/2.0-bath manufactured listed at $205k.
Deal economics
- At list price, monthly cash flow is $16 ($188/yr) — positive.
- The deal already cash-flows at list — no discount required.
- To meet the 1% rule (rent ≥ 1% of price), the offer needs to be $182k (11.2% below list).
- Recommended offer: $180k (12.0% below list) — sets the bar for market timing.
- Cap rate 6.8% vs local median 3.8% in Englewood — top-decile yield for the area; either an underpriced asset or a hidden risk that comps aren't pricing in. Stress-test before assuming the spread holds.
Location & tenants
- Location reads 73/100 on livability (#321 in FL) — a middle-class / working-renter tenant base. Strengths: housing A+, cost of living A, health & safety A; Watch: employment C-, amenities F, commute F.
- Charlotte (suburban): math 54% / reading 54% proficiency, ranked #22 of 73 in FL (top 30%) — acceptable for families but not a draw, mixed tenant base, ~2y average lease.
- Zoned schools: Myakka River Elementary School (math 65% / reading 60%, grade B, #601 of 2,144 statewide, top 28%, 608 students, 51% FRL); L. A. Ainger Middle School (math 65% / reading 53%, grade B, #144 of 571 statewide, top 26%, 720 students, 40% FRL); Lemon Bay High School (math 50% / reading 56%, grade C-, #148 of 667 statewide, top 23%, 1,360 students, 28% FRL).
- Market conditions: Rents soft (-0.1%/yr); 737 active listings in the ZIP; 15 comparable units currently listed for rent nearby; rentals at typical pace (median 23d on market — plan ~3-4 weeks tenant-placement turnaround); 4,585 units permitted in Charlotte County in 2024 (703 in 5+ unit buildings).
- This rent runs 38% of the median local income ($57k/yr) — at the standard rent-burdened threshold; future hikes will face affordability resistance.
Forward outlook
- Local home prices are declining (-3.0%/yr); year-one equity from $1k of loan paydown is wiped out by about $6k of value loss. Plan a longer hold.
- Charlotte County population projected at +24% by 2050 — long-run rental-demand tailwind backs the buy-and-hold thesis.
Negotiation context
- It's been on market 130 days — a 12% lower offer ($180k) is reasonable based on typical stale-listing flexibility.
Risks & watch-outs
- Watch-outs: flood insurance adds $66/mo.
- Climate carrying-cost: major flood risk; severe wind risk, 99% chance of damaging wind over 30y; moderate wildfire risk; extreme-heat days projected 7→30/yr by 2055 (HVAC capex compounding) — expect insurance premiums to compound above CPI over the hold.
Questions for the listing agent
- It's been on market 130 days. Have you received any prior offers? Is the seller open to a 12% concession, seller financing, or rate buy-down credit?
- Built in 1979 — when were the roof, HVAC, electrical panel, plumbing, and water heater last replaced?
- What's the actual annual flood-insurance premium (NFIP or private), and is the property in a SFHA with mandatory coverage?
- What does the HOA fee cover, when was the last increase, and are there any pending special assessments or reserve-fund shortfalls?
- Why hasn't it sold? Are there any deal-killer items the seller is aware of (foundation, flood, title, zoning, code violations)?
- Is there a deadline driving the sale (1031 exchange, divorce, estate, relocation)? That informs how much negotiation room exists.
- Schools are A-rated — typically a magnet for longer-tenancy family renters. What's the average tenant stay here, and is there a school-zone premium baked into asking?
- The area grade is low — what's the realistic commute time and amenity access for the typical tenant pool here? Any planned neighborhood developments (good or bad) we should know about?
- What's the average days-on-market for RENTAL listings here right now (not sales)? A rising rental-DOM trend means longer vacancies and softer asking-rent achievability than the comps imply.
- What's the recent tenant-quality profile in this submarket — average credit score on applications, eviction rate, late-payment / NSF rate, and stable-employment percentage? A property-management company in the area should have these aggregated.
- How much new for-sale + rental construction is in the pipeline within 1–3 miles? Heavy new supply typically softens prices + rents 12–24 months out; constrained supply supports both.
Investment metrics
- 1% rule
- 0.89% ✗
- Cap rate
- 6.77%
- Cash-on-cash
- 1.72%
- DSCR
- 1.08
- GRM
- 9.4
CMA / ARV
- ARV (on-the-fly)
- $161,280
- Comps found
- 4
Show comp detail 4 sales within ~0.75 mi
| Address | Dist | Beds/Ba | Sqft | Sold | Price | $/sf | Match |
|---|---|---|---|---|---|---|---|
| 6287 Oriole Blvd | 0.37mi | 2/2.0 | 1,344 (0%) | 12mo | $130,000 | $97 | 73 |
| 1297 Kingfisher Dr | 0.30mi | 2/2.0 | 1,176 (-12%) | 3mo | $105,000 | $89 | 63 |
| 1513 Blue Heron Dr | 0.18mi | 2/2.0 | 1,152 (-14%) | 11mo | $165,000 | $143 | 59 |
| 8443 Albatross Ln | 0.48mi | 2/1.5 | 1,160 (-14%) | 13mo | $139,000 | $120 | 42 |
Match score weights: distance 35% · size 25% · config 20% · recency 20%. Top-matched comps best support the ARV.
Projected returns pro-forma
-3.0% appreciation · 0.0% rent growth · sell at horizon
- IRR
- -19.2%
- Equity multiple
- 0.35×
- Total profit
- $-37,507
- Equity at exit
- $30,551
- IRR
- -19.8%
- Equity multiple
- 0.10×
- Total profit
- $-51,863
- Equity at exit
- $17,716
Cash invested: $57,372 (down + closing). Projections, not guarantees.
Landlord ↔ Tenant lean methodology
- Overall (STATE)
- 87 Strongly Landlord-Friendly
- State Florida
- 87 Strongly Landlord-Friendly · R+3
- County
- — inherits STATE
- City
- — inherits STATE
ZIP-level market 34224
- Home prices YoY
- -18.9%
- Rents YoY
- -0.1%
- Active inventory
- 737
- Price-to-rent
- 9.4×
Monthly cashflow live
- Estimated rent
- $1,820 high interval (Pro) →
- Mortgage (P&I)
- −$1,075
- Tax from tax record
- −$167 /mo · $2,003/yr
- Insurance
- −$85
- Flood insurance flood zone
- −$66 /mo · $798/yr
- HOA
- −$29
- Vacancy / Maint / Mgmt
- −$382
- Net cashflow
- $16
Break-even live
Sensitivity live
| Price | -10% $132 | -5% $74 | +0% $16 | +5% $-42 | +10% $-100 |
|---|---|---|---|---|---|
| Rent | -10% $-128 | -5% $-56 | +0% $16 | +5% $88 | +10% $159 |
| Rate | -1.0pp $119 | -0.5pp $68 | base $16 | +0.5pp $-37 | +1.0pp $-91 |
UW: 25.0% down · 7.5% · 30yr · 1.5% tax · 5.0% vac · 8.0% maint · 8.0% mgmt
Financing live
Cash to close
- Down payment
- $51,225
- Closing costs
- $6,147
- Reserves months
- —
- Total cash needed
- —
Loan-product check · same deal, 3 products live
Conventional
25% down · 7.5% · 30yr
- Down + closing
- —
- Monthly P&I
- —
- Monthly cashflow
- —
- DSCR
- —
- Eligible?
- —
Personal DTI + credit; lowest rate.
DSCR
20% down · 8.5% · 30yr
- Down + closing
- —
- Monthly P&I
- —
- Monthly cashflow
- —
- DSCR
- —
- Eligible?
- —
No personal income docs; deal must DSCR.
Hard money
10% down · 12.0% · 12mo
- Down + closing
- —
- Monthly P&I
- —
- Monthly cashflow
- —
- DSCR
- —
- Eligible?
- —
Short-term bridge; refi at stabilization.
Rent comps 15 comps
| Address | Beds | Baths | Sqft | Rent | $/sqft | DOM | Units | Dist |
|---|---|---|---|---|---|---|---|---|
| 2275 S McCall Rd #201 Englewood, FL | 2.0 | 2.0 | 1050 | $2,000 | $1.90 | 15d | 1 | 0.56mi |
| 2643 Lear Rd Englewood, FL | 2.0 | 2.0 | 1206 | $5,800 | $4.81 | 22d | 1 | 0.69mi |
| 1120 Lampp Dr Englewood, FL | 3.0 | 2.0 | 1212 | $4,000 | $3.30 | 22d | 1 | 0.86mi |
| 1081 Humboldt St Englewood, FL | 3.0 | 2.0 | 1838 | $2,400 | $1.31 | 22d | 1 | 0.91mi |
| 6699 San Casa Dr Englewood, FL | 2.0 | 2.0 | 1028 | $1,900 | $1.85 | 22d | 1 | 0.93mi |
| 6688 San Casa Dr Englewood, FL | 2.0 | 2.0 | 1143 | $1,600 | $1.40 | 22d | 1 | 0.97mi |
| 858 E 7th St Englewood, FL | 3.0 | 2.0 | 1244 | $1,995 | $1.60 | 22d | 1 | 1.09mi |
| 9264 Anita Ave Unit A Englewood, FL | 2.0 | 2.0 | 1008 | $1,400 | $1.39 | 22d | 1 | 1.11mi |
| 9312 Anita Ave Unit B Englewood, FL | 2.0 | 1.0 | 972 | $1,600 | $1.65 | 22d | 1 | 1.19mi |
| 9322 Anita Ave Englewood, FL | 2.0 | 2.0 | 1133 | $1,495 | $1.32 | 22d | 1 | 1.21mi |
| 9271 Tacoma Ave Unit B Englewood, FL | 2.0 | 2.0 | 1206 | $1,650 | $1.37 | 22d | 1 | 1.25mi |
| 1531 Placida Rd #203 Englewood, FL | 2.0 | 2.0 | 1056 | $3,900 | $3.69 | 22d | 1 | 1.27mi |
| 1531 Placida Rd #204 Englewood, FL | 2.0 | 2.0 | 1056 | $3,500 | $3.31 | 22d | 1 | 1.28mi |
| 8363 Sago Ct Englewood, FL | 2.0 | 2.0 | 1360 | $1,950 | $1.43 | 22d | 1 | 1.34mi |
| 9416 Anita Ave Englewood, FL | 3.0 | 2.0 | 1162 | $1,750 | $1.51 | 15d | 1 | 1.38mi |
HOA detail
- Monthly dues
- $29 · $348/yr
- Likely covers
- landscaping
Listing history 23 events
-
2026-06-22days on market $204,900 Active 130 DOM
-
2026-06-18days on market $204,900 Active 127 DOM
-
2026-06-17days on market $204,900 Active 126 DOM
-
2026-06-16days on market $204,900 Active 125 DOM
-
2026-06-15days on market $204,900 Active 124 DOM
-
2026-06-14days on market $204,900 Active 122 DOM
-
2026-06-13days on market $204,900 Active 121 DOM
-
2026-06-10days on market $204,900 Active 119 DOM
-
2026-06-09days on market $204,900 Active 118 DOM
-
2026-06-08days on market $204,900 Active 117 DOM
-
2026-06-07days on market $204,900 Active 116 DOM
-
2026-06-05days on market $204,900 Active 113 DOM
-
2026-06-03days on market $204,900 Active 112 DOM
-
2026-06-02days on market $204,900 Active 111 DOM
-
2026-06-01days on market $204,900 Active 110 DOM
-
2026-05-31days on market $204,900 Active 109 DOM
-
2026-05-30days on market $204,900 Active 108 DOM
-
2026-04-09price $204,900
-
2026-03-18price $214,900
-
2026-02-11$229,000 Active
-
2022-07-26soldstatus $220,000
-
2022-04-29soldstatus $147,500
-
1979-07-01soldstatus $9,000
ⓘ Source: listings_history table (triggers on properties + properties_extension) + one-shot
backfill from property_details.listing_events for pre-trigger history.
Tax reassessment forecast FL · Resets to sale price
- Current annual tax
- $2,003 · $167/mo
- Projected year-2 tax
- $2,003 · $167/mo
- Expected delta
- $0/yr ($0/mo · 0.0%)
ⓘ Screening estimate from a state-policy table — verify with the county assessor before closing.
Climate risk First Street
- Flood 7/10 Severe FEMA zone X (shaded) · 74% chance over 30 yrs
- Wildfire 5/10 Major
- Heat 10/10 Extreme 7 d/yr ≥107°F today · 30 d/yr by 30 yrs out
- Wind 10/10 Extreme 99% chance of damaging wind over 30 yrs
- Air quality 2/10 Low 1 unhealthy d/yr today · 1 by 30 yrs out
Nearby sold comps map
Loading sold comps map…
Walkable amenities ~0.75 mi
Loading nearby amenities…
Taxation est. · year 1
- Rental income
- $21,843
- − Mortgage interest
- −$11,478
- − Property taxes
- −$2,003
- − Insurance
- −$1,822
- − Repairs & maintenance
- −$1,747
- − Management
- −$1,747
- − HOA
- −$348
- − Depreciation
- −$5,961
- Taxable loss
- −$3,264
- Est. tax savings @ 24.0%
- +$783
- After-tax cash flow
- $971/yr
For passive investors: Depreciation is non-cash, so a rental often shows a tax loss while cash-flowing — sheltering income. Rental losses are passive: they offset passive income freely, and up to $25,000/yr can offset ordinary (W-2) income if you actively participate and your MAGI is under $100k (phasing out to $0 by $150k); unused losses carry forward. On sale, claimed depreciation is recaptured at up to 25%, and gains may owe capital-gains tax (a 1031 exchange can defer both). Figures are a year-1 estimate at your 24.0% rate — not tax advice; consult a CPA.
Schools (NCES district)
- District
- Charlotte
- NCES district ID
- 1200240
- Math proficiency
- 54% ▼ -6.00%
- Reading proficiency
- 54% ▼ -1.00%
- Median HH income
- $44,864
- Composite
- 45.62/100
- National rank
- #2586
- State rank
- #22 of 73 in FL
Livability — Englewood
- Score
- 73/100
- State rank
- #321
- US rank
- #5655
Category grades
Schools grade is shown separately in the Schools card above.
Census & demographics
- Census place
- Englewood, FL
- County
- Charlotte County · 196,994 people
- City population
- 35,420
- Metro
- Punta Gorda, FL
- Population (ZIP)
- 15,536
- Household income
- $57,281
- Rent vs Own
- Severe rent burden
- 329.0
Population outlook (Charlotte County) Hauer SSP2
- Today (2025)
- 198,646 people
- By 2030
- 210,507 · +6.0%
- By 2040
- 230,857 · +16.2%
- By 2050
- 247,148 · +24.4%
- By 2075
- 281,777 · +41.8%
- By 2100
- 293,609 · +47.8%
Race, ethnicity, and origin ACS 2023
- Neighborhood character
- Predominantly White (92%)
- Race & ethnicity
- White 92% Two or more races 5% Hispanic / Latino 3% Asian 1%
- Common ancestry
- Romanian 4% Slovak 4% Lithuanian 4%
- Foreign-born
- 9% · Canada
- Languages at home
- 92% English-only · Other Indo-European 2% Spanish 2% German/W. Germanic 1%
Political lean MEDSL · Charlotte
- 2024 margin
- Solid R (+34.0) · D 32.7% · R 66.7%
- 2008→2024 swing
- -26.7pp toward R · 2008: -7.2pp · 2024: -34.0pp
- All cycles
- 2024: R+34.0 2020: R+26.6 2016: R+27.8 2012: R+14.3 2008: R+7.2
Not yet ingested
- Civics
- —
Market trends
- HPI YoY
- ▼ -75.76%
- Current HPI
- 325.0345
- Rent YoY
- ▼ -0.11%
- Metro
- Punta Gorda, FL
- State GDP YoY
- ▲ 3.28%
- F500 in state
- 36
Industry mix (Fortune 500 HQ in FL)
| Industry | F500 HQs | Revenue |
|---|---|---|
| Industrial Technology | 2 | $29B |
|
||
| Insurance | 2 | $17B |
|
||
| Retail | 1 | $60B |
|
||
| Technology Distribution | 1 | $58B |
|
||
| Homebuilding | 1 | $35B |
|
||
| Technology Manufacturing | 1 | $35B |
|
||
Price history
+2176.7% since first listed6 events — show timeline
- 2026-04-09 Price Changed $204,900 Stellar MLS as Distributed by MLS Grid
- 2026-03-18 Price Changed $214,900 Stellar MLS as Distributed by MLS Grid
- 2026-02-11 Listed $229,000 Stellar MLS as Distributed by MLS Grid
- 2022-07-26 Sold (Public Records) $220,000 Public Records
- 2022-04-29 Sold (Public Records) $147,500 Public Records
- 1979-07-01 Sold (Public Records) $9,000 Public Records
Property tax history
+5.5%/yrLatest (2025): $2,003 · -5.1% YoY. Source: county tax records.
Cash-flow waterfall
monthlySold comps — $/sqft
last 12 mo · ≤1 miLoading sold comps…