 🌊 Lakefront
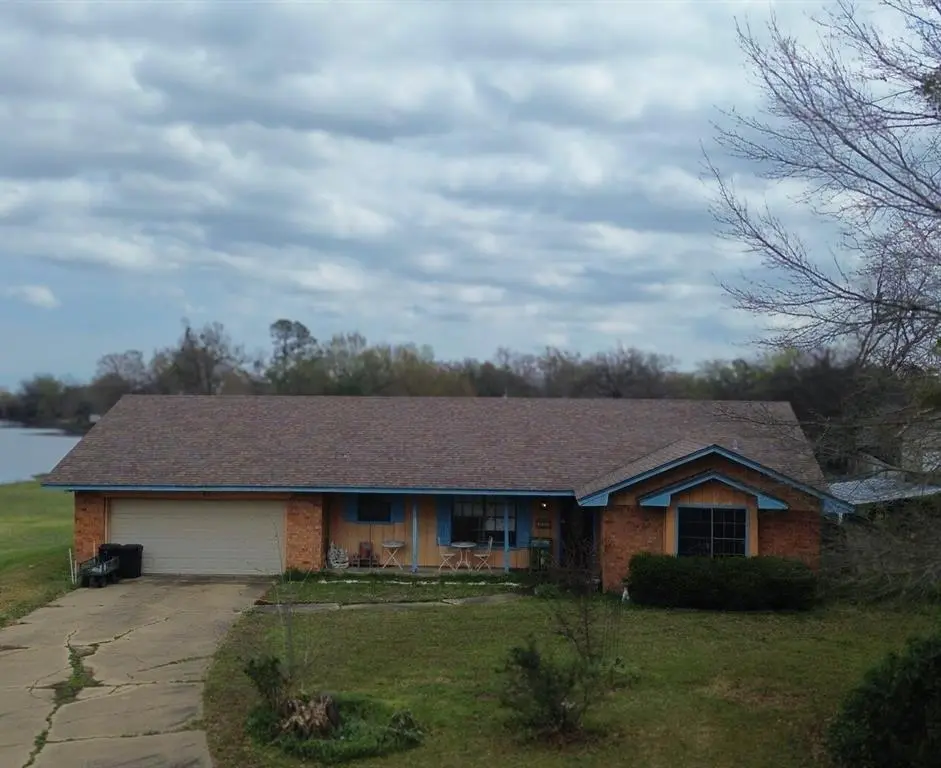
200 Myndi St · Sulphur Springs, TX
Flood risk 1/10 · Minimal
- FEMA flood zone
- X (unshaded)
- Chance of flooding over 30 yrs
- 0.0%
- Est. flood insurance / yr
- $507 – $1,088
Fire risk 4/10 · Minor
- Est. fire insurance / yr
- $1,222 – $2,270
Heat risk 7/10 · Major
- Hot days now (above 109°F)
- 7 days/yr
- Hot days in 30 yrs
- 24 days/yr
Wind risk 6/10 · Moderate
- Chance of severe wind over 30 yrs
- 27.0%
Air-quality risk 2/10 · Minimal
- Unhealthy air days now
- 0 days/yr
- Unhealthy air days in 30 yrs
- 1 days/yr
Risk factors via First Street. Map © Google.
Why this score? — see what drove the C grade
The composite is a weighted blend of 9 inputs, each scored 0–100. Each bar is that input's sub-score; the figure is the points it added to the 100-point composite (weight × sub-score).
- Cash flow +19.5/30.0
- ARV discount +15.0/15.0
- DSCR +6.2/10.0
- 1% rule +5.8/10.0
- Schools +3.6/10.0
- Livability +3.5/5.0
- Rent growth +2.5/5.0
- Condition / age +2.5/5.0
- Appreciation +0.0/10.0
$160,000
🖨 Deal sheet (PDF) 📄 Offer letter ✓ Due diligence
Listing remarks MLS
Investor special located at 200 Myndi Circle in Sulphur Springs! This property offers great potential for investors or buyers looking for their next project. Featuring a den that provides additional living space or flexibility for a home office, game room, or second living area. Conveniently located near Helm Lake #2, offering a peaceful setting while still being close to town amenities. Property is being sold AS-IS. Bring your vision and transform this property into something special.
Key facts
- 0.37 acre lot
- 2 garage spots
- Built 1978
Neighborhood map
What this means for you Summary
Snapshot
- This is a 3-bed/2.0-bath single-family listed at $160k.
Deal economics
- At list price, monthly cash flow is $182 ($2k/yr) — positive.
- The deal already cash-flows at list — no discount required.
- Meets the 1% rule at list price ($2k rent vs $160k).
- Recommended offer: $146k (9.0% below list) — sets the bar for market timing.
- Cap rate 7.7% vs local median 4.3% in Sulphur Springs — top-decile yield for the area; either an underpriced asset or a hidden risk that comps aren't pricing in. Stress-test before assuming the spread holds.
Location & tenants
- Location reads 70/100 on livability (#350 in TX) — a middle-class / working-renter tenant base. Strengths: cost of living A+, housing A+, crime A; Watch: employment D+, schools D, amenities F.
- Sulphur Springs ISD (town): math 46% / reading 40% proficiency, ranked #323 of 826 in TX (top 39%) — families likely to look elsewhere, expect single-tenant / working-renter base with shorter leases.
- Market conditions: 378 active listings in the ZIP; 1 comparable units currently listed for rent nearby; 66 units permitted in Hopkins County in 2024 (0 in 5+ unit buildings).
Forward outlook
- Local home prices are declining (-3.0%/yr); year-one equity from $1k of loan paydown is wiped out by about $5k of value loss. Plan a longer hold.
- Hopkins County population projected at +6% by 2050 — modest demand growth; plan on rents tracking national, not racing it.
Negotiation context
- It's been on market 97 days — a 9% lower offer ($146k) is reasonable based on typical stale-listing flexibility.
Risks & watch-outs
- Climate carrying-cost: major wind risk, 27% chance of damaging wind over 30y; extreme-heat days projected 7→24/yr by 2055 (HVAC capex compounding) — expect insurance premiums to compound above CPI over the hold.
Questions for the listing agent
- It's been on market 97 days. Have you received any prior offers? Is the seller open to a 9% concession, seller financing, or rate buy-down credit?
- Built in 1978 — when were the roof, HVAC, electrical panel, plumbing, and water heater last replaced?
- Why hasn't it sold? Are there any deal-killer items the seller is aware of (foundation, flood, title, zoning, code violations)?
- Is there a deadline driving the sale (1031 exchange, divorce, estate, relocation)? That informs how much negotiation room exists.
- Schools are D-rated, which usually means shorter tenancies and higher turnover. Who's the typical renter profile here, and what's been the actual vacancy rate?
- This sits on a lake — are riparian / water-frontage rights deeded with the parcel? Any dock permits, shoreline easements, or HOA water-use restrictions?
- What's the documented flood / surge / shoreline-erosion history here (FEMA AND non-FEMA — e.g., storm surge, creek backup, septic-field saturation)?
- Any water-quality or seasonal algae-bloom issues that affect tenant satisfaction or short-term-rental demand?
- What's the average days-on-market for RENTAL listings here right now (not sales)? A rising rental-DOM trend means longer vacancies and softer asking-rent achievability than the comps imply.
- What's the recent tenant-quality profile in this submarket — average credit score on applications, eviction rate, late-payment / NSF rate, and stable-employment percentage? A property-management company in the area should have these aggregated.
- How much new for-sale + rental construction is in the pipeline within 1–3 miles? Heavy new supply typically softens prices + rents 12–24 months out; constrained supply supports both.
Investment metrics
- 1% rule
- 1.08% ✓
- Cap rate
- 7.66%
- Cash-on-cash
- 4.89%
- DSCR
- 1.22
- GRM
- 7.7
CMA / ARV
- ARV (median comp)
- $269,232
- List price
- $160,000
- Delta
- -40.57%
- Verdict
- UNDERPRICED
- Comps
- 20 within 1.0 mi
Show comp detail 8 sales within ~0.75 mi
| Address | Dist | Beds/Ba | Sqft | Sold | Price | $/sf | Match |
|---|---|---|---|---|---|---|---|
| 121 Lewis St | 0.12mi | 3/2.0 | 2,086 (+4%) | 4mo | $275,000 | $132 | 85 |
| 1429 College St | 0.17mi | 3/2.0 | 1,980 (-2%) | 15mo | $269,000 | $136 | 77 |
| 107 Charles St | 0.22mi | 3/2.0 | 2,000 (-1%) | 16mo | $239,900 | $120 | 75 |
| 221 Marianne Cir | 0.18mi | 3/2.0 | 1,911 (-5%) | 12mo | $319,900 | $167 | 73 |
| 1429 Live Oak St | 0.14mi | 3/2.0 | 1,803 (-11%) | 9mo | $285,000 | $158 | 68 |
| 124 Lou St | 0.35mi | 3/2.0 | 1,841 (-9%) | 4mo | $225,000 | $122 | 66 |
| 1905 College St | 0.49mi | 3/2.0 | 1,887 (-6%) | 13mo | $242,000 | $128 | 56 |
| 200 Jill Ln | 0.38mi | 4/2.0 (+1) | 1,826 (-9%) | 10mo | $269,000 | $147 | 53 |
Match score weights: distance 35% · size 25% · config 20% · recency 20%. Top-matched comps best support the ARV.
Projected returns pro-forma
-3.0% appreciation · 3.0% rent growth · sell at horizon
- IRR
- -8.6%
- Equity multiple
- 0.68×
- Total profit
- $-14,237
- Equity at exit
- $23,857
- IRR
- 0.9%
- Equity multiple
- 1.06×
- Total profit
- $2,850
- Equity at exit
- $13,834
Cash invested: $44,800 (down + closing). Projections, not guarantees.
Landlord ↔ Tenant lean methodology
- Overall (STATE)
- 87 Strongly Landlord-Friendly
- State Texas
- 87 Strongly Landlord-Friendly · R+5
- County
- — inherits STATE
- City
- — inherits STATE
ZIP-level market 75482
- Active inventory
- 378
- Price-to-rent
- 7.7×
Monthly cashflow live
- Estimated rent
- $1,722 medium interval (Pro) →
- Mortgage (P&I)
- −$839
- Tax from tax record
- −$272 /mo · $3,263/yr
- Insurance
- −$67
- HOA
- −$0
- Vacancy / Maint / Mgmt
- −$362
- Net cashflow
- $182
Break-even live
Sensitivity live
| Price | -10% $273 | -5% $228 | +0% $182 | +5% $137 | +10% $92 |
|---|---|---|---|---|---|
| Rent | -10% $46 | -5% $114 | +0% $182 | +5% $250 | +10% $318 |
| Rate | -1.0pp $263 | -0.5pp $223 | base $182 | +0.5pp $141 | +1.0pp $99 |
UW: 25.0% down · 7.5% · 30yr · 1.5% tax · 5.0% vac · 8.0% maint · 8.0% mgmt
Financing live
Cash to close
- Down payment
- $40,000
- Closing costs
- $4,800
- Reserves months
- —
- Total cash needed
- —
Loan-product check · same deal, 3 products live
Conventional
25% down · 7.5% · 30yr
- Down + closing
- —
- Monthly P&I
- —
- Monthly cashflow
- —
- DSCR
- —
- Eligible?
- —
Personal DTI + credit; lowest rate.
DSCR
20% down · 8.5% · 30yr
- Down + closing
- —
- Monthly P&I
- —
- Monthly cashflow
- —
- DSCR
- —
- Eligible?
- —
No personal income docs; deal must DSCR.
Hard money
10% down · 12.0% · 12mo
- Down + closing
- —
- Monthly P&I
- —
- Monthly cashflow
- —
- DSCR
- —
- Eligible?
- —
Short-term bridge; refi at stabilization.
Rent comps 1 comps
| Address | Beds | Baths | Sqft | Rent | $/sqft | DOM | Units | Dist |
|---|---|---|---|---|---|---|---|---|
| 213 Helm Ln Sulphur Springs, TX | 3.0 | 2.5 | 2084 | $2,000 | $0.96 | 44d | 1 | 0.11mi |
Listing history 18 events
-
2026-06-17days on market $160,000 Active 97 DOM
-
2026-06-16days on market $160,000 Active 96 DOM
-
2026-06-15days on market $160,000 Active 95 DOM
-
2026-06-14days on market $160,000 Active 93 DOM
-
2026-06-12days on market $160,000 Active 92 DOM
-
2026-06-09days on market $160,000 Active 89 DOM
-
2026-06-08days on market $160,000 Active 88 DOM
-
2026-06-07days on market $160,000 Active 87 DOM
-
2026-06-07days on market $160,000 Active 86 DOM
-
2026-06-03days on market $160,000 Active 83 DOM
-
2026-06-02days on market $160,000 Active 82 DOM
-
2026-06-01days on market $160,000 Active 81 DOM
-
2026-05-31days on market $160,000 Active 80 DOM
-
2026-05-30days on market $160,000 Active 79 DOM
-
2026-05-12price $160,000 490-char remark
Show marketing remark (490 chars)
Investor special located at 200 Myndi Circle in Sulphur Springs! This property offers great potential for investors or buyers looking for their next project. Featuring a den that provides additional living space or flexibility for a home office, game room, or second living area. Conveniently located near Helm Lake #2, offering a peaceful setting while still being close to town amenities. Property is being sold AS-IS. Bring your vision and transform this property into something special.
-
2026-04-16price $165,000 490-char remark
Show marketing remark (490 chars)
Investor special located at 200 Myndi Circle in Sulphur Springs! This property offers great potential for investors or buyers looking for their next project. Featuring a den that provides additional living space or flexibility for a home office, game room, or second living area. Conveniently located near Helm Lake #2, offering a peaceful setting while still being close to town amenities. Property is being sold AS-IS. Bring your vision and transform this property into something special.
-
2026-03-11$170,000 Active 490-char remark
Show marketing remark (490 chars)
Investor special located at 200 Myndi Circle in Sulphur Springs! This property offers great potential for investors or buyers looking for their next project. Featuring a den that provides additional living space or flexibility for a home office, game room, or second living area. Conveniently located near Helm Lake #2, offering a peaceful setting while still being close to town amenities. Property is being sold AS-IS. Bring your vision and transform this property into something special.
-
2006-02-03soldstatus
ⓘ Source: listings_history table (triggers on properties + properties_extension) + one-shot
backfill from property_details.listing_events for pre-trigger history.
Tax reassessment forecast TX · Resets to sale price
- Current annual tax
- $3,263 · $272/mo
- Projected year-2 tax
- $3,263 · $272/mo
- Expected delta
- $0/yr ($0/mo · 0.0%)
ⓘ Screening estimate from a state-policy table — verify with the county assessor before closing.
Climate risk First Street
- Flood 1/10 Low FEMA zone X (unshaded) · 0% chance over 30 yrs
- Wildfire 4/10 Moderate
- Heat 7/10 Severe 7 d/yr ≥109°F today · 24 d/yr by 30 yrs out
- Wind 6/10 Major 27% chance of damaging wind over 30 yrs
- Air quality 2/10 Low 0 unhealthy d/yr today · 1 by 30 yrs out
Nearby sold comps map
Loading sold comps map…
Walkable amenities ~0.75 mi
Loading nearby amenities…
Taxation est. · year 1
- Rental income
- $20,659
- − Mortgage interest
- −$8,962
- − Property taxes
- −$3,263
- − Insurance
- −$800
- − Repairs & maintenance
- −$1,653
- − Management
- −$1,653
- − Depreciation
- −$4,655
- Taxable loss
- −$326
- Est. tax savings @ 24.0%
- +$78
- After-tax cash flow
- $2,268/yr
For passive investors: Depreciation is non-cash, so a rental often shows a tax loss while cash-flowing — sheltering income. Rental losses are passive: they offset passive income freely, and up to $25,000/yr can offset ordinary (W-2) income if you actively participate and your MAGI is under $100k (phasing out to $0 by $150k); unused losses carry forward. On sale, claimed depreciation is recaptured at up to 25%, and gains may owe capital-gains tax (a 1031 exchange can defer both). Figures are a year-1 estimate at your 24.0% rate — not tax advice; consult a CPA.
Schools (NCES district)
- District
- Sulphur Springs ISD
- NCES district ID
- 4841820
- Math proficiency
- 46% ▼ -7.00%
- Reading proficiency
- 40% ▼ -4.00%
- Median HH income
- $42,871
- Composite
- 36.33/100
- National rank
- #4692
- State rank
- #323 of 826 in TX
Livability — Sulphur Springs
- Score
- 70/100
- State rank
- #350
- US rank
- #7665
Category grades
Schools grade is shown separately in the Schools card above.
Census & demographics
- Census place
- Sulphur Springs, TX
- County
- Hopkins County · 26,483 people
- City population
- 26,483
- Metro
- Sulphur Springs, TX
- Population (ZIP)
- 26,483
- Household income
- $69,970
- Rent vs Own
- Severe rent burden
- 543.0
Population outlook (Hopkins County) Hauer SSP2
- Today (2025)
- 38,107 people
- By 2030
- 38,867 · +2.0%
- By 2040
- 40,009 · +5.0%
- By 2050
- 40,448 · +6.1%
- By 2075
- 40,669 · +6.7%
- By 2100
- 37,234 · -2.3%
Race, ethnicity, and origin ACS 2023
- Neighborhood character
- Predominantly White (70%)
- Race & ethnicity
- White 70% Hispanic / Latino 17% Black 9% Two or more races 7% Asian 1%
- Hispanic origin (detail)
- Mexican 15%
- Common ancestry
- Slovak 2% Lithuanian 2% Iranian 1%
- Foreign-born
- 9% · Canada, Vietnam
- Languages at home
- 84% English-only · Spanish 14% Vietnamese 1%
Political lean MEDSL · Hopkins
- 2024 margin
- Solid R (+64.6) · D 17.4% · R 82.0%
- 2008→2024 swing
- -20.0pp toward R · 2008: -44.7pp · 2024: -64.6pp
- All cycles
- 2024: R+64.6 2020: R+60.7 2016: R+60.8 2012: R+55.4 2008: R+44.7
Not yet ingested
- Civics
- —
Market trends
- HPI YoY
- ▼ -125.79%
- Current HPI
- 156.0526
- Rent YoY
- —
- Metro
- Sulphur Springs, TX
- State GDP YoY
- ▲ 3.95%
- F500 in state
- 110
Industry mix (Fortune 500 HQ in TX)
| Industry | F500 HQs | Revenue |
|---|---|---|
| Energy | 16 | $1,198B |
|
||
| Technology | 5 | $198B |
|
||
| Engineering / Construction | 4 | $72B |
|
||
| Energy Services | 3 | $60B |
|
||
| Utilities | 3 | $41B |
|
||
| Healthcare | 2 | $330B |
|
||
Price history
-5.9% since first listed4 events — show timeline
- 2026-05-12 Price Changed $160,000 NTREIS
- 2026-04-16 Price Changed $165,000 NTREIS
- 2026-03-11 Listed $170,000 NTREIS
- 2006-02-03 Sold (Public Records) — Public Records
Property tax history
+2.1%/yrLatest (2025): $3,263 · +3.0% YoY. Source: county tax records.
Cash-flow waterfall
monthlySold comps — $/sqft
last 12 mo · ≤1 miLoading sold comps…