 🏷️ Likely Rental
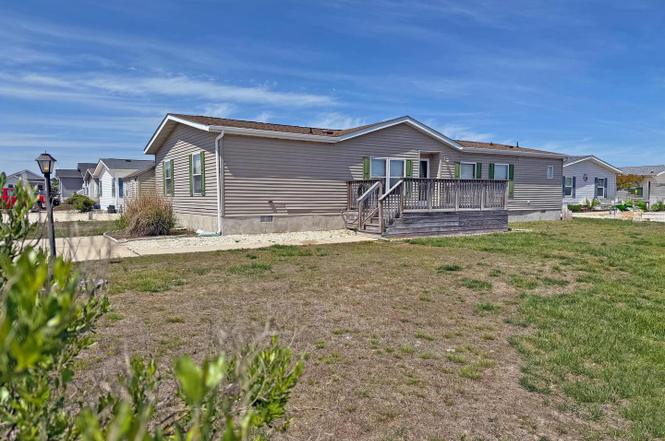
26383 Jennifer Lee Dr #178 · Long Neck, DE
Flood risk 9/10 · Severe
- FEMA flood zone
- AE
- Chance of flooding over 30 yrs
- 0.99%
- Est. flood insurance / yr
- $2,026 – $9,024
Fire risk 1/10 · Minimal
- Est. fire insurance / yr
- $476 – $884
Heat risk 9/10 · Severe
- Hot days now (above 100°F)
- 7 days/yr
- Hot days in 30 yrs
- 19 days/yr
Wind risk 8/10 · Major
- Chance of severe wind over 30 yrs
- 80.0%
Air-quality risk 2/10 · Minimal
- Unhealthy air days now
- 1 days/yr
- Unhealthy air days in 30 yrs
- 1 days/yr
Risk factors via First Street. Map © Google.
Why this score? — see what drove the B+ grade
The composite is a weighted blend of 9 inputs, each scored 0–100. Each bar is that input's sub-score; the figure is the points it added to the 100-point composite (weight × sub-score).
- Cash flow +30.0/30.0
- ARV discount +15.0/15.0
- 1% rule +10.0/10.0
- DSCR +10.0/10.0
- Livability +3.5/5.0
- Schools +2.9/10.0
- Rent growth +2.5/5.0
- Condition / age +2.2/5.0
- Appreciation +0.0/10.0
$79,900
🖨 Deal sheet (PDF) 📄 Offer letter ✓ Due diligence
Listing remarks
Mariner’s Cove is the place to be if you are a boater, especially since this community has slips for rent, as well as a community boat ramp. Ideal for a vacationing. .. but this house spacious enough as a year-round residence. This 1,680 sq. ft. doublewide home sits on a premium corner lot. The living room has vaulted ceiling and it adjoins the sunroom, which has a sliding glass door into the enclosed 3-season porch. The eat-in kitchen has space for a dinette set & it has a little breakfast bar. Built-in shelving in the kitchen gives you space to store your cookbooks and small kitchen appliances. There is an electric range with a range hood, a dishwasher, and a fridge. The dinin
Key facts
- Premium corner lot
- Electric range
- Front and rear decks
Tags
Property features AI
Finance
- Other: Located in a federal flood zone (AE); Accessible with 2+ access exits; Pets allowed (cats and dogs with number limits)
- Financial info: Monthly land lease payment; Annual ground rent listed among income/expense items
- HOA & community: Association amenities include boat ramp, community center, picnic area, outdoor pool, club house, exercise room, common grounds and water/lake privileges; Association fee covers common area maintenance, pier/dock maintenance, pools, recreation facilities, road maintenance and snow removal; Private roads with blacktop surface; Community managed by Equity LifeStyle Properties, Inc.
Exterior
- Parking: Concrete driveway; Driveway parking with four spaces (total garage and parking spaces: 4)
- Security: Insulated windows
- Utilities: Public water; Public sewer; 200+ amp electric service with 220 volts; Fiber optic, cable and satellite internet available
- Home design: Manufactured double-wide (Commodore); Estimated year built; Shingle roof; Entry and layout on main level; Land lease ownership interest (monthly land lease)
- Construction: Vinyl siding; Pillar/post/pier foundation
- Exterior features: Corner lot with cleared front yard; Deck(s) and enclosed porch; Private water access to a cove on Rehoboth Bay; Community in-ground fenced pool; Shed on the property; Above- and below-grade other structures noted
Interior
- Kitchen: Dishwasher; Electric oven/range; Range hood; Refrigerator; Eat-in kitchen
- Bedrooms: Three bedrooms on the main level
- Flooring: Carpet; Laminate; Vinyl
- Bathrooms: Two full bathrooms (both on the main level)
- Heating & cooling: Forced-air heating (electric); Central air conditioning; Ceiling fans; Electric hot water
- Interior features: Tub/shower and walk-in shower; Built-in storage; Ceiling fans; Dining area; Traditional floor plan; Eat-in kitchen; Primary bathroom; Window treatments; Paneled walls; Insulated, sliding glass and storm doors
- Laundry & utility: Washer and dryer in unit (dryer is electric); Has laundry on the main floor
Neighborhood map
What this means for you Summary
Snapshot
- This is a 3-bed/2.0-bath single-family listed at $80k. Condition is rated fair.
Deal economics
- At list price, monthly cash flow is $903 ($11k/yr) — positive.
- The deal already cash-flows at list — no discount required.
- Meets the 1% rule at list price ($2k rent vs $80k).
- Recommended offer: $79k (1.5% below list) — sets the bar for market timing.
- Cap rate 26.8% vs local median 3.4% in Long Neck — top-decile yield for the area; either an underpriced asset or a hidden risk that comps aren't pricing in. Stress-test before assuming the spread holds.
Location & tenants
- Location reads 69/100 on livability (#30 in DE) — a middle-class / working-renter tenant base. Strengths: cost of living A+, housing A+, crime A-; Watch: employment D+, amenities F, commute F.
- Indian River School District (rural): math 25% / reading 41% proficiency, ranked #14 of 26 in DE (top 54%) — families likely to look elsewhere, expect single-tenant / working-renter base with shorter leases.
- Zoned schools: Long Neck Elementary School (math 22% / reading 35%, grade F, #57 of 105 statewide, top 55%, 693 students, 0% FRL); Millsboro Middle School (math 24% / reading 42%, grade F, #14 of 36 statewide, top 37%, 771 students, 0% FRL); Sussex Central High School (math 23% / reading 42%, grade F, #24 of 40 statewide, top 59%, 2,039 students, 0% FRL) — zoned schools average 0% FRL vs 49% district-wide (49 pts lower); this property's tenant base skews higher-income than the district average.
- Market conditions: 870 active listings in the ZIP; 2 comparable units currently listed for rent nearby; solid renter incomes; 4,354 units permitted in Sussex County in 2024 (344 in 5+ unit buildings).
- This rent runs 37% of the median local income ($78k/yr) — at the standard rent-burdened threshold; future hikes will face affordability resistance.
Forward outlook
- Local home prices are declining (-3.0%/yr); year-one equity from $552 of loan paydown is wiped out by about $2k of value loss. Plan a longer hold.
- Sussex County population projected at +25% by 2050 — long-run rental-demand tailwind backs the buy-and-hold thesis.
- At projected returns (-3.0% appreciation + 3.0% rent growth), your $22k cash investment doubles in ~3 years — after that, you're playing with house money.
Negotiation context
- It's been on market 25 days — a 2% lower offer ($79k) is reasonable based on typical stale-listing flexibility.
Risks & watch-outs
- Watch-outs: flood insurance adds $460/mo.
- Climate carrying-cost: in FEMA flood zone AE (mandatory federal flood insurance); severe wind risk, 80% chance of damaging wind over 30y; extreme-heat days projected 7→19/yr by 2055 (HVAC capex compounding) — expect insurance premiums to compound above CPI over the hold.
Questions for the listing agent
- Have any recent inspections been done? Can we get a copy of the seller's disclosures and any deferred-maintenance estimates?
- What's the actual annual flood-insurance premium (NFIP or private), and is the property in a SFHA with mandatory coverage?
- Is there a deadline driving the sale (1031 exchange, divorce, estate, relocation)? That informs how much negotiation room exists.
- Schools are F-rated, which usually means shorter tenancies and higher turnover. Who's the typical renter profile here, and what's been the actual vacancy rate?
- What's the average days-on-market for RENTAL listings here right now (not sales)? A rising rental-DOM trend means longer vacancies and softer asking-rent achievability than the comps imply.
- What's the recent tenant-quality profile in this submarket — average credit score on applications, eviction rate, late-payment / NSF rate, and stable-employment percentage? A property-management company in the area should have these aggregated.
- How much new for-sale + rental construction is in the pipeline within 1–3 miles? Heavy new supply typically softens prices + rents 12–24 months out; constrained supply supports both.
Investment metrics
- 1% rule
- 3.03% ✓
- Cap rate
- 26.77%
- Cash-on-cash
- 73.13%
- DSCR
- 4.25
- GRM
- 2.7
CMA / ARV
- ARV (median comp)
- $153,524
- List price
- $79,900
- Delta
- -47.96%
- Verdict
- UNDERPRICED
- Comps
- 20 within 1.0 mi
Show comp detail 12 sales within ~0.75 mi
| Address | Dist | Beds/Ba | Sqft | Sold | Price | $/sf | Match |
|---|---|---|---|---|---|---|---|
| 26273 N Cove Dr #47846 | 0.12mi | 3/2.0 | 1,624 (-3%) | 9mo | $210,000 | $129 | 81 |
| 26217 Cove Dr | 0.17mi | 3/2.0 | 1,567 (-7%) | 2mo | $210,000 | $134 | 80 |
| 35665 Knoll Way | 0.16mi | 3/2.0 | 1,792 (+7%) | 9mo | $130,000 | $73 | 74 |
| 35518 Joann Dr #137 | 0.09mi | 2/— (-1) | 1,484 (-12%) | 3mo | $138,000 | $93 | 69 |
| 35615 Knoll Way #43056 | 0.12mi | 3/2.0 | 1,904 (+13%) | 7mo | $215,000 | $113 | 67 |
| 35536 E Harbor Dr #16911 | 0.69mi | 3/2.0 | 1,700 (+1%) | 2mo | $170,000 | $100 | 64 |
| 35515 Knoll Way #56383 | 0.10mi | 3/2.0 | 1,447 (-14%) | 10mo | $210,000 | $145 | 64 |
| 35593 Main St #36356 | 0.45mi | 3/2.0 | 1,536 (-9%) | 3mo | $75,000 | $49 | 62 |
| 26406 Pine Cone Dr #155 | 0.64mi | 3/2.0 | 1,768 (+5%) | 5mo | $310,000 | $175 | 58 |
| 34858 Gunnel Rd Unit E-639 | 0.73mi | 3/2.0 | 1,716 (+2%) | 7mo | $351,653 | $205 | 56 |
| 27113 Clipper Rd #52505 | 0.74mi | 3/2.0 | 1,484 (-12%) | 8mo | $155,000 | $104 | 39 |
| 26396 Pine Cone Dr Lot 152 | 0.65mi | 2/2.0 (-1) | 1,904 (+13%) | 8mo | $235,000 | $123 | 35 |
Match score weights: distance 35% · size 25% · config 20% · recency 20%. Top-matched comps best support the ARV.
Projected returns pro-forma
-3.0% appreciation · 3.0% rent growth · sell at horizon
- IRR
- 46.1%
- Equity multiple
- 3.01×
- Total profit
- $44,886
- Equity at exit
- $11,913
- IRR
- 52.0%
- Equity multiple
- 6.12×
- Total profit
- $114,441
- Equity at exit
- $6,908
Cash invested: $22,372 (down + closing). Projections, not guarantees.
Landlord ↔ Tenant lean methodology
- Overall (STATE)
- 70 Landlord-Friendly
- State Delaware
- 70 Landlord-Friendly · D+7
- County
- — inherits STATE
- City
- — inherits STATE
ZIP-level market 19966
- Home prices YoY
- -6.4%
- Active inventory
- 870
- Price-to-rent
- 2.7×
Monthly cashflow live
- Estimated rent
- $2,425 medium interval (Pro) →
- Mortgage (P&I)
- −$419
- Tax est. 1.5%
- −$100 /mo · $1,198/yr
- Insurance
- −$33
- Flood insurance flood zone
- −$460 /mo · $5,525/yr
- HOA
- −$0
- Vacancy / Maint / Mgmt
- −$509
- Net cashflow
- $903
Break-even live
Sensitivity live
| Price | -10% $958 | -5% $931 | +0% $903 | +5% $875 | +10% $848 |
|---|---|---|---|---|---|
| Rent | -10% $711 | -5% $807 | +0% $903 | +5% $999 | +10% $1,095 |
| Rate | -1.0pp $943 | -0.5pp $923 | base $903 | +0.5pp $882 | +1.0pp $861 |
UW: 25.0% down · 7.5% · 30yr · 1.5% tax · 5.0% vac · 8.0% maint · 8.0% mgmt
Financing live
Cash to close
- Down payment
- $19,975
- Closing costs
- $2,397
- Reserves months
- —
- Total cash needed
- —
Loan-product check · same deal, 3 products live
Conventional
25% down · 7.5% · 30yr
- Down + closing
- —
- Monthly P&I
- —
- Monthly cashflow
- —
- DSCR
- —
- Eligible?
- —
Personal DTI + credit; lowest rate.
DSCR
20% down · 8.5% · 30yr
- Down + closing
- —
- Monthly P&I
- —
- Monthly cashflow
- —
- DSCR
- —
- Eligible?
- —
No personal income docs; deal must DSCR.
Hard money
10% down · 12.0% · 12mo
- Down + closing
- —
- Monthly P&I
- —
- Monthly cashflow
- —
- DSCR
- —
- Eligible?
- —
Short-term bridge; refi at stabilization.
Rent comps 2 comps
| Address | Beds | Baths | Sqft | Rent | $/sqft | DOM | Units | Dist |
|---|---|---|---|---|---|---|---|---|
| 35805 S Gloucester Cir Millsboro, DE | 3.0 | 2.5 | 2100 | $2,300 | $1.10 | 45d | 1 | 0.26mi |
| 35829 S Gloucester Cir Unit 35829 Long Neck, DE | 3.0 | 2.5 | 1500 | $1,995 | $1.33 | 15d | 1 | 0.29mi |
Listing history 2 events
-
2026-06-15status $79,900 Pending 25 DOM
-
2026-05-04$79,900 Active 2487-char remark
ⓘ Source: listings_history table (triggers on properties + properties_extension) + one-shot
backfill from property_details.listing_events for pre-trigger history.
Climate risk First Street
- Flood 9/10 Extreme FEMA zone AE · 99% chance over 30 yrs
- Wildfire 1/10 Low
- Heat 9/10 Extreme 7 d/yr ≥100°F today · 19 d/yr by 30 yrs out
- Wind 8/10 Severe 80% chance of damaging wind over 30 yrs
- Air quality 2/10 Low 1 unhealthy d/yr today · 1 by 30 yrs out
Nearby sold comps map
Loading sold comps map…
Walkable amenities ~0.75 mi
Loading nearby amenities…
Taxation est. · year 1
- Rental income
- $29,098
- − Mortgage interest
- −$4,476
- − Property taxes
- −$1,198
- − Insurance
- −$5,924
- − Repairs & maintenance
- −$2,328
- − Management
- −$2,328
- − Depreciation
- −$2,324
- Taxable income
- $10,519
- Est. tax owed @ 24.0%
- −$2,525
- After-tax cash flow
- $8,312/yr
For passive investors: Depreciation is non-cash, so a rental often shows a tax loss while cash-flowing — sheltering income. Rental losses are passive: they offset passive income freely, and up to $25,000/yr can offset ordinary (W-2) income if you actively participate and your MAGI is under $100k (phasing out to $0 by $150k); unused losses carry forward. On sale, claimed depreciation is recaptured at up to 25%, and gains may owe capital-gains tax (a 1031 exchange can defer both). Figures are a year-1 estimate at your 24.0% rate — not tax advice; consult a CPA.
Condition & rehab AI · 12 photos
This 1,680 sq. ft. doublewide home in Mariner’s Cove requires moderate renovations to update the kitchen and paint the interior and exterior. The property has a good foundation and structure, and the location is ideal for both year-round and vacationing residents.
Repairs flagged
- Moderate kitchen cabinets — dated and in need of replacement
- Moderate kitchen appliances — outdated and in need of replacement
- Minor interior paint — peeling in some areas
Value-add opportunities
- Both update kitchen cabinets and appliances — modernizing the kitchen will appeal to both buyers and renters
- Both paint interior and exterior — fresh paint will improve curb appeal and interior aesthetics
- Both landscaping — improved landscaping will enhance curb appeal and attract more potential buyers
Renovation cost estimate screening
| Repair item | Severity | Est. cost |
|---|---|---|
| kitchen cabinets · dated and in need of replacement | Moderate | $3,000–15,000 |
| kitchen appliances · outdated and in need of replacement | Moderate | $3,000–15,000 |
| interior paint · peeling in some areas | Minor | $500–3,000 |
| Total estimated repair cost · 3 items | $6,500–33,000 |
Value-add ROI direction
- Both update kitchen cabinets and appliances — modernizing the kitchen will appeal to both buyers and renters ↑
- Both paint interior and exterior — fresh paint will improve curb appeal and interior aesthetics ↑
- Both landscaping — improved landscaping will enhance curb appeal and attract more potential buyers ↑
ⓘ Cost ranges are severity-bucket heuristics (US national rule-of-thumb). Get contractor quotes + a written scope before underwriting a rehab budget.
Schools (NCES district)
- District
- Indian River School District
- NCES district ID
- 1000680
- Math proficiency
- 25% ▼ -27.00%
- Reading proficiency
- 41% ▼ -17.00%
- Median HH income
- $53,838
- Composite
- 28.99/100
- National rank
- #6620
- State rank
- #14 of 26 in DE
Livability — Long Neck
- Score
- 69/100
- State rank
- #30
- US rank
- #8720
Category grades
Schools grade is shown separately in the Schools card above.
Census & demographics
- County
- Sussex County · 82,708 people
- Metro
- Salisbury, MD-DE
- Population (ZIP)
- 35,884
- Household income
- $78,305
- Rent vs Own
- Severe rent burden
- 464.0
Population outlook (Sussex County) Hauer SSP2
- Today (2025)
- 248,853 people
- By 2030
- 264,464 · +6.3%
- By 2040
- 290,980 · +16.9%
- By 2050
- 311,259 · +25.1%
- By 2075
- 352,488 · +41.6%
- By 2100
- 367,406 · +47.6%
Race, ethnicity, and origin ACS 2023
- Neighborhood character
- Predominantly White (74%)
- Race & ethnicity
- White 74% Hispanic / Latino 11% Black 8% Two or more races 7% Native American 3% Asian 1%
- Hispanic origin (detail)
- Mexican 3%
- Common ancestry
- Romanian 4% Slovak 2% Serbian 1%
- Foreign-born
- 8% · Canada, China
- Languages at home
- 88% English-only · Spanish 9% Other Indo-European 1%
Political lean MEDSL · Sussex
- 2024 margin
- R (+11.0) · D 43.9% · R 54.9% · Other 1.2%
- 2008→2024 swing
- -2.4pp toward R · 2008: -8.6pp · 2024: -11.0pp
- All cycles
- 2024: R+11.0 2020: R+11.2 2016: R+22.0 2012: R+13.0 2008: R+8.6
Not yet ingested
- Civics
- —
Market trends
- HPI YoY
- ▼ -18.26%
- Current HPI
- 268.5609
- Rent YoY
- —
- Metro
- Salisbury, MD-DE
- State GDP YoY
- —
- F500 in state
- 0
Price history
3 events — show timeline
- 2026-06-15 Pending — BRIGHT MLS
- 2026-05-29 Contingent — BRIGHT MLS
- 2026-05-04 Listed $79,900 BRIGHT MLS
Cash-flow waterfall
monthlySold comps — $/sqft
last 12 mo · ≤1 miLoading sold comps…