 🌊 Lakefront
248 Curvy Rd · Friedenswald, MO
Flood risk 1/10 · Minimal
- FEMA flood zone
- X (unshaded)
- Chance of flooding over 30 yrs
- 0.0%
- Est. flood insurance / yr
- $473 – $860
Fire risk 4/10 · Minor
- Est. fire insurance / yr
- $1,054 – $1,958
Heat risk 5/10 · Moderate
- Hot days now (above 107°F)
- 7 days/yr
- Hot days in 30 yrs
- 19 days/yr
Wind risk 2/10 · Minimal
- Chance of severe wind over 30 yrs
- —
Air-quality risk 2/10 · Minimal
- Unhealthy air days now
- 1 days/yr
- Unhealthy air days in 30 yrs
- 1 days/yr
Risk factors via First Street. Map © Google.
Why this score? — see what drove the C- grade
The composite is a weighted blend of 9 inputs, each scored 0–100. Each bar is that input's sub-score; the figure is the points it added to the 100-point composite (weight × sub-score).
- Cash flow +17.2/30.0
- ARV discount +15.0/15.0
- DSCR +5.3/10.0
- Schools +4.0/10.0
- 1% rule +3.8/10.0
- Rent growth +2.5/5.0
- Livability +2.5/5.0
- Condition / age +2.5/5.0
- Appreciation +0.0/10.0
$198,000
🖨 Deal sheet 📄 Offer letter ✓ Due diligence
Listing remarks MLS
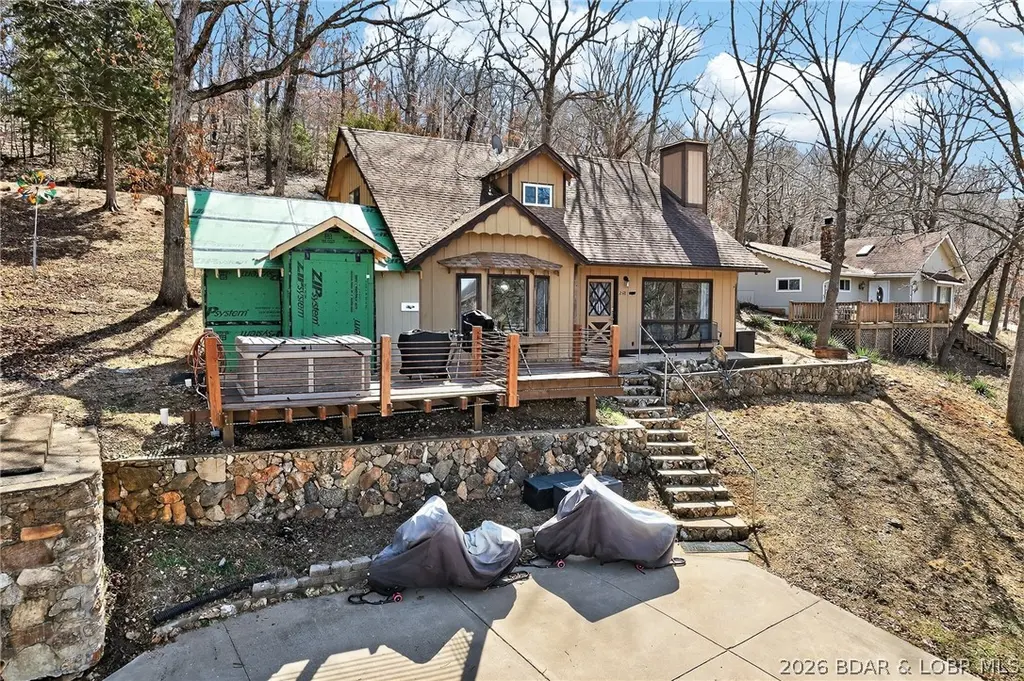
Lake view and access home located at the Big Niangua 2MM with convenient access to Hwy 5. Priced to reflect the need for a new septic system, this property presents an excellent opportunity for investors, flippers, or buyers seeking a customizable lake retreat. The home is partially finished and requires completion of several items including upper kitchen cabinets, interior trim, septic system installation, siding and roofing on the bonus room addition. Offering approximately 1,400+ square feet, the home features 3 bedrooms and 1.5 baths with a functional layout. The main level includes the kitchen, living area, laundry, half bath, and one bedroom, while the upper level provides two additional bedrooms and a full bath. Enjoy a spacious front deck with lake views, along with a hot tub for added relaxation. A 10x20 slip in the community dock is included, making it ideal for boating enthusiasts. Conveniently located near popular lakefront destinations such as The Cave Bar & Grill and Nauti Fish, and just 2 miles from the 31MM. Easy access to both Greenview and Camdenton completes this value-packed offering.
Key facts
- Hot tub
- Lake view
- Access home
Tags
Neighborhood map
What this means for you Summary
Snapshot
- This is a 3-bed/1.5-bath other listed at $198k.
Deal economics
- At list price, monthly cash flow is $140 ($2k/yr) — positive.
- The deal already cash-flows at list — no discount required.
- To meet the 1% rule (rent ≥ 1% of price), the offer needs to be $175k (11.6% below list).
- Recommended offer: $175k (11.6% below list) — sets the bar for 1% rule.
Location & tenants
- Location reads: area grade C — affects rentability + tenant quality, not the cash-flow math above.
- Camdenton R-III (rural): math 46% / reading 48% proficiency, ranked #68 of 324 in MO (top 21%) — families likely to look elsewhere, expect single-tenant / working-renter base with shorter leases.
- Market conditions: 416 active listings in the ZIP; 272 units permitted in Camden County in 2024 (0 in 5+ unit buildings).
- This rent runs 34% of the median local income ($62k/yr) — at the standard rent-burdened threshold; future hikes will face affordability resistance.
Forward outlook
- Local home prices are declining (-3.0%/yr); year-one equity from $1k of loan paydown is wiped out by about $6k of value loss. Plan a longer hold.
- Camden County population projected to shrink 6% by 2050 — rents likely to lag national; underwrite the cash flow, not the appreciation.
Negotiation context
- It's been on market 89 days — a 6% lower offer ($186k) is reasonable based on typical stale-listing flexibility.
- 7 sale attempts since 13y ago with the ask held roughly flat each time — persistent listings suggest the price (not the market) is what's stuck; bring a comps-based counter.
Risks & watch-outs
- Climate carrying-cost: extreme-heat days projected 7→19/yr by 2055 (HVAC capex compounding) — expect insurance premiums to compound above CPI over the hold.
Questions for the listing agent
- It's been on market 89 days. Have you received any prior offers? Is the seller open to a 12% concession, seller financing, or rate buy-down credit?
- Built in 1978 — when were the roof, HVAC, electrical panel, plumbing, and water heater last replaced?
- What does the HOA fee cover, when was the last increase, and are there any pending special assessments or reserve-fund shortfalls?
- Why hasn't it sold? Are there any deal-killer items the seller is aware of (foundation, flood, title, zoning, code violations)?
- Is there a deadline driving the sale (1031 exchange, divorce, estate, relocation)? That informs how much negotiation room exists.
- This sits on a lake — are riparian / water-frontage rights deeded with the parcel? Any dock permits, shoreline easements, or HOA water-use restrictions?
- What's the documented flood / surge / shoreline-erosion history here (FEMA AND non-FEMA — e.g., storm surge, creek backup, septic-field saturation)?
- Any water-quality or seasonal algae-bloom issues that affect tenant satisfaction or short-term-rental demand?
- What's the average days-on-market for RENTAL listings here right now (not sales)? A rising rental-DOM trend means longer vacancies and softer asking-rent achievability than the comps imply.
- What's the recent tenant-quality profile in this submarket — average credit score on applications, eviction rate, late-payment / NSF rate, and stable-employment percentage? A property-management company in the area should have these aggregated.
- How much new for-sale + rental construction is in the pipeline within 1–3 miles? Heavy new supply typically softens prices + rents 12–24 months out; constrained supply supports both.
Investment metrics
- 1% rule
- 0.88% ✗
- Cap rate
- 7.14%
- Cash-on-cash
- 3.02%
- DSCR
- 1.13
- GRM
- 9.4
CMA / ARV
- ARV (median comp)
- $244,987
- List price
- $198,000
- Delta
- -19.18%
- Verdict
- UNDERPRICED
- Comps
- 6 within 2.0 mi
Projected returns pro-forma
-3.0% appreciation · 3.0% rent growth · sell at horizon
- IRR
- -11.6%
- Equity multiple
- 0.58×
- Total profit
- $-23,244
- Equity at exit
- $29,522
- IRR
- -2.4%
- Equity multiple
- 0.84×
- Total profit
- $-8,998
- Equity at exit
- $17,119
Cash invested: $55,440 (down + closing). Projections, not guarantees.
Landlord ↔ Tenant lean methodology
- Overall (STATE)
- 81 Strongly Landlord-Friendly
- State Missouri
- 81 Strongly Landlord-Friendly · R+10
- County
- — inherits STATE
- City
- — inherits STATE
ZIP-level market 65020
- Home prices YoY
- -32.9%
- Active inventory
- 416
- Price-to-rent
- 9.4×
Monthly cashflow live
- Estimated rent
- $1,749 medium interval (Pro) →
- Mortgage (P&I)
- −$1,038
- Tax from tax record
- −$80 /mo · $956/yr
- Insurance
- −$82
- HOA
- −$42
- Vacancy / Maint / Mgmt
- −$367
- Net cashflow
- $140
Break-even live
UW: 25.0% down · 7.5% · 30yr · 1.5% tax · 5.0% vac · 8.0% maint · 8.0% mgmt
Financing live
Cash to close
- Down payment
- $49,500
- Closing costs
- $5,940
- Reserves months
- —
- Total cash needed
- —
Loan-product check · same deal, 3 products live
Conventional
25% down · 7.5% · 30yr
- Down + closing
- —
- Monthly P&I
- —
- Monthly cashflow
- —
- DSCR
- —
- Eligible?
- —
Personal DTI + credit; lowest rate.
DSCR
20% down · 8.5% · 30yr
- Down + closing
- —
- Monthly P&I
- —
- Monthly cashflow
- —
- DSCR
- —
- Eligible?
- —
No personal income docs; deal must DSCR.
Hard money
10% down · 12.0% · 12mo
- Down + closing
- —
- Monthly P&I
- —
- Monthly cashflow
- —
- DSCR
- —
- Eligible?
- —
Short-term bridge; refi at stabilization.
HOA detail
- Monthly dues
- $42 · $504/yr
Listing history 27 events
-
2026-06-19days on market $198,000 Active 89 DOM
-
2026-06-18days on market $198,000 Active 88 DOM
-
2026-06-17days on market $198,000 Active 87 DOM
-
2026-06-16days on market $198,000 Active 86 DOM
-
2026-06-15days on market $198,000 Active 85 DOM
-
2026-06-14days on market $198,000 Active 83 DOM
-
2026-06-12days on market $198,000 Active 82 DOM
-
2026-06-09days on market $198,000 Active 79 DOM
-
2026-06-08days on market $198,000 Active 78 DOM
-
2026-06-07days on market $198,000 Active 77 DOM
-
2026-06-05days on market $198,000 Active 74 DOM
-
2026-06-03days on market $198,000 Active 73 DOM
-
2026-06-02days on market $198,000 Active 72 DOM
-
2026-06-01days on market $198,000 Active 71 DOM
-
2026-05-31days on market $198,000 Active 70 DOM
-
2026-05-30days on market $198,000 Active 69 DOM
-
2026-03-22$198,000 Active 1127-char remark
Show marketing remark (1127 chars)
Lake view and access home located at the Big Niangua 2MM with convenient access to Hwy 5. Priced to reflect the need for a new septic system, this property presents an excellent opportunity for investors, flippers, or buyers seeking a customizable lake retreat. The home is partially finished and requires completion of several items including upper kitchen cabinets, interior trim, septic system installation, siding and roofing on the bonus room addition. Offering approximately 1,400+ square feet, the home features 3 bedrooms and 1.5 baths with a functional layout. The main level includes the kitchen, living area, laundry, half bath, and one bedroom, while the upper level provides two additional bedrooms and a full bath. Enjoy a spacious front deck with lake views, along with a hot tub for added relaxation. A 10x20 slip in the community dock is included, making it ideal for boating enthusiasts. Conveniently located near popular lakefront destinations such as The Cave Bar & Grill and Nauti Fish, and just 2 miles from the 31MM. Easy access to both Greenview and Camdenton completes this value-packed offering.
-
2021-03-03soldstatus
-
2021-03-02soldstatus
-
2020-12-01$140,000
-
2018-01-26soldstatus
-
2017-08-31$70,000
-
2016-10-23$99,900
-
2014-11-05$105,000
-
2014-06-07$117,900
-
2013-09-09$117,900
-
1983-01-01soldstatus
ⓘ Source: listings_history table (triggers on properties + properties_extension) + one-shot
backfill from property_details.listing_events for pre-trigger history.
Tax reassessment forecast MO · Resets to sale price
- Current annual tax
- $956 · $80/mo
- Projected year-2 tax
- $1,921 · $160/mo
- Expected delta
- +$965/yr (+$80/mo · 101.0%)
ⓘ Screening estimate from a state-policy table — verify with the county assessor before closing.
Climate risk First Street
- Flood 1/10 Low FEMA zone X (unshaded) · 0% chance over 30 yrs
- Wildfire 4/10 Moderate
- Heat 5/10 Major 7 d/yr ≥107°F today · 19 d/yr by 30 yrs out
- Wind 2/10 Low
- Air quality 2/10 Low 1 unhealthy d/yr today · 1 by 30 yrs out
Nearby sold comps map
Loading sold comps map…
Walkable amenities ~0.75 mi
Loading nearby amenities…
Taxation est. · year 1
- Rental income
- $20,994
- − Mortgage interest
- −$11,091
- − Property taxes
- −$956
- − Insurance
- −$990
- − Repairs & maintenance
- −$1,679
- − Management
- −$1,679
- − HOA
- −$504
- − Depreciation
- −$5,760
- Taxable loss
- −$1,666
- Est. tax savings @ 24.0%
- +$400
- After-tax cash flow
- $2,075/yr
For passive investors: Depreciation is non-cash, so a rental often shows a tax loss while cash-flowing — sheltering income. Rental losses are passive: they offset passive income freely, and up to $25,000/yr can offset ordinary (W-2) income if you actively participate and your MAGI is under $100k (phasing out to $0 by $150k); unused losses carry forward. On sale, claimed depreciation is recaptured at up to 25%, and gains may owe capital-gains tax (a 1031 exchange can defer both). Figures are a year-1 estimate at your 24.0% rate — not tax advice; consult a CPA.
Schools (NCES district)
- District
- Camdenton R-III
- NCES district ID
- 2906990
- Math proficiency
- 46% ▲ 10.00%
- Reading proficiency
- 48% ▲ 1.00%
- Median HH income
- $46,496
- Composite
- 39.96/100
- National rank
- #3838
- State rank
- #68 of 324 in MO
Livability — Friedenswald
No livability data for this city. (Only ~50 U.S. cities are tracked.)
Census & demographics
- County
- Camden County · 21,945 people
- Metro
- nan
- Population (ZIP)
- 14,748
- Household income
- $62,392
- Rent vs Own
- Severe rent burden
- 166.0
Population outlook (Camden County) Hauer SSP2
- Today (2025)
- 44,585 people
- By 2030
- 44,476 · -0.2%
- By 2040
- 43,513 · -2.4%
- By 2050
- 41,705 · -6.5%
- By 2075
- 36,903 · -17.2%
- By 2100
- 30,164 · -32.3%
Race, ethnicity, and origin ACS 2023
- Neighborhood character
- Predominantly White (90%)
- Race & ethnicity
- White 90% Hispanic / Latino 5% Two or more races 4%
- Hispanic origin (detail)
- Mexican 3%
- Common ancestry
- Lithuanian 4% Slovak 2% Romanian 2%
- Foreign-born
- 2% · Canada
- Languages at home
- 95% English-only · Spanish 2% German/W. Germanic 1% Russian/Polish/Slavic 1%
Political lean MEDSL · Camden
- 2024 margin
- Solid R (+54.3) · D 22.4% · R 76.7%
- 2008→2024 swing
- -25.8pp toward R · 2008: -28.5pp · 2024: -54.3pp
- All cycles
- 2024: R+54.3 2020: R+53.2 2016: R+54.2 2012: R+39.3 2008: R+28.5
Not yet ingested
- Civics
- —
Market trends
- HPI YoY
- ▼ -90.71%
- Current HPI
- 185.4254
- Rent YoY
- —
- Metro
- nan
- State GDP YoY
- ▲ 1.84%
- F500 in state
- 20
Industry mix (Fortune 500 HQ in MO)
| Industry | F500 HQs | Revenue |
|---|---|---|
| Healthcare | 1 | $163B |
|
||
| Insurance | 1 | $21B |
|
||
| Industrial Technology | 1 | $17B |
|
||
| Retail | 1 | $16B |
|
||
| Industrial Distribution | 1 | $10B |
|
||
| Utilities | 1 | $9B |
|
||
Price history
+67.9% since first listed11 events — show timeline
- 2026-03-22 Listed $198,000 LOBR
- 2021-03-03 Sold (Public Records) — Public Records
- 2021-03-02 Sold (MLS) — LOBR
- 2020-12-01 Listed $140,000 LOBR
- 2018-01-26 Sold (MLS) — LOBR
- 2017-08-31 Listed $70,000 LOBR
- 2016-10-23 Listed $99,900 LOBR
- 2014-11-05 Listed $105,000 LOBR
- 2014-06-07 Listed $117,900 LOBR
- 2013-09-09 Listed $117,900 LOBR
- 1983-01-01 Sold (Public Records) — Public Records
Property tax history
+0.6%/yrLatest (2025): $956 · +3.4% YoY. Source: county tax records.
Cash-flow waterfall
monthlySold comps — $/sqft
last 12 mo · ≤1 miLoading sold comps…