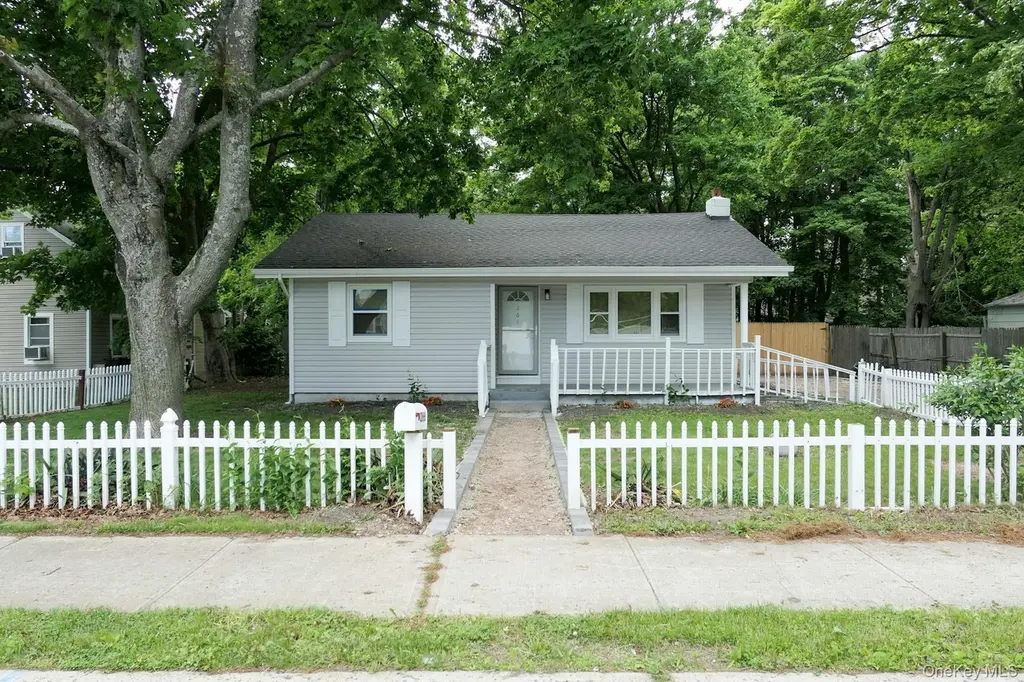
308 Station Rd · North Bellport, NY
Flood risk 1/10 · Minimal
- FEMA flood zone
- X (unshaded)
- Chance of flooding over 30 yrs
- 0.0%
- Est. flood insurance / yr
- $507 – $1,088
Fire risk 1/10 · Minimal
- Est. fire insurance / yr
- $691 – $1,283
Heat risk 4/10 · Minor
- Hot days now (above 92°F)
- 7 days/yr
- Hot days in 30 yrs
- 17 days/yr
Wind risk 8/10 · Major
- Chance of severe wind over 30 yrs
- 80.0%
Air-quality risk 4/10 · Minor
- Unhealthy air days now
- 3 days/yr
- Unhealthy air days in 30 yrs
- 5 days/yr
Risk factors via First Street. Map © Google.
Why this score? — see what drove the B+ grade
The composite is a weighted blend of 9 inputs, each scored 0–100. Each bar is that input's sub-score; the figure is the points it added to the 100-point composite (weight × sub-score).
- Cash flow +30.0/30.0
- ARV discount +15.0/15.0
- 1% rule +10.0/10.0
- DSCR +10.0/10.0
- Schools +4.5/10.0
- Livability +3.1/5.0
- Rent growth +2.5/5.0
- Condition / age +2.5/5.0
- Appreciation +0.0/10.0
$549,900
🖨 Deal sheet 📄 Offer letter ✓ Due diligence
Listing remarks
Newly renovated home near the heart of historic Bellport Village! Come see this completely updated, open concept, 3 bedroom, 2 bathroom home. This home boasts stylish finishes and newly updated conveniences such as new appliances, new floors, and new bathrooms. Outside details include a new driveway, new walkway leading to a front porch, a private backyard for relaxing and entertaining, and a detached garage. Endless possibilities for you to style and make your own!
Key facts
- 2,614 sq ft lot
- Garage
- Built 1920
Property features AI
Exterior
- Parking: Driveway; 1-car garage (attached/has garage)
- Utilities: Cesspool sewer; Cable available; Electricity connected
- Home design: Single family residence
- Construction: Frame construction
- Exterior features: Frame construction; Not waterfront; No additional parcels
Interior
- Kitchen: Dishwasher; Electric range; Microwave; Refrigerator
- Bedrooms: Bedroom on the first floor
- Bathrooms: 2 full bathrooms
- Heating & cooling: Electric heating; No central cooling
- Interior features: First-floor bedroom; First-floor full bathroom; Open floorplan; Open kitchen; Full basement; Partial attic; Total of 5 rooms
- Laundry & utility: Washer; Dryer
Neighborhood map
What this means for you Summary
Snapshot
- This is a 3-bed/2.0-bath single-family listed at $550k.
Deal economics
- At list price, monthly cash flow is $10k ($120k/yr) — positive.
- The deal already cash-flows at list — no discount required.
- Meets the 1% rule at list price ($18k rent vs $550k).
- Cap rate 28.2% vs local median 4.9% in North Bellport — top-decile yield for the area; either an underpriced asset or a hidden risk that comps aren't pricing in. Stress-test before assuming the spread holds.
Location & tenants
- Location reads 62/100 on livability (#842 in NY) — a middle-class / working-renter tenant base. Strengths: employment A+, housing A+; Watch: crime C-, amenities F, commute F.
- South Country Central School District (suburban): math 50% / reading 44% proficiency, ranked #460 of 755 in NY (top 61%) — families likely to look elsewhere, expect single-tenant / working-renter base with shorter leases.
- Zoned schools: Kreamer Street Elementary School (math 24% / reading 24%, grade F, #1,846 of 2,108 statewide, top 91%, 290 students, 37% FRL); Bellport Middle School (math 64% / reading 54%, grade B, #161 of 729 statewide, top 24%, 838 students, 56% FRL); Bellport Senior High School (math 86% / reading 64%, grade A-, #630 of 1,100 statewide, top 57%, 1,392 students, 52% FRL).
- Market conditions: 57 active listings in the ZIP; 5 comparable units currently listed for rent nearby; rentals at typical pace (median 19d on market — plan ~3-4 weeks tenant-placement turnaround); 1,366 units permitted in Suffolk County in 2024 (216 in 5+ unit buildings).
Forward outlook
- Local home prices are declining (-3.0%/yr); year-one equity from $4k of loan paydown is wiped out by about $16k of value loss. Plan a longer hold.
- Suffolk County population projected to shrink 5% by 2050 — rents likely to lag national; underwrite the cash flow, not the appreciation.
- At projected returns (-3.0% appreciation + 3.0% rent growth), your $154k cash investment doubles in ~2 years — after that, you're playing with house money.
Negotiation context
- Only 1 days on market — expect competitive offers; lowballing is unlikely to land.
- Current owner paid $78k; list at $550k implies a 605% gain — meaningful room to come down on a strong offer.
Risks & watch-outs
- Watch-outs: built in 1920 — expect roof / HVAC / electrical / plumbing capex.
- Climate carrying-cost: severe wind risk, 80% chance of damaging wind over 30y — expect insurance premiums to compound above CPI over the hold.
Questions for the listing agent
- Built in 1920 — when were the roof, HVAC, electrical panel, plumbing, and water heater last replaced?
- Is there a deadline driving the sale (1031 exchange, divorce, estate, relocation)? That informs how much negotiation room exists.
- Schools are F-rated, which usually means shorter tenancies and higher turnover. Who's the typical renter profile here, and what's been the actual vacancy rate?
- What's the average days-on-market for RENTAL listings here right now (not sales)? A rising rental-DOM trend means longer vacancies and softer asking-rent achievability than the comps imply.
- What's the recent tenant-quality profile in this submarket — average credit score on applications, eviction rate, late-payment / NSF rate, and stable-employment percentage? A property-management company in the area should have these aggregated.
- How much new for-sale + rental construction is in the pipeline within 1–3 miles? Heavy new supply typically softens prices + rents 12–24 months out; constrained supply supports both.
Investment metrics
- 1% rule
- 3.21% ✓
- Cap rate
- 28.18%
- Cash-on-cash
- 78.18%
- DSCR
- 4.48
- GRM
- 2.6
CMA / ARV
- ARV (on-the-fly)
- $773,070
- Comps found
- 4
Show comp detail 4 sales within ~0.75 mi
| Address | Dist | Beds/Ba | Sqft | Sold | Price | $/sf | Match |
|---|---|---|---|---|---|---|---|
| 19 Maplewood Dr | 0.37mi | 4/2.5 (+1) | 2,200 (+0%) | 12mo | $995,000 | $452 | 65 |
| 75 Head Of The Neck Rd | 0.51mi | 4/2.5 (+1) | 2,200 (+0%) | 6mo | $700,000 | $318 | 63 |
| 96 N Howells Point Rd | 0.35mi | 4/2.0 (+1) | 1,872 (-14%) | 8mo | $660,000 | $353 | 48 |
| 72 Wards Ln | 0.29mi | 3/1.0 | 1,862 (-15%) | 12mo | $469,000 | $252 | 47 |
Match score weights: distance 35% · size 25% · config 20% · recency 20%. Top-matched comps best support the ARV.
Projected returns pro-forma
-3.0% appreciation · 3.0% rent growth · sell at horizon
- IRR
- 78.3%
- Equity multiple
- 4.57×
- Total profit
- $550,169
- Equity at exit
- $81,992
- IRR
- 81.8%
- Equity multiple
- 9.46×
- Total profit
- $1,303,194
- Equity at exit
- $47,545
Cash invested: $153,972 (down + closing). Projections, not guarantees.
Landlord ↔ Tenant lean methodology
- Overall (STATE)
- 15 Strongly Tenant-Friendly
- State New York
- 15 Strongly Tenant-Friendly · D+10
- County
- — inherits STATE
- City
- — inherits STATE
ZIP-level market 11713
- Home prices YoY
- -26.0%
- Active inventory
- 57
- Price-to-rent
- 2.6×
Monthly cashflow live
- Estimated rent
- $17,663 medium interval (Pro) →
- Mortgage (P&I)
- −$2,884
- Tax from tax record
- −$809 /mo · $9,704/yr
- Insurance
- −$229
- HOA
- −$0
- Vacancy / Maint / Mgmt
- −$3,709
- Net cashflow
- $10,032
Break-even live
UW: 25.0% down · 7.5% · 30yr · 1.5% tax · 5.0% vac · 8.0% maint · 8.0% mgmt
Financing live
Cash to close
- Down payment
- $137,475
- Closing costs
- $16,497
- Reserves months
- —
- Total cash needed
- —
Loan-product check · same deal, 3 products live
Conventional
25% down · 7.5% · 30yr
- Down + closing
- —
- Monthly P&I
- —
- Monthly cashflow
- —
- DSCR
- —
- Eligible?
- —
Personal DTI + credit; lowest rate.
DSCR
20% down · 8.5% · 30yr
- Down + closing
- —
- Monthly P&I
- —
- Monthly cashflow
- —
- DSCR
- —
- Eligible?
- —
No personal income docs; deal must DSCR.
Hard money
10% down · 12.0% · 12mo
- Down + closing
- —
- Monthly P&I
- —
- Monthly cashflow
- —
- DSCR
- —
- Eligible?
- —
Short-term bridge; refi at stabilization.
Rent comps 5 comps
| Address | Beds | Baths | Sqft | Rent | $/sqft | DOM | Units | Dist |
|---|---|---|---|---|---|---|---|---|
| 58 N Howells Point Rd Bellport, NY | 3.0 | 2.0 | 1404 | $15,000 | $10.68 | 19d | 1 | 0.55mi |
| 21 N Howells Point Rd Bellport, NY | 3.0 | 3.5 | 2148 | $20,000 | $9.31 | 1d | 1 | 0.76mi |
| 13 Colonial Ln Bellport, NY | 3.0 | 2.0 | 1872 | $20,000 | $10.68 | 19d | 1 | 0.89mi |
| 11 Bieselin Rd Bellport, NY | 4.0 | 2.0 | 1722 | $15,000 | $8.71 | 43d | 1 | 0.97mi |
| 262 N Dunton Ave East Patchogue, NY | 3.0 | 1.0 | 1778 | $3,900 | $2.19 | 13d | 1 | 1.21mi |
Listing history 2 events
-
2026-06-01remarks 471-char remark
-
2026-06-01$549,900 Coming Soon 1 DOM
ⓘ Source: listings_history table (triggers on properties + properties_extension) + one-shot
backfill from property_details.listing_events for pre-trigger history.
Tax reassessment forecast NY · Partial reset (capped growth)
- Current annual tax
- $9,704 · $809/mo
- Projected year-2 tax
- $9,704 · $809/mo
- Expected delta
- $0/yr ($0/mo · 0.0%)
ⓘ Screening estimate from a state-policy table — verify with the county assessor before closing.
Climate risk First Street
- Flood 1/10 Low FEMA zone X (unshaded) · 0% chance over 30 yrs
- Wildfire 1/10 Low
- Heat 4/10 Moderate 7 d/yr ≥92°F today · 17 d/yr by 30 yrs out
- Wind 8/10 Severe 80% chance of damaging wind over 30 yrs
- Air quality 4/10 Moderate 3 unhealthy d/yr today · 5 by 30 yrs out
Nearby sold comps map
Loading sold comps map…
Walkable amenities ~0.75 mi
Loading nearby amenities…
Taxation est. · year 1
- Rental income
- $211,950
- − Mortgage interest
- −$30,803
- − Property taxes
- −$9,704
- − Insurance
- −$2,750
- − Repairs & maintenance
- −$16,956
- − Management
- −$16,956
- − Depreciation
- −$15,997
- Taxable income
- $118,785
- Est. tax owed @ 24.0%
- −$28,508
- After-tax cash flow
- $91,874/yr
For passive investors: Depreciation is non-cash, so a rental often shows a tax loss while cash-flowing — sheltering income. Rental losses are passive: they offset passive income freely, and up to $25,000/yr can offset ordinary (W-2) income if you actively participate and your MAGI is under $100k (phasing out to $0 by $150k); unused losses carry forward. On sale, claimed depreciation is recaptured at up to 25%, and gains may owe capital-gains tax (a 1031 exchange can defer both). Figures are a year-1 estimate at your 24.0% rate — not tax advice; consult a CPA.
Schools (NCES district)
- District
- South Country Central School District
- NCES district ID
- 3600008
- Math proficiency
- 50% ▲ 4.00%
- Reading proficiency
- 44% ▲ 4.00%
- Median HH income
- $74,049
- Composite
- 44.75/100
- National rank
- #5960
- State rank
- #460 of 755 in NY
Livability — North Bellport
- Score
- 62/100
- State rank
- #842
- US rank
- #16345
Category grades
Schools grade is shown separately in the Schools card above.
Census & demographics
- Census place
- North Bellport, NY
- City population
- 9,236
- Population (ZIP)
- 9,236
Population outlook (Suffolk County) Hauer SSP2
- Today (2025)
- 1,505,262 people
- By 2030
- 1,498,318 · -0.5%
- By 2040
- 1,471,101 · -2.3%
- By 2050
- 1,424,848 · -5.3%
- By 2075
- 1,337,157 · -11.2%
- By 2100
- 1,217,720 · -19.1%
Race, ethnicity, and origin ACS 2023
- Neighborhood character
- Diverse neighborhood (Simpson 0.64)
- Race & ethnicity
- White 50% Hispanic / Latino 30% Black 14% Two or more races 10% Asian 2%
- Hispanic origin (detail)
- Mexican 2% Puerto Rican 3% Dominican 1%
- Common ancestry
- Romanian 4% Italian 1% Lithuanian 1%
- Foreign-born
- 23% · Canada, Jamaica, China
- Languages at home
- 72% English-only · Spanish 23% Other Indo-European 3%
Political lean MEDSL · Suffolk
- 2024 margin
- Lean R (+10.0) · D 45.0% · R 55.0%
- 2008→2024 swing
- -16.0pp toward R · 2008: 6.0pp · 2024: -10.0pp
- All cycles
- 2024: R+10.0 2020: R+0.0 2016: R+8.2 2012: D+2.9 2008: D+6.0
Not yet ingested
- Civics
- —
Market trends
- HPI YoY
- ▼ -148.23%
- Current HPI
- 421.2165
- Rent YoY
- —
- Metro
- —
- State GDP YoY
- ▲ 2.60%
- F500 in state
- 92
Industry mix (Fortune 500 HQ in NY)
| Industry | F500 HQs | Revenue |
|---|---|---|
| Financial Services | 10 | $950B |
|
||
| Consumer Goods | 9 | $162B |
|
||
| Insurance | 4 | $225B |
|
||
| Telecommunications | 2 | $144B |
|
||
| Pharmaceuticals | 2 | $112B |
|
||
| Media / Entertainment | 2 | $69B |
|
||
Price history
+605.0% since first listed2 events — show timeline
- 2026-05-31 Coming Soon $549,900 OneKey® MLS as Distributed by MLS Grid
- 1988-05-25 Sold (Public Records) $78,000 Public Records
Property tax history
+3.5%/yrLatest (2025): $9,704 · +0.0% YoY. Source: county tax records.
Cash-flow waterfall
monthlySold comps — $/sqft
last 12 mo · ≤1 miLoading sold comps…