208 Burkett St · Benton, IL
Flood risk 1/10 · Minimal
- FEMA flood zone
- X (unshaded)
- Chance of flooding over 30 yrs
- 0.0%
- Est. flood insurance / yr
- $473 – $860
Fire risk 1/10 · Minimal
- Est. fire insurance / yr
- $804 – $1,492
Heat risk 5/10 · Moderate
- Hot days now (above 107°F)
- 7 days/yr
- Hot days in 30 yrs
- 20 days/yr
Wind risk 2/10 · Minimal
- Chance of severe wind over 30 yrs
- 2.0%
Air-quality risk 2/10 · Minimal
- Unhealthy air days now
- 0 days/yr
- Unhealthy air days in 30 yrs
- 2 days/yr
Risk factors via First Street. Map © Google.
Why this score? — see what drove the C+ grade
The composite is a weighted blend of 9 inputs, each scored 0–100. Each bar is that input's sub-score; the figure is the points it added to the 100-point composite (weight × sub-score).
- Cash flow +26.7/30.0
- DSCR +9.2/10.0
- ARV discount +7.7/15.0
- 1% rule +6.3/10.0
- Livability +3.2/5.0
- Rent growth +2.5/5.0
- Condition / age +2.5/5.0
- Schools +2.0/10.0
- Appreciation +0.0/10.0
$90,000
🖨 Deal sheet 📄 Offer letter ✓ Due diligence
Listing remarks MLS
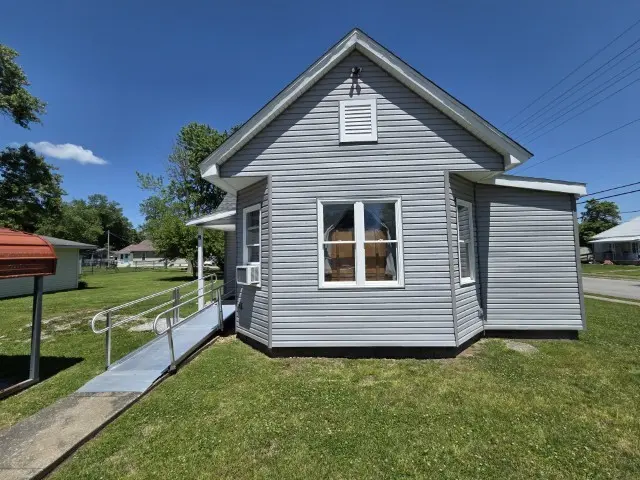
Completely remodeled and freshly painted interior. A move-in ready home you will love. Ramped main entry is easily assessable, small yard to enjoy but less to maintain, gas furnace , central air, cedar lined large closets. All appliances included in extra large country kitchen. Carport and storage shed. walking distance to down town and grocery store. Many conveniences which make for easy living.
Key facts
- Complete updates
- Upgraded siding
- Upgraded electrical
Tags
Property features AI
Finance
- Other: Parcel number 0818406009
- HOA & community: No master association fee
Exterior
- Parking: Gravel parking for 3 vehicles
- Utilities: Public water; Public sewer; Cable available
- Home design: Detached single-family home; One-story; Estimated living area; Fee simple ownership; Built over 100 years ago; Home built before 1978
- Construction: Vinyl siding; Asphalt roof; Block foundation
- Exterior features: Porch; Fire pit; Corner lot
Interior
- Kitchen: Range; Microwave; Refrigerator; Disposal; Eating area with table space; Pantry/Butler pantry
- Bedrooms: 2 bedrooms (both on the main level)
- Flooring: Carpet in bedrooms and some areas; Luxury vinyl in kitchen and living room
- Bathrooms: 1 full bathroom with accessible shower, no tub
- Heating & cooling: Natural gas heating; Forced air; Solar heating; Window cooling unit(s)
- Interior features: First-floor bedroom; First-floor full bathroom; Disability access
- Laundry & utility: Main-level laundry; Washer and dryer included; Electric dryer hookup; Laundry located in kitchen
Neighborhood map
What this means for you Summary
Snapshot
- This is a 2-bed/1.0-bath single-family listed at $90k.
Deal economics
- At list price, monthly cash flow is $245 ($3k/yr) — positive.
- The deal already cash-flows at list — no discount required.
- Meets the 1% rule at list price ($1k rent vs $90k).
- Recommended offer: $87k (3.0% below list) — sets the bar for market timing.
- Cap rate 9.6% vs local median 5.3% in Benton — top-decile yield for the area; either an underpriced asset or a hidden risk that comps aren't pricing in. Stress-test before assuming the spread holds.
Location & tenants
- Location reads 63/100 on livability (#785 in IL) — a middle-class / working-renter tenant base. Strengths: cost of living A+, housing A+, health & safety A+; Watch: amenities F, commute F, employment D-.
- BentonConsolidatedHsd 103 (town): math 20% / reading 20% proficiency, ranked #727 of 919 in IL (top 79%) — low school quality limits family demand, transient renter base, plan for 1-2y turnover.
- Zoned schools: Benton Cons High School (math 17% / reading 27%, grade F, #319 of 693 statewide, top 50%, 577 students, 0% FRL).
- Market conditions: 73 active listings in the ZIP; 17 units permitted in Franklin County in 2024 (0 in 5+ unit buildings).
Forward outlook
- Local home prices are declining (-3.0%/yr); year-one equity from $622 of loan paydown is wiped out by about $3k of value loss. Plan a longer hold.
- Franklin County population projected at -16% by 2050 — secular population decline; favor cash flow + early exit over multi-decade hold.
- At projected returns (-3.0% appreciation + 3.0% rent growth), your $25k cash investment doubles in ~10 years — after that, you're playing with house money.
Negotiation context
- It's been on market 34 days — a 3% lower offer ($87k) is reasonable based on typical stale-listing flexibility.
- 4 sale attempts since 5y ago; this cycle's ask has dropped $6k (6%) from the opening price — seller is motivated, your offer sets the floor, not the list.
- Current owner paid $44k; list at $90k implies a 105% gain — meaningful room to come down on a strong offer.
Risks & watch-outs
- Watch-outs: built in 1900 — expect roof / HVAC / electrical / plumbing capex.
- Climate carrying-cost: extreme-heat days projected 7→20/yr by 2055 (HVAC capex compounding) — expect insurance premiums to compound above CPI over the hold.
Questions for the listing agent
- It's been on market 34 days. Have you received any prior offers? Is the seller open to a 3% concession, seller financing, or rate buy-down credit?
- Built in 1900 — when were the roof, HVAC, electrical panel, plumbing, and water heater last replaced?
- Is there a deadline driving the sale (1031 exchange, divorce, estate, relocation)? That informs how much negotiation room exists.
- Schools are F-rated, which usually means shorter tenancies and higher turnover. Who's the typical renter profile here, and what's been the actual vacancy rate?
- What's the average days-on-market for RENTAL listings here right now (not sales)? A rising rental-DOM trend means longer vacancies and softer asking-rent achievability than the comps imply.
- What's the recent tenant-quality profile in this submarket — average credit score on applications, eviction rate, late-payment / NSF rate, and stable-employment percentage? A property-management company in the area should have these aggregated.
- How much new for-sale + rental construction is in the pipeline within 1–3 miles? Heavy new supply typically softens prices + rents 12–24 months out; constrained supply supports both.
Investment metrics
- 1% rule
- 1.13% ✓
- Cap rate
- 9.56%
- Cash-on-cash
- 11.66%
- DSCR
- 1.52
- GRM
- 7.4
CMA / ARV
- ARV (on-the-fly)
- $90,475
- Comps found
- 12
Show comp detail 12 sales within ~0.75 mi
| Address | Dist | Beds/Ba | Sqft | Sold | Price | $/sf | Match |
|---|---|---|---|---|---|---|---|
| 635 N Buchanan St | 0.28mi | 2/1.0 | 1,152 (-2%) | 8mo | $89,000 | $77 | 77 |
| 635 N Buchanan St | 0.28mi | 2/1.0 | 1,152 (-2%) | 8mo | $89,000 | $77 | 77 |
| 510 Madison St | 0.10mi | 3/2.0 (+1) | 1,232 (+5%) | 7mo | $117,000 | $95 | 72 |
| 205 E Smith | 0.07mi | 2/1.0 | 1,000 (-15%) | 4mo | $54,900 | $55 | 68 |
| 615 Mitchell St | 0.59mi | 3/1.0 (+1) | 1,200 (+2%) | 2mo | $52,500 | $44 | 63 |
| 305 5th St W | 0.30mi | 3/1.5 (+1) | 1,300 (+11%) | 1mo | $146,000 | $112 | 60 |
| 115 Mccann St | 0.32mi | 3/1.5 (+1) | 1,040 (-12%) | 2mo | $59,000 | $57 | 57 |
| 406 N 10th St | 0.70mi | 2/2.0 | 1,200 (+2%) | 8mo | $63,000 | $53 | 54 |
| 302 S Duquoin St | 0.71mi | 3/1.0 (+1) | 1,100 (-6%) | 0mo | $134,900 | $123 | 51 |
| 209 N Duquoin St | 0.63mi | 3/1.0 (+1) | 1,296 (+10%) | 5mo | $17,500 | $14 | 44 |
| 422 W 5th St | 0.47mi | 3/2.0 (+1) | 1,345 (+14%) | 2mo | $67,000 | $50 | 43 |
| 717 E Main St | 0.62mi | 3/2.0 (+1) | 1,300 (+11%) | 7mo | $144,000 | $111 | 39 |
Match score weights: distance 35% · size 25% · config 20% · recency 20%. Top-matched comps best support the ARV.
Projected returns pro-forma
-3.0% appreciation · 3.0% rent growth · sell at horizon
- IRR
- 1.0%
- Equity multiple
- 1.04×
- Total profit
- $984
- Equity at exit
- $13,419
- IRR
- 10.6%
- Equity multiple
- 1.83×
- Total profit
- $20,840
- Equity at exit
- $7,782
Cash invested: $25,200 (down + closing). Projections, not guarantees.
Landlord ↔ Tenant lean methodology
- Overall (STATE)
- 43 Moderately Tenant-Leaning
- State Illinois
- 43 Moderately Tenant-Leaning · D+7
- County
- — inherits STATE
- City
- — inherits STATE
ZIP-level market 62812
- Active inventory
- 73
- Price-to-rent
- 7.4×
Monthly cashflow live
- Estimated rent
- $1,019 medium interval (Pro) →
- Mortgage (P&I)
- −$472
- Tax from tax record
- −$51 /mo · $608/yr
- Insurance
- −$38
- HOA
- −$0
- Vacancy / Maint / Mgmt
- −$214
- Net cashflow
- $245
Break-even live
UW: 25.0% down · 7.5% · 30yr · 1.5% tax · 5.0% vac · 8.0% maint · 8.0% mgmt
Financing live
Cash to close
- Down payment
- $22,500
- Closing costs
- $2,700
- Reserves months
- —
- Total cash needed
- —
Loan-product check · same deal, 3 products live
Conventional
25% down · 7.5% · 30yr
- Down + closing
- —
- Monthly P&I
- —
- Monthly cashflow
- —
- DSCR
- —
- Eligible?
- —
Personal DTI + credit; lowest rate.
DSCR
20% down · 8.5% · 30yr
- Down + closing
- —
- Monthly P&I
- —
- Monthly cashflow
- —
- DSCR
- —
- Eligible?
- —
No personal income docs; deal must DSCR.
Hard money
10% down · 12.0% · 12mo
- Down + closing
- —
- Monthly P&I
- —
- Monthly cashflow
- —
- DSCR
- —
- Eligible?
- —
Short-term bridge; refi at stabilization.
Listing history 21 events
-
2026-06-12statusdays on market $90,000 Pending 34 DOM
-
2026-06-09days on market $90,000 Contingent - Continue to Show 32 DOM
-
2026-06-08days on market $90,000 Contingent - Continue to Show 31 DOM
-
2026-06-07days on market $90,000 Contingent - Continue to Show 30 DOM
-
2026-06-07days on market $90,000 Contingent - Continue to Show 29 DOM
-
2026-06-04days on market $90,000 Contingent - Continue to Show 26 DOM
-
2026-06-02days on market $90,000 Contingent - Continue to Show 25 DOM
-
2026-06-01status $90,000 Contingent - Continue to Show 24 DOM
-
2026-06-01days on market $90,000 Active 24 DOM
-
2026-05-31days on market $90,000 Active 23 DOM
-
2026-05-31days on market $90,000 Active 22 DOM
-
2026-05-08$96,000 Active
-
2026-02-04historical
-
2026-01-20price
-
2026-01-19Active
-
2021-11-04soldstatus $44,000 401-char remark
Show marketing remark (401 chars)
Completely remodeled and freshly painted interior. A move-in ready home you will love. Ramped main entry is easily assessable, small yard to enjoy but less to maintain, gas furnace , central air, cedar lined large closets. All appliances included in extra large country kitchen. Carport and storage shed. walking distance to down town and grocery store. Many conveniences which make for easy living.
-
2021-08-18$47,900 401-char remark
Show marketing remark (401 chars)
Completely remodeled and freshly painted interior. A move-in ready home you will love. Ramped main entry is easily assessable, small yard to enjoy but less to maintain, gas furnace , central air, cedar lined large closets. All appliances included in extra large country kitchen. Carport and storage shed. walking distance to down town and grocery store. Many conveniences which make for easy living.
-
2021-08-16historical
-
2021-08-15historical
ⓘ Source: listings_history table (triggers on properties + properties_extension) + one-shot
backfill from property_details.listing_events for pre-trigger history.
Tax reassessment forecast IL · Partial reset (capped growth)
- Current annual tax
- $608 · $51/mo
- Projected year-2 tax
- $1,325 · $110/mo
- Expected delta
- +$718/yr (+$60/mo · 118.0%)
ⓘ Screening estimate from a state-policy table — verify with the county assessor before closing.
Climate risk First Street
- Flood 1/10 Low FEMA zone X (unshaded) · 0% chance over 30 yrs
- Wildfire 1/10 Low
- Heat 5/10 Major 7 d/yr ≥107°F today · 20 d/yr by 30 yrs out
- Wind 2/10 Low 2% chance of damaging wind over 30 yrs
- Air quality 2/10 Low 0 unhealthy d/yr today · 2 by 30 yrs out
Nearby sold comps map
Loading sold comps map…
Walkable amenities ~0.75 mi
Loading nearby amenities…
Taxation est. · year 1
- Rental income
- $12,226
- − Mortgage interest
- −$5,041
- − Property taxes
- −$608
- − Insurance
- −$450
- − Repairs & maintenance
- −$978
- − Management
- −$978
- − Depreciation
- −$2,618
- Taxable income
- $1,553
- Est. tax owed @ 24.0%
- −$373
- After-tax cash flow
- $2,565/yr
For passive investors: Depreciation is non-cash, so a rental often shows a tax loss while cash-flowing — sheltering income. Rental losses are passive: they offset passive income freely, and up to $25,000/yr can offset ordinary (W-2) income if you actively participate and your MAGI is under $100k (phasing out to $0 by $150k); unused losses carry forward. On sale, claimed depreciation is recaptured at up to 25%, and gains may owe capital-gains tax (a 1031 exchange can defer both). Figures are a year-1 estimate at your 24.0% rate — not tax advice; consult a CPA.
Schools (NCES district)
- District
- BentonConsolidatedHsd 103
- NCES district ID
- 1705970
- Math proficiency
- 20% ▬ 0.00%
- Reading proficiency
- 20% ▬ 0.00%
- Median HH income
- $35,473
- Composite
- 19.77/100
- National rank
- #13902
- State rank
- #727 of 919 in IL
Livability — Benton
- Score
- 63/100
- State rank
- #785
- US rank
- #15667
Category grades
Schools grade is shown separately in the Schools card above.
Census & demographics
- Census place
- Benton, IL
- City population
- 11,441
- Population (ZIP)
- 11,441
Population outlook (Franklin County) Hauer SSP2
- Today (2025)
- 37,954 people
- By 2030
- 36,828 · -3.0%
- By 2040
- 34,452 · -9.2%
- By 2050
- 31,855 · -16.1%
- By 2075
- 25,171 · -33.7%
- By 2100
- 18,462 · -51.4%
Race, ethnicity, and origin ACS 2023
- Neighborhood character
- Predominantly White (92%)
- Race & ethnicity
- White 92% Two or more races 6% Hispanic / Latino 3%
- Common ancestry
- Slovak 2% Romanian 2% Lithuanian 1%
- Foreign-born
- 1% · Vietnam, Canada
- Languages at home
- 96% English-only · Spanish 2% Other Indo-European 1% Vietnamese 1%
Political lean MEDSL · Franklin
- 2024 margin
- Solid R (+50.6) · D 24.1% · R 74.6% · Other 1.3%
- 2008→2024 swing
- -47.8pp toward R · 2008: -2.8pp · 2024: -50.6pp
- All cycles
- 2024: R+50.6 2020: R+47.5 2016: R+45.3 2012: R+16.8 2008: R+2.8
Not yet ingested
- Civics
- —
Market trends
- HPI YoY
- ▼ -87.17%
- Current HPI
- 109.0501
- Rent YoY
- —
- Metro
- —
- State GDP YoY
- ▲ 1.59%
- F500 in state
- 60
Industry mix (Fortune 500 HQ in IL)
| Industry | F500 HQs | Revenue |
|---|---|---|
| Insurance | 4 | $201B |
|
||
| Consumer Goods | 4 | $87B |
|
||
| Industrial Machinery | 3 | $64B |
|
||
| Healthcare | 2 | $55B |
|
||
| Retail / Pharmacy | 1 | $148B |
|
||
| Agriculture / Food | 1 | $86B |
|
||
Price history
+100.4% since first listed10 events — show timeline
- 2026-05-08 Listed $96,000 MRED as Distributed by MLS Grid
- 2026-02-04 Listing Removed — MRED as Distributed by MLS Grid
- 2026-01-20 Price Changed — MRED as Distributed by MLS Grid
- 2026-01-19 Listed — MRED as Distributed by MLS Grid
- 2021-11-04 Sold (MLS) $44,000 MRED as Distributed by MLS Grid
- 2021-11-04 Sold (MLS) $44,000 RMLSA as Distributed by MLS Grid
- 2021-08-18 Listed $47,900 MRED as Distributed by MLS Grid
- 2021-08-18 Listed $47,900 RMLSA as Distributed by MLS Grid
- 2021-08-16 Listing Removed — RMLSA as Distributed by MLS Grid
- 2021-08-15 Listing Removed — MRED as Distributed by MLS Grid
Property tax history
-5.7%/yrLatest (2024): $608 · +44.2% YoY. Source: county tax records.
Cash-flow waterfall
monthlySold comps — $/sqft
last 12 mo · ≤1 miLoading sold comps…