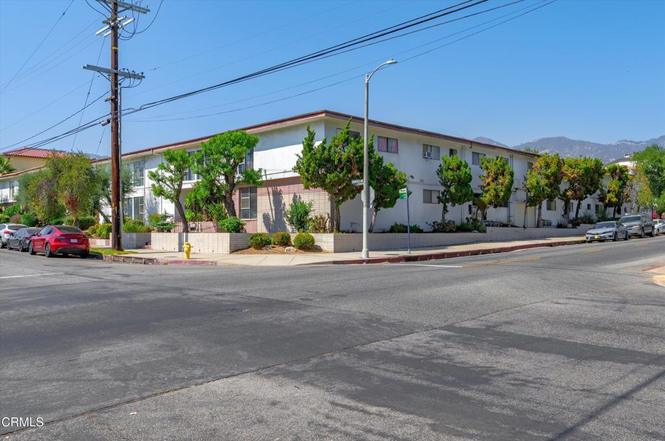
13040 Dronfield Ave #3 · Los Angeles, CA
Flood risk 1/10 · Minimal
- FEMA flood zone
- X (unshaded)
- Chance of flooding over 30 yrs
- 0.0%
- Est. flood insurance / yr
- $507 – $1,088
Fire risk 2/10 · Minimal
- Est. fire insurance / yr
- $659 – $1,223
Heat risk 6/10 · Moderate
- Hot days now (above 100°F)
- 8 days/yr
- Hot days in 30 yrs
- 23 days/yr
Wind risk 1/10 · Minimal
- Chance of severe wind over 30 yrs
- —
Air-quality risk 7/10 · Major
- Unhealthy air days now
- 13 days/yr
- Unhealthy air days in 30 yrs
- 16 days/yr
Risk factors via First Street. Map © Google.
Why this score? — see what drove the D grade
The composite is a weighted blend of 9 inputs, each scored 0–100. Each bar is that input's sub-score; the figure is the points it added to the 100-point composite (weight × sub-score).
- Cash flow +14.2/30.0
- ARV discount +7.5/15.0
- 1% rule +5.6/10.0
- DSCR +4.3/10.0
- Schools +3.6/10.0
- Livability +3.4/5.0
- Rent growth +2.5/5.0
- Condition / age +2.5/5.0
- Appreciation +0.0/10.0
$185,000
🖨 Deal sheet (PDF) 📄 Offer letter ✓ Due diligence
Listing remarks
Amazing opportunity at an affordable price. Based on comparable sales and rent this condo can generate 7.86% cap rate for investors. This condo is located across the street from Sylmar Elementary, Sylmar High School and within walking distance of Foothill Blvd.
Key facts
- $356 HOA
- Built 1964
- Listed 2 days
Property features AI
Finance
- HOA & community: Part of an association (Skyview Homes); Association fee $356 monthly; Onsite property management; Community features include curbs
Exterior
- Parking: Has parking
- Utilities: Public sewer; District/public water
- Home design: Multi-family attached property
- Construction: Year built per public records
- Exterior features: Condominium with one common wall; Fence present; Sprinklers: none; Lot details per public records
Interior
- Kitchen: Includes appliances
- Bathrooms: 1 full bathroom
- Heating & cooling: Heating included; Cooling included
- Interior features: One-level layout; Family room
- Laundry & utility: Community laundry
Neighborhood map
What this means for you Summary
Snapshot
- This is a 1-bed/1.0-bath condo listed at $185k.
Deal economics
- At list price, monthly cash flow is $31 ($376/yr) — positive.
- The deal already cash-flows at list — no discount required.
- Meets the 1% rule at list price ($2k rent vs $185k).
- Cap rate 6.5% vs local median 2.1% in Los Angeles — top-decile yield for the area; either an underpriced asset or a hidden risk that comps aren't pricing in. Stress-test before assuming the spread holds.
Location & tenants
- Location reads 68/100 on livability (#273 in CA) — a middle-class / working-renter tenant base. Strengths: amenities A+, commute A+, employment B; Watch: health & safety C-, crime F, cost of living F.
- Los Angeles Unified (urban): math 29% / reading 54% proficiency, ranked #223 of 517 in CA (top 43%) — families likely to look elsewhere, expect single-tenant / working-renter base with shorter leases; 67% free/reduced lunch — lower-income household profile, screen leases tightly.
- Zoned schools: Sylmar Elementary (435 students, 94% FRL); Olive Vista Middle (946 students, 91% FRL); Sylmar Charter High (math 23% / reading 52%, grade F, #576 of 1,170 statewide, top 49%, 1,506 students, 90% FRL, charter) — zoned schools average 92% FRL vs 67% district-wide (24 pts higher); higher-poverty schools than district average — tighter screening recommended.
- Market conditions: Rents flat; 183 active listings in the ZIP; 17 comparable units currently listed for rent nearby; rentals leasing fast (median 10d on market — plan ~1-2 weeks tenant-placement turnaround); solid renter incomes; 19,697 units permitted in Los Angeles County in 2024 (9,426 in 5+ unit buildings).
Forward outlook
- Local home prices are declining (-3.0%/yr); year-one equity from $1k of loan paydown is wiped out by about $6k of value loss. Plan a longer hold.
- Los Angeles County population projected at +9% by 2050 — modest demand growth; plan on rents tracking national, not racing it.
Negotiation context
- Only 3 days on market — expect competitive offers; lowballing is unlikely to land.
- 7 sale attempts since 2y ago with the ask held roughly flat each time — persistent listings suggest the price (not the market) is what's stuck; bring a comps-based counter.
Risks & watch-outs
- Climate carrying-cost: extreme-heat days projected 8→23/yr by 2055 (HVAC capex compounding) — expect insurance premiums to compound above CPI over the hold.
Questions for the listing agent
- Built in 1964 — when were the roof, HVAC, electrical panel, plumbing, and water heater last replaced?
- What does the HOA fee cover, when was the last increase, and are there any pending special assessments or reserve-fund shortfalls?
- Any open or pending special assessments — roof, HVAC, plumbing, elevator, façade? What's the per-unit balance and payoff schedule, and is the seller paying it off at close or rolling it to the buyer?
- Is there a deadline driving the sale (1031 exchange, divorce, estate, relocation)? That informs how much negotiation room exists.
- Schools are D-rated, which usually means shorter tenancies and higher turnover. Who's the typical renter profile here, and what's been the actual vacancy rate?
- Crime grade is F in this area — have there been break-ins, vandalism, or insurance claims at this property in the last 3 years? What carrier currently insures it and at what premium?
- The area grade is low — what's the realistic commute time and amenity access for the typical tenant pool here? Any planned neighborhood developments (good or bad) we should know about?
- What's the average days-on-market for RENTAL listings here right now (not sales)? A rising rental-DOM trend means longer vacancies and softer asking-rent achievability than the comps imply.
- What's the recent tenant-quality profile in this submarket — average credit score on applications, eviction rate, late-payment / NSF rate, and stable-employment percentage? A property-management company in the area should have these aggregated.
- How much new apartment / multifamily construction is in the pipeline within 1–3 miles? Heavy new supply (>2% of stock underway) typically softens rents 12–24 months out; light construction supports rent growth.
Investment metrics
- 1% rule
- 1.06% ✓
- Cap rate
- 6.50%
- Cash-on-cash
- 0.73%
- DSCR
- 1.03
- GRM
- 7.9
CMA / ARV
No comps found within radius.
Projected returns pro-forma
-3.0% appreciation · 0.02% rent growth · sell at horizon
- IRR
- -19.1%
- Equity multiple
- 0.35×
- Total profit
- $-33,498
- Equity at exit
- $27,584
- IRR
- -21.2%
- Equity multiple
- 0.08×
- Total profit
- $-47,895
- Equity at exit
- $15,995
Cash invested: $51,800 (down + closing). Projections, not guarantees.
Landlord ↔ Tenant lean methodology
- Overall (CITY)
- 0 Strongly Tenant-Friendly
- State California
- 18 Strongly Tenant-Friendly · D+13
- County
- — inherits STATE
- City Los Angeles
- 0 Strongly Tenant-Friendly · D+22
ZIP-level market 91342
- Rents YoY
- 0.0%
- Active inventory
- 183
- Price-to-rent
- 7.9×
Monthly cashflow live
- Estimated rent
- $1,954 high interval (Pro) →
- Mortgage (P&I)
- −$970
- Tax from tax record
- −$109 /mo · $1,312/yr
- Insurance
- −$77
- HOA
- −$356
- Vacancy / Maint / Mgmt
- −$410
- Net cashflow
- $31
Break-even live
Sensitivity live
| Price | -10% $136 | -5% $84 | +0% $31 | +5% $-21 | +10% $-73 |
|---|---|---|---|---|---|
| Rent | -10% $-123 | -5% $-46 | +0% $31 | +5% $109 | +10% $186 |
| Rate | -1.0pp $125 | -0.5pp $78 | base $31 | +0.5pp $-17 | +1.0pp $-65 |
UW: 25.0% down · 7.5% · 30yr · 1.5% tax · 5.0% vac · 8.0% maint · 8.0% mgmt
Financing live
Cash to close
- Down payment
- $46,250
- Closing costs
- $5,550
- Reserves months
- —
- Total cash needed
- —
Loan-product check · same deal, 3 products live
Conventional
25% down · 7.5% · 30yr
- Down + closing
- —
- Monthly P&I
- —
- Monthly cashflow
- —
- DSCR
- —
- Eligible?
- —
Personal DTI + credit; lowest rate.
DSCR
20% down · 8.5% · 30yr
- Down + closing
- —
- Monthly P&I
- —
- Monthly cashflow
- —
- DSCR
- —
- Eligible?
- —
No personal income docs; deal must DSCR.
Hard money
10% down · 12.0% · 12mo
- Down + closing
- —
- Monthly P&I
- —
- Monthly cashflow
- —
- DSCR
- —
- Eligible?
- —
Short-term bridge; refi at stabilization.
Rent comps 17 comps
| Address | Beds | Baths | Sqft | Rent | $/sqft | DOM | Units | Dist |
|---|---|---|---|---|---|---|---|---|
| 13050 Dronfield Ave Sylmar, CA | 1.0 | 1.0 | 599 | $1,795 | $3.00 | 4d | 1 | 0.01mi |
| 13040 Dronfield Ave #3 Sylmar, CA | 1.0 | 1.0 | 613 | $1,950 | $3.18 | 45d | 1 | 0.02mi |
| 12960 Dronfield Ave Sylmar, CA | 2.0 | 1.0–1.5 | 747 | $1,930 | $2.58 | 4d | 3 | 0.21mi |
| 13987 Foothill Blvd Unit 09 Sylmar, CA | 1.0 | 1.0 | 574 | $1,695 | $2.95 | 26d | 1 | 0.41mi |
| 2039 Warren St San Fernando, CA | 1.0 | 1.0 | 493 | $1,900 | $3.85 | 0d | 1 | 0.50mi |
| 14254 Sayre St Sylmar, CA | 2.0 | 1.5 | 720 | $2,700 | $3.75 | 20d | 1 | 0.63mi |
| 12609 Norris Ave Sylmar, CA | 1.0 | 1.0 | 360 | $1,600 | $4.44 | 45d | 1 | 0.91mi |
| 14674 Rex St Sylmar, CA | 1.0 | 1.0 | 386 | $1,800 | $4.66 | 9d | 1 | 0.93mi |
| 12943 Wheeler Ave Sylmar, CA | 1.0 | 1.0 | 500 | $2,100 | $4.20 | 7d | 1 | 1.06mi |
| 12647 Bradley Ave Unit 12649-4 Sylmar, CA | 1.0 | 1.0 | 575 | $1,646 | $2.86 | 20d | 1 | 1.07mi |
| 13409 Oscar St Unit 1 Sylmar, CA | 1.0 | 1.0 | 630 | $2,050 | $3.25 | 26d | 1 | 1.16mi |
| 13880 Lexicon Ave Sylmar, CA | 1.0 | 1.0 | 400 | $2,000 | $5.00 | 26d | 1 | 1.26mi |
| 211 N Huntington St Unit Labs San Fernando, CA | 1.0 | 2.0 | 520 | $2,200 | $4.23 | 45d | 1 | 1.27mi |
| 14500 Olive View Dr Sylmar, CA | 1.0 | 1.0 | 716 | $1,970 | $2.75 | 7d | 5 | 1.28mi |
| 216 Harding Ave Unit 2 San Fernando, CA | 1.0 | 1.0 | 400 | $2,200 | $5.50 | 9d | 1 | 1.40mi |
| 216 Harding Ave Unit 3 San Fernando, CA | 1.0 | 1.0 | 550 | $2,400 | $4.36 | 9d | 1 | 1.40mi |
| 650 Glenoaks Blvd San Fernando, CA | 1.0 | 1.0 | 675 | $1,660 | $2.46 | 7d | 2 | 1.48mi |
HOA detail condo
- Monthly dues
- $356 · $4,272/yr
- Assessments
- None detected in remarks — confirm with the listing agent.
Listing history 22 events
-
2026-06-18days on market $185,000 Active 3 DOM
-
2026-06-17days on market $185,000 Active 2 DOM
-
2026-06-16remarks 261-char remark
-
2026-06-16pricestatusdays on market $185,000 Active 1 DOM
-
2026-05-09historical $1,950
-
2026-05-02historical
-
2026-03-19$1,950
-
2026-03-19historical $1,950
-
2026-03-18$1,950
-
2026-01-30price $199,999
-
2025-11-08$219,950 Active
-
2025-10-09status Pending Sale
-
2025-10-09historical
-
2025-08-30status Active
-
2025-08-22status Pending Sale
-
2025-08-19historical Active Under Contract
-
2025-08-13$219,950 Active
-
2025-04-22historical
-
2024-11-18price $180,000
-
2024-11-05$199,000 Active
-
1995-12-15soldstatus $60,000
-
1995-12-15soldstatus $60,000
ⓘ Source: listings_history table (triggers on properties + properties_extension) + one-shot
backfill from property_details.listing_events for pre-trigger history.
Tax reassessment forecast CA · Resets to sale price
- Current annual tax
- $1,312 · $109/mo
- Projected year-2 tax
- $1,406 · $117/mo
- Expected delta
- +$94/yr (+$8/mo · 7.2%)
ⓘ Screening estimate from a state-policy table — verify with the county assessor before closing.
Climate risk First Street
- Flood 1/10 Low FEMA zone X (unshaded) · 0% chance over 30 yrs
- Wildfire 2/10 Low
- Heat 6/10 Major 8 d/yr ≥100°F today · 23 d/yr by 30 yrs out
- Wind 1/10 Low
- Air quality 7/10 Severe 13 unhealthy d/yr today · 16 by 30 yrs out
Nearby sold comps map
Loading sold comps map…
Walkable amenities ~0.75 mi
Loading nearby amenities…
Taxation est. · year 1
- Rental income
- $23,452
- − Mortgage interest
- −$10,363
- − Property taxes
- −$1,312
- − Insurance
- −$925
- − Repairs & maintenance
- −$1,876
- − Management
- −$1,876
- − HOA
- −$4,272
- − Depreciation
- −$5,382
- Taxable loss
- −$2,554
- Est. tax savings @ 24.0%
- +$613
- After-tax cash flow
- $989/yr
For passive investors: Depreciation is non-cash, so a rental often shows a tax loss while cash-flowing — sheltering income. Rental losses are passive: they offset passive income freely, and up to $25,000/yr can offset ordinary (W-2) income if you actively participate and your MAGI is under $100k (phasing out to $0 by $150k); unused losses carry forward. On sale, claimed depreciation is recaptured at up to 25%, and gains may owe capital-gains tax (a 1031 exchange can defer both). Figures are a year-1 estimate at your 24.0% rate — not tax advice; consult a CPA.
Schools (NCES district)
- District
- Los Angeles Unified
- NCES district ID
- 0622710
- Math proficiency
- 29% ▼ -4.00%
- Reading proficiency
- 54% ▲ 10.00%
- Median HH income
- $50,403
- Composite
- 35.67/100
- National rank
- #4875
- State rank
- #223 of 517 in CA
Livability — Los Angeles
- Score
- 68/100
- State rank
- #273
- US rank
- #9237
Category grades
Schools grade is shown separately in the Schools card above.
Census & demographics
- Census place
- Los Angeles, CA
- County
- Los Angeles County · 9,444,647 people
- City population
- 3,838,149
- Metro
- Los Angeles-Long Beach-Anaheim, CA
- Population (ZIP)
- 93,301
- Household income
- $98,118
- Rent vs Own
- Severe rent burden
- 2559.0
Population outlook (Los Angeles County) Hauer SSP2
- Today (2025)
- 10,940,515 people
- By 2030
- 11,256,481 · +2.9%
- By 2040
- 11,729,929 · +7.2%
- By 2050
- 11,948,407 · +9.2%
- By 2075
- 11,818,114 · +8.0%
- By 2100
- 10,842,928 · -0.9%
Race, ethnicity, and origin ACS 2023
- Neighborhood character
- Predominantly Hispanic (74%)
- Race & ethnicity
- Hispanic / Latino 74% Two or more races 23% White 12% Asian 7% Black 3% Native American 2%
- Hispanic origin (detail)
- Mexican 59%
- Common ancestry
- Italian 1%
- Foreign-born
- 36% · Canada, South Korea, Dominican Republic
- Languages at home
- 32% English-only · Spanish 59% Tagalog/Filipino 4% Other Indo-European 3%
Political lean MEDSL · Los Angeles
- 2024 margin
- Solid D (+32.9) · D 64.8% · R 31.9% · Other 3.3%
- 2008→2024 swing
- -7.4pp toward R · 2008: 40.4pp · 2024: 32.9pp
- All cycles
- 2024: D+32.9 2020: D+44.2 2016: D+48.0 2012: D+40.0 2008: D+40.4
Not yet ingested
- Civics
- —
Market trends
- HPI YoY
- ▼ -921.77%
- Current HPI
- 440.1462
- Rent YoY
- ▬ 0.02%
- Metro
- Los Angeles-Long Beach-Anaheim, CA
- State GDP YoY
- ▲ 3.21%
- F500 in state
- 116
Industry mix (Fortune 500 HQ in CA)
| Industry | F500 HQs | Revenue |
|---|---|---|
| Technology | 27 | $1,492B |
|
||
| Financial Services | 3 | $174B |
|
||
| Retail | 3 | $44B |
|
||
| Insurance | 3 | $26B |
|
||
| Media / Entertainment | 2 | $115B |
|
||
| Pharmaceuticals / Biotech | 2 | $62B |
|
||
Price history
+208.3% since first listed20 events — show timeline
- 2026-06-17 Sold (MLS) $185,000 CRMLS
- 2026-06-15 Listed $185,000 CRMLS
- 2026-05-09 Rental Removed $1,950 SDMLS
- 2026-05-02 Listing Removed — CRMLS
- 2026-03-19 Listed for Rent $1,950 SDMLS
- 2026-03-19 Rental Removed $1,950 CRMLS
- 2026-03-18 Listed for Rent $1,950 CRMLS
- 2026-01-30 Price Changed $199,999 CRMLS
- 2025-11-08 Listed $219,950 CRMLS
- 2025-10-09 Pending — CRMLS
- 2025-10-09 Listing Removed — CRMLS
- 2025-08-30 Relisted — CRMLS
- 2025-08-22 Pending — CRMLS
- 2025-08-19 Contingent — CRMLS
- 2025-08-13 Listed $219,950 CRMLS
- 2025-04-22 Listing Removed — CRMLS
- 2024-11-18 Price Changed $180,000 CRMLS
- 2024-11-05 Listed $199,000 CRMLS
- 1995-12-15 Sold (Public Records) $60,000 Public Records
- 1995-12-15 Sold (Public Records) $60,000 Public Records
Property tax history
+1.6%/yrLatest (2025): $1,312 · +1.8% YoY. Source: county tax records.
Cash-flow waterfall
monthlySold comps — $/sqft
last 12 mo · ≤1 miLoading sold comps…