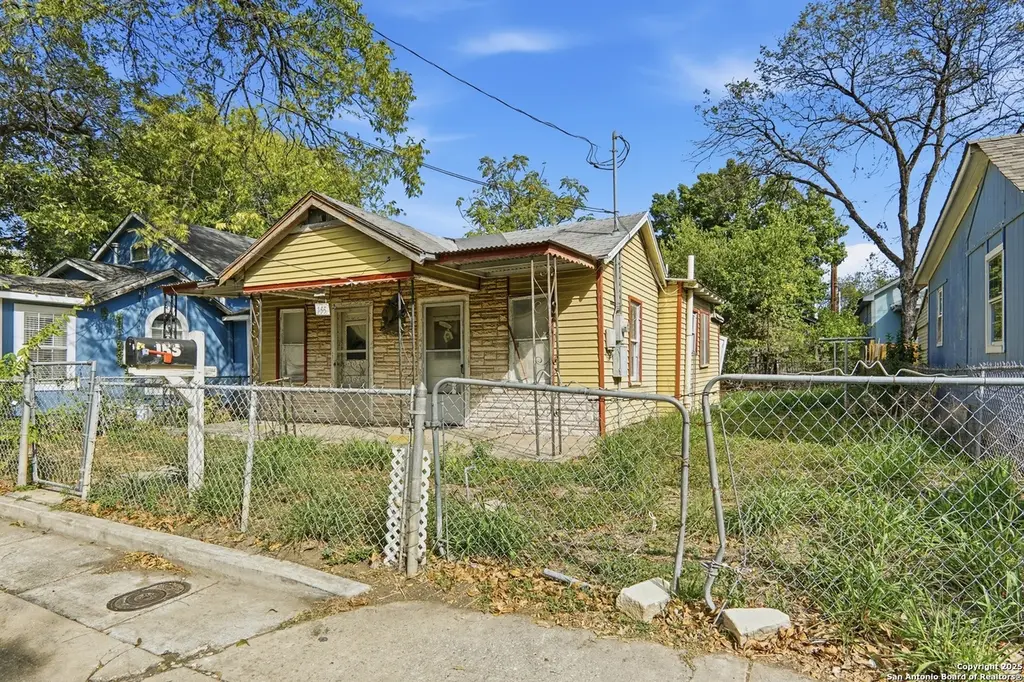
155 W Zavalla · San Antonio, TX
Flood risk 1/10 · Minimal
- FEMA flood zone
- X (unshaded)
- Chance of flooding over 30 yrs
- 0.0%
- Est. flood insurance / yr
- $507 – $1,088
Fire risk 1/10 · Minimal
- Est. fire insurance / yr
- $1,222 – $2,270
Heat risk 8/10 · Major
- Hot days now (above 108°F)
- 7 days/yr
- Hot days in 30 yrs
- 22 days/yr
Wind risk 8/10 · Major
- Chance of severe wind over 30 yrs
- 80.0%
Air-quality risk 2/10 · Minimal
- Unhealthy air days now
- 1 days/yr
- Unhealthy air days in 30 yrs
- 2 days/yr
Risk factors via First Street. Map © Google.
Why this score? — see what drove the A- grade
The composite is a weighted blend of 9 inputs, each scored 0–100. Each bar is that input's sub-score; the figure is the points it added to the 100-point composite (weight × sub-score).
- Cash flow +30.0/30.0
- ARV discount +15.0/15.0
- 1% rule +10.0/10.0
- DSCR +10.0/10.0
- Appreciation +10.0/10.0
- Livability +4.0/5.0
- Condition / age +2.5/5.0
- Rent growth +2.1/5.0
- Schools +1.4/10.0
$79,000
🖨 Deal sheet 📄 Offer letter ✓ Due diligence
Listing remarks MLS
Located in one of San Antonio's most rapidly developing urban-core neighborhoods, 155 W Zavalla offers exceptional potential for investors, builders, or developers looking for a strategically positioned property with long-term upside. Set on a half-lot and featuring a 588 sq ft, 2-bedroom home built in 1929, this property is ideal for redevelopment or a complete reimagining, supported by strong surrounding growth and limited available inventory in the area. The value of this property lies overwhelmingly in its location. Just 3 minutes from Blue Star, 5 minutes to King William, 6 minutes from UTSA and Texas A&M-San Antonio, 8 minutes from Tech Port San Antonio, and 10 minutes to Downtown, the home sits at the crossroads of major cultural, educational, and economic expansion. Few areas in the city offer this blend of proximity, walkability, and investment momentum. Recent neighborhood activity also underscores strong redevelopment potential. While the property is currently zoned R-2, numerous nearby owners have successfully rezoned to R-4, allowing for higher density and multi-story construction. The City has expressed openness to similar rezoning requests, particularly where redevelopment aligns with neighborhood improvement and housing expansion efforts. For future buyers, this opens the possibility of building a larger residence, a multi-level home, or a new construction design incorporating garage parking and significantly more square footage. Because the existing structure occupies only about half the lot, the site provides a flexible canvas. An investor could preserve a small single-story footprint, expand the home, or rebuild entirely with a modern multi-story design. The combination of a walkable residential setting, strong nearby institutions, and major innovation-driven growth at Tech Port and UTSA further strengthens the long-term ROI outlook. For those seeking an infill redevelopment opportunity in a high-demand area with proven appreciation, 155 W Zavalla stands out as a rare, strategically located asset in the heart of San Antonio's next wave of urban growth.
Key facts
- Higher density
- Zoned r-2
- Rezoned to r-4
Tags
Neighborhood map
What this means for you Summary
Snapshot
- This is a 2-bed/1.0-bath single-family listed at $79k.
Deal economics
- At list price, monthly cash flow is $330 ($4k/yr) — positive.
- The deal already cash-flows at list — no discount required.
- Meets the 1% rule at list price ($1k rent vs $79k).
- Recommended offer: $70k (12.0% below list) — sets the bar for market timing.
- Cap rate 11.3% vs local median 3.8% in San Antonio — top-decile yield for the area; either an underpriced asset or a hidden risk that comps aren't pricing in. Stress-test before assuming the spread holds.
Location & tenants
- Location reads 80/100 on livability (#31 in TX, #1,616 nationally) — a professional / high-income tenant draw. Strengths: amenities A+, commute A+, cost of living A+; Watch: schools C-, crime F.
- San Antonio ISD (urban): math 12% / reading 22% proficiency, ranked #805 of 826 in TX (top 98%) — low school quality limits family demand, transient renter base, plan for 1-2y turnover; 80% free/reduced lunch — lower-income household profile, screen leases tightly.
- Market conditions: Rents soft (-1.4%/yr); 94 active listings in the ZIP; 40 comparable units currently listed for rent nearby; rentals at typical pace (median 22d on market — plan ~3-4 weeks tenant-placement turnaround); 8,308 units permitted in Bexar County in 2024 (2,506 in 5+ unit buildings).
Forward outlook
- In year one you build about $8k of equity ($546 loan paydown + $8k appreciation (10.0% local appreciation)).
- Bexar County population projected at +50% by 2050 — long-run rental-demand tailwind backs the buy-and-hold thesis.
- At projected returns (10.0% appreciation + 0.0% rent growth), your $22k cash investment doubles in ~2 years — after that, you're playing with house money.
- By year 5, paydown + projected appreciation supports a ~$39k cash-out refi (75% LTV) — recoverable capital for the next deal without selling this one.
Negotiation context
- It's been on market 202 days — a 12% lower offer ($70k) is reasonable based on typical stale-listing flexibility.
- 5 sale attempts since 7y ago with the ask held roughly flat each time — persistent listings suggest the price (not the market) is what's stuck; bring a comps-based counter.
Risks & watch-outs
- Watch-outs: property tax is 3.1% of price; built in 1929 — expect roof / HVAC / electrical / plumbing capex.
- Climate carrying-cost: severe wind risk, 80% chance of damaging wind over 30y; extreme-heat days projected 7→22/yr by 2055 (HVAC capex compounding) — expect insurance premiums to compound above CPI over the hold.
Questions for the listing agent
- It's been on market 202 days. Have you received any prior offers? Is the seller open to a 12% concession, seller financing, or rate buy-down credit?
- Built in 1929 — when were the roof, HVAC, electrical panel, plumbing, and water heater last replaced?
- Property tax is high relative to price — has the assessment been appealed recently, and will the sale trigger a re-assessment?
- Why hasn't it sold? Are there any deal-killer items the seller is aware of (foundation, flood, title, zoning, code violations)?
- Is there a deadline driving the sale (1031 exchange, divorce, estate, relocation)? That informs how much negotiation room exists.
- Crime grade is F in this area — have there been break-ins, vandalism, or insurance claims at this property in the last 3 years? What carrier currently insures it and at what premium?
- What's the average days-on-market for RENTAL listings here right now (not sales)? A rising rental-DOM trend means longer vacancies and softer asking-rent achievability than the comps imply.
- What's the recent tenant-quality profile in this submarket — average credit score on applications, eviction rate, late-payment / NSF rate, and stable-employment percentage? A property-management company in the area should have these aggregated.
- How much new for-sale + rental construction is in the pipeline within 1–3 miles? Heavy new supply typically softens prices + rents 12–24 months out; constrained supply supports both.
Investment metrics
- 1% rule
- 1.57% ✓
- Cap rate
- 11.31%
- Cash-on-cash
- 17.92%
- DSCR
- 1.80
- GRM
- 5.3
CMA / ARV
- ARV (median comp)
- $117,746
- List price
- $79,000
- Delta
- -32.91%
- Verdict
- UNDERPRICED
- Comps
- 20 within 1.0 mi
Show comp detail 3 sales within ~0.75 mi
| Address | Dist | Beds/Ba | Sqft | Sold | Price | $/sf | Match |
|---|---|---|---|---|---|---|---|
| 125 Forrest Ave | 0.35mi | 3/1.0 (+1) | 616 (+5%) | 11mo | $100,000 | $162 | 62 |
| 207 Goodwin | 0.65mi | 2/1.0 | 600 (+2%) | 14mo | $109,000 | $182 | 54 |
| 209-211 Pendleton | 0.33mi | 1/1.0 (-1) | 672 (+14%) | 13mo | $150,000 | $223 | 44 |
Match score weights: distance 35% · size 25% · config 20% · recency 20%. Top-matched comps best support the ARV.
Projected returns pro-forma
10.0% appreciation · 0.0% rent growth · sell at horizon
- IRR
- 35.9%
- Equity multiple
- 3.74×
- Total profit
- $60,517
- Equity at exit
- $71,169
- IRR
- 29.8%
- Equity multiple
- 8.02×
- Total profit
- $155,320
- Equity at exit
- $153,480
Cash invested: $22,120 (down + closing). Projections, not guarantees.
Landlord ↔ Tenant lean methodology
- Overall (STATE)
- 87 Strongly Landlord-Friendly
- State Texas
- 87 Strongly Landlord-Friendly · R+5
- County
- — inherits STATE
- City
- — inherits STATE
ZIP-level market 78204
- Home prices YoY
- 6.4%
- Rents YoY
- -1.4%
- Active inventory
- 94
- Price-to-rent
- 5.3×
Monthly cashflow live
- Estimated rent
- $1,240 high interval (Pro) →
- Mortgage (P&I)
- −$414
- Tax from tax record
- −$202 /mo · $2,425/yr
- Insurance
- −$33
- HOA
- −$0
- Vacancy / Maint / Mgmt
- −$260
- Net cashflow
- $330
Break-even live
UW: 25.0% down · 7.5% · 30yr · 1.5% tax · 5.0% vac · 8.0% maint · 8.0% mgmt
Financing live
Cash to close
- Down payment
- $19,750
- Closing costs
- $2,370
- Reserves months
- —
- Total cash needed
- —
Loan-product check · same deal, 3 products live
Conventional
25% down · 7.5% · 30yr
- Down + closing
- —
- Monthly P&I
- —
- Monthly cashflow
- —
- DSCR
- —
- Eligible?
- —
Personal DTI + credit; lowest rate.
DSCR
20% down · 8.5% · 30yr
- Down + closing
- —
- Monthly P&I
- —
- Monthly cashflow
- —
- DSCR
- —
- Eligible?
- —
No personal income docs; deal must DSCR.
Hard money
10% down · 12.0% · 12mo
- Down + closing
- —
- Monthly P&I
- —
- Monthly cashflow
- —
- DSCR
- —
- Eligible?
- —
Short-term bridge; refi at stabilization.
Rent comps 40 comps
| Address | Beds | Baths | Sqft | Rent | $/sqft | DOM | Units | Dist |
|---|---|---|---|---|---|---|---|---|
| 1901 S San Marcos Unit 610 San Antonio, TX | 1.0 | 1.0 | 750 | $962 | $1.28 | 3d | 1 | 0.26mi |
| 302 W Cevallos Unit 2 San Antonio, TX | 1.0 | 1.0 | 400 | $1,250 | $3.12 | 43d | 1 | 0.31mi |
| 205 W Lambert St San Antonio, TX | 2.0 | 1.0 | 550 | $995 | $1.81 | 17d | 1 | 0.34mi |
| 125 Forrest Ave San Antonio, TX | 2.0 | 1.0 | 616 | $1,275 | $2.07 | 16d | 1 | 0.36mi |
| 218 Tampico St San Antonio, TX | 2.0 | 1.0–2.0 | 808 | $1,623 | $2.01 | 2d | 28 | 0.38mi |
| 131 Klein St #1 San Antonio, TX | 2.0 | 1.0 | 653 | $1,395 | $2.14 | 44d | 1 | 0.42mi |
| 1401 S Flores St #300 San Antonio, TX | 1.0 | 1.0 | 728 | $1,750 | $2.40 | 16d | 1 | 0.44mi |
| 128 Saint Francis Ave Unit 3 San Antonio, TX | 1.0 | 1.0 | 528 | $775 | $1.47 | 24d | 1 | 0.44mi |
| 215 E Cevallos San Antonio, TX | 3.0 | 1.0–3.0 | 1162 | $2,348 | $2.02 | 1d | 20 | 0.53mi |
| 150 Bank St Unit C San Antonio, TX | 1.0 | 1.0 | 600 | $749 | $1.25 | 20d | 1 | 0.60mi |
| 150 Bank St San Antonio, TX | 1.0 | 1.0 | 700 | $795 | $1.14 | 43d | 1 | 0.60mi |
| 302 E Cevallos St Unit 2 San Antonio, TX | 1.0 | 1.0 | 400 | $1,500 | $3.75 | 43d | 1 | 0.61mi |
| 939 S Frio St Unit 1294 San Antonio, TX | 1.0 | 1.0 | 630 | $977 | $1.55 | 3d | 1 | 0.65mi |
| 939 S Frio St Unit 294 San Antonio, TX | 1.0 | 1.0 | 664 | $1,009 | $1.52 | 11d | 1 | 0.65mi |
| 301 E Cevallos San Antonio, TX | 2.0 | 1.0–2.5 | 983 | $1,819 | $1.85 | 3d | 14 | 0.65mi |
| 2600 S Flores St San Antonio, TX | 2.0 | 1.0 | 705 | $900 | $1.28 | 24d | 3 | 0.66mi |
| 1011 S Frio St San Antonio, TX | 3.0 | 1.0–3.0 | 1121 | $1,820 | $1.62 | 1d | 32 | 0.67mi |
| 112 Oelkers San Antonio, TX | 1.0 | 1.0 | 420 | $1,100 | $2.62 | 3d | 1 | 0.69mi |
| 112 Oelkers St Unit 2 San Antonio, TX | 1.0 | 1.0 | 375 | $950 | $2.53 | 43d | 1 | 0.69mi |
| 1102 El Paso St San Antonio, TX | 1.0–3.0 | 1.0–2.0 | 888 | $1,116 | $1.26 | 3d | 1 | 0.87mi |
| 1115 S Alamo St San Antonio, TX | 1.0 | 1.0 | 713 | $2,150 | $3.01 | 43d | 2 | 1.00mi |
| 815 Ripford St San Antonio, TX | 2.0 | 1.0 | 728 | $1,300 | $1.79 | 4d | 1 | 1.01mi |
| 220 Beauregard St #2 San Antonio, TX | 1.0 | 1.0 | 640 | $1,500 | $2.34 | 43d | 1 | 1.09mi |
| 525 Mission St Unit 1 San Antonio, TX | 1.0 | 1.0 | 650 | $1,355 | $2.08 | 24d | 1 | 1.11mi |
| 525 Mission St Unit 4 San Antonio, TX | 1.0 | 1.0 | 650 | $1,355 | $2.08 | 43d | 1 | 1.11mi |
| 323 W Mitchell St San Antonio, TX | 1.0–2.0 | 1.0–2.0 | 788 | $1,257 | $1.59 | 3d | 1 | 1.12mi |
| 527 Cedar St Unit 9 San Antonio, TX | 1.0 | 1.0 | 630 | $905 | $1.44 | 43d | 1 | 1.16mi |
| 531 Cedar St Unit 3 San Antonio, TX | 1.0 | 1.0 | 713 | $850 | $1.19 | 43d | 1 | 1.16mi |
| 227 Claudia St Unit 2 San Antonio, TX | 1.0 | 1.0 | 650 | $1,700 | $2.62 | 22d | 1 | 1.18mi |
| 227 Claudia St Unit 2 San Antonio, TX | 1.0 | 1.0 | 694 | $1,700 | $2.45 | 20d | 1 | 1.18mi |
| 461 S Main Ave San Antonio, TX | 1.0 | 1.0 | 690 | $1,201 | $1.74 | 43d | 1 | 1.19mi |
| 319 S Flores St San Antonio, TX | 1.0 | 1.0 | 690 | $1,160 | $1.68 | 43d | 1 | 1.19mi |
| 319 S Flores St Unit 104 San Antonio, TX | 1.0 | 1.0 | 577 | $990 | $1.72 | 17d | 1 | 1.20mi |
| 330 Barrett Pl San Antonio, TX | 1.0 | 1.0 | 400 | $900 | $2.25 | 12d | 1 | 1.24mi |
| 350 Barrett Pl San Antonio, TX | 2.0 | 1.0 | 616 | $1,225 | $1.99 | 4d | 1 | 1.27mi |
| 520 Prado St Unit 1 San Antonio, TX | 2.0 | 1.0 | 620 | $799 | $1.29 | 43d | 1 | 1.28mi |
| 1326 S Saint Mary's St Apt 6 San Antonio, TX | 1.0 | 1.0 | 720 | $998 | $1.39 | 22d | 1 | 1.28mi |
| 121 E Mitchell St San Antonio, TX | 2.0 | 1.0 | 528 | $850 | $1.61 | 43d | 1 | 1.30mi |
| 1938 S Zarzamora St Unit 610 San Antonio, TX | 1.0 | 1.0 | 744 | $915 | $1.23 | 3d | 1 | 1.30mi |
| 118 Callaghan Ave Unit A San Antonio, TX | 1.0 | 1.0 | 635 | $1,625 | $2.56 | 43d | 1 | 1.33mi |
Listing history 26 events
-
2026-06-18days on market $79,000 Active 202 DOM
-
2026-06-17days on market $79,000 Active 201 DOM
-
2026-06-16days on market $79,000 Active 200 DOM
-
2026-06-15days on market $79,000 Active 199 DOM
-
2026-06-13days on market $79,000 Active 197 DOM
-
2026-06-09days on market $79,000 Active 193 DOM
-
2026-06-08days on market $79,000 Active 192 DOM
-
2026-06-07days on market $79,000 Active 191 DOM
-
2026-06-04days on market $79,000 Active 188 DOM
-
2026-06-03days on market $79,000 Active 187 DOM
-
2026-06-02days on market $79,000 Active 186 DOM
-
2026-06-01days on market $79,000 Active 185 DOM
-
2026-05-31days on market $79,000 Active 184 DOM
-
2025-11-28$79,000 New 2123-char remark
Show marketing remark (2123 chars)
Located in one of San Antonio's most rapidly developing urban-core neighborhoods, 155 W Zavalla offers exceptional potential for investors, builders, or developers looking for a strategically positioned property with long-term upside. Set on a half-lot and featuring a 588 sq ft, 2-bedroom home built in 1929, this property is ideal for redevelopment or a complete reimagining, supported by strong surrounding growth and limited available inventory in the area. The value of this property lies overwhelmingly in its location. Just 3 minutes from Blue Star, 5 minutes to King William, 6 minutes from UTSA and Texas A&M-San Antonio, 8 minutes from Tech Port San Antonio, and 10 minutes to Downtown, the home sits at the crossroads of major cultural, educational, and economic expansion. Few areas in the city offer this blend of proximity, walkability, and investment momentum. Recent neighborhood activity also underscores strong redevelopment potential. While the property is currently zoned R-2, numerous nearby owners have successfully rezoned to R-4, allowing for higher density and multi-story construction. The City has expressed openness to similar rezoning requests, particularly where redevelopment aligns with neighborhood improvement and housing expansion efforts. For future buyers, this opens the possibility of building a larger residence, a multi-level home, or a new construction design incorporating garage parking and significantly more square footage. Because the existing structure occupies only about half the lot, the site provides a flexible canvas. An investor could preserve a small single-story footprint, expand the home, or rebuild entirely with a modern multi-story design. The combination of a walkable residential setting, strong nearby institutions, and major innovation-driven growth at Tech Port and UTSA further strengthens the long-term ROI outlook. For those seeking an infill redevelopment opportunity in a high-demand area with proven appreciation, 155 W Zavalla stands out as a rare, strategically located asset in the heart of San Antonio's next wave of urban growth.
-
2025-09-21historical
-
2025-07-28price $79,900
-
2025-03-23$89,900 New
-
2019-04-01soldstatus
-
2019-03-22soldstatus Sold
-
2019-03-14status Pending
-
2019-03-10price $52,000
-
2019-02-28status Back on Market
-
2019-02-25historical Active Option
-
2019-02-12status Back on Market
-
2019-02-09historical
-
2019-02-08$71,590 New
ⓘ Source: listings_history table (triggers on properties + properties_extension) + one-shot
backfill from property_details.listing_events for pre-trigger history.
Tax reassessment forecast TX · Resets to sale price
- Current annual tax
- $2,425 · $202/mo
- Projected year-2 tax
- $2,425 · $202/mo
- Expected delta
- $0/yr ($0/mo · 0.0%)
ⓘ Screening estimate from a state-policy table — verify with the county assessor before closing.
Climate risk First Street
- Flood 1/10 Low FEMA zone X (unshaded) · 0% chance over 30 yrs
- Wildfire 1/10 Low
- Heat 8/10 Severe 7 d/yr ≥108°F today · 22 d/yr by 30 yrs out
- Wind 8/10 Severe 80% chance of damaging wind over 30 yrs
- Air quality 2/10 Low 1 unhealthy d/yr today · 2 by 30 yrs out
Nearby sold comps map
Loading sold comps map…
Walkable amenities ~0.75 mi
Loading nearby amenities…
Taxation est. · year 1
- Rental income
- $14,882
- − Mortgage interest
- −$4,425
- − Property taxes
- −$2,425
- − Insurance
- −$395
- − Repairs & maintenance
- −$1,191
- − Management
- −$1,191
- − Depreciation
- −$2,298
- Taxable income
- $2,957
- Est. tax owed @ 24.0%
- −$710
- After-tax cash flow
- $3,255/yr
For passive investors: Depreciation is non-cash, so a rental often shows a tax loss while cash-flowing — sheltering income. Rental losses are passive: they offset passive income freely, and up to $25,000/yr can offset ordinary (W-2) income if you actively participate and your MAGI is under $100k (phasing out to $0 by $150k); unused losses carry forward. On sale, claimed depreciation is recaptured at up to 25%, and gains may owe capital-gains tax (a 1031 exchange can defer both). Figures are a year-1 estimate at your 24.0% rate — not tax advice; consult a CPA.
Schools (NCES district)
- District
- San Antonio ISD
- NCES district ID
- 4838730
- Math proficiency
- 12% ▼ -21.00%
- Reading proficiency
- 22% ▼ -7.00%
- Median HH income
- $30,952
- Composite
- 13.57/100
- National rank
- #9512
- State rank
- #805 of 826 in TX
Livability — San Antonio
- Score
- 80/100
- State rank
- #31
- US rank
- #1616
Category grades
Schools grade is shown separately in the Schools card above.
Census & demographics
- Census place
- San Antonio, TX
- County
- Bexar County · 1,990,555 people
- City population
- 1,806,925
- Metro
- San Antonio-New Braunfels, TX
- Population (ZIP)
- 11,983
- Household income
- $60,255
- Rent vs Own
- Severe rent burden
- 545.0
Population outlook (Bexar County) Hauer SSP2
- Today (2025)
- 2,336,851 people
- By 2030
- 2,560,728 · +9.6%
- By 2040
- 3,020,569 · +29.3%
- By 2050
- 3,493,522 · +49.5%
- By 2075
- 4,668,459 · +99.8%
- By 2100
- 5,533,242 · +136.8%
Race, ethnicity, and origin ACS 2023
- Neighborhood character
- Predominantly Hispanic (82%)
- Race & ethnicity
- Hispanic / Latino 82% Two or more races 37% White 15% Black 2% Native American 2%
- Hispanic origin (detail)
- Mexican 74%
- Common ancestry
- Romanian 3% Italian 2% Lithuanian 1%
- Foreign-born
- 15% · Canada
- Languages at home
- 50% English-only · Spanish 49%
Political lean MEDSL · Bexar
- 2024 margin
- Lean D (+9.8) · D 54.3% · R 44.6% · Other 1.1%
- 2008→2024 swing
- +4.2pp toward D · 2008: 5.6pp · 2024: 9.8pp
- All cycles
- 2024: D+9.8 2020: D+18.2 2016: D+13.5 2012: D+4.6 2008: D+5.6
Not yet ingested
- Civics
- —
Market trends
- HPI YoY
- ▲ 14.91%
- Current HPI
- 249.0597
- Rent YoY
- ▼ -1.44%
- Metro
- San Antonio-New Braunfels, TX
- State GDP YoY
- ▲ 3.95%
- F500 in state
- 110
Industry mix (Fortune 500 HQ in TX)
| Industry | F500 HQs | Revenue |
|---|---|---|
| Energy | 16 | $1,198B |
|
||
| Technology | 5 | $198B |
|
||
| Engineering / Construction | 4 | $72B |
|
||
| Energy Services | 3 | $60B |
|
||
| Utilities | 3 | $41B |
|
||
| Healthcare | 2 | $330B |
|
||
Price history
+10.4% since first listed13 events — show timeline
- 2025-11-28 Listed $79,000 LERA
- 2025-09-21 Listing Removed — LERA
- 2025-07-28 Price Changed $79,900 LERA
- 2025-03-23 Listed $89,900 LERA
- 2019-04-01 Sold (Public Records) — Public Records
- 2019-03-22 Sold (MLS) — LERA
- 2019-03-14 Pending — LERA
- 2019-03-10 Price Changed $52,000 LERA
- 2019-02-28 Relisted — LERA
- 2019-02-25 Contingent — LERA
- 2019-02-12 Relisted — LERA
- 2019-02-09 Listing Removed — LERA
- 2019-02-08 Listed $71,590 LERA
Property tax history
+9.1%/yrLatest (2025): $2,425 · -0.6% YoY. Source: county tax records.
Cash-flow waterfall
monthlySold comps — $/sqft
last 12 mo · ≤1 miLoading sold comps…