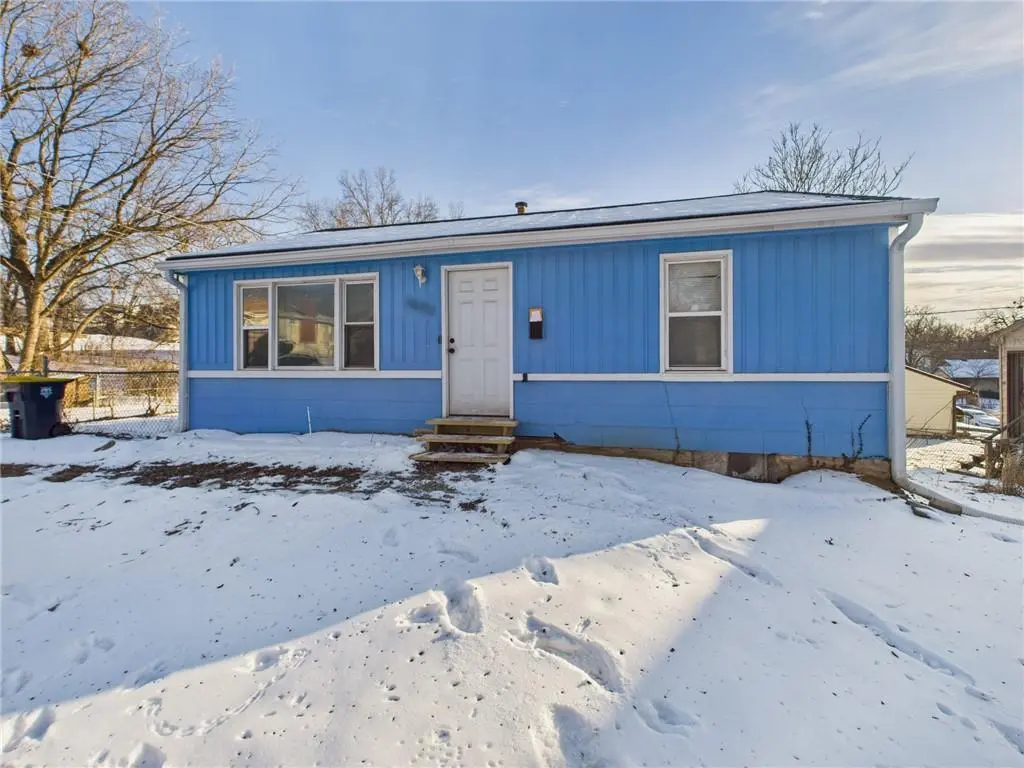
1603 E 82nd St · Kansas City, MO
Flood risk 1/10 · Minimal
- FEMA flood zone
- X (unshaded)
- Chance of flooding over 30 yrs
- 0.0%
- Est. flood insurance / yr
- $473 – $860
Fire risk 1/10 · Minimal
- Est. fire insurance / yr
- $1,054 – $1,958
Heat risk 4/10 · Minor
- Hot days now (above 107°F)
- 7 days/yr
- Hot days in 30 yrs
- 17 days/yr
Wind risk 2/10 · Minimal
- Chance of severe wind over 30 yrs
- —
Air-quality risk 3/10 · Minor
- Unhealthy air days now
- 2 days/yr
- Unhealthy air days in 30 yrs
- 4 days/yr
Risk factors via First Street. Map © Google.
Why this score? — see what drove the B- grade
The composite is a weighted blend of 9 inputs, each scored 0–100. Each bar is that input's sub-score; the figure is the points it added to the 100-point composite (weight × sub-score).
- Cash flow +28.0/30.0
- ARV discount +10.8/15.0
- DSCR +9.9/10.0
- 1% rule +6.8/10.0
- Livability +3.9/5.0
- Rent growth +3.5/5.0
- Condition / age +2.5/5.0
- Schools +1.8/10.0
- Appreciation +0.0/10.0
$103,500
🖨 Deal sheet 📄 Offer letter ✓ Due diligence
Listing remarks MLS
Check out this great investment property in Marlborough! This 2 bed / 1 bath home sits on a large lot and rents easily. Currently rents for $1075, leased through February 2027. This property is also being sold as a part of a package. Contact listing agent for details.
Key facts
- 6,534 sq ft lot
- Built 1955
- Listed 58 days
Neighborhood map
What this means for you Summary
Snapshot
- This is a 2-bed/1.0-bath single-family listed at $104k.
Deal economics
- At list price, monthly cash flow is $321 ($4k/yr) — positive.
- The deal already cash-flows at list — no discount required.
- Meets the 1% rule at list price ($1k rent vs $104k).
- Recommended offer: $100k (3.0% below list) — sets the bar for market timing.
- Cap rate 10.0% vs local median 3.9% in Kansas City — top-decile yield for the area; either an underpriced asset or a hidden risk that comps aren't pricing in. Stress-test before assuming the spread holds.
Location & tenants
- Location reads 78/100 on livability (#28 in MO, #2,671 nationally) — a middle-class / working-renter tenant base. Strengths: amenities A+, commute A+, cost of living A+; Watch: schools C-, crime F.
- Center 58 (urban): math 12% / reading 29% proficiency, ranked #301 of 324 in MO (top 93%) — low school quality limits family demand, transient renter base, plan for 1-2y turnover; 63% free/reduced lunch — lower-income household profile, screen leases tightly.
- Market conditions: Rents rising (+4.0%/yr); 131 active listings in the ZIP; 21 comparable units currently listed for rent nearby; rentals at typical pace (median 16d on market — plan ~3-4 weeks tenant-placement turnaround); 4,002 units permitted in Jackson County in 2024 (2,271 in 5+ unit buildings).
Forward outlook
- Local home prices are declining (-3.0%/yr); year-one equity from $716 of loan paydown is wiped out by about $3k of value loss. Plan a longer hold.
- Jackson County population projected at +4% by 2050 — modest demand growth; plan on rents tracking national, not racing it.
- At projected returns (-3.0% appreciation + 4.0% rent growth), your $29k cash investment doubles in ~8 years — after that, you're playing with house money.
Negotiation context
- It's been on market 58 days — a 3% lower offer ($100k) is reasonable based on typical stale-listing flexibility.
- 6 sale attempts since 26y ago with the ask held roughly flat each time — persistent listings suggest the price (not the market) is what's stuck; bring a comps-based counter.
Risks & watch-outs
- Watch-outs: built in 1955 — expect roof / HVAC / electrical / plumbing capex.
Questions for the listing agent
- It's been on market 58 days. Have you received any prior offers? Is the seller open to a 3% concession, seller financing, or rate buy-down credit?
- Built in 1955 — when were the roof, HVAC, electrical panel, plumbing, and water heater last replaced?
- Is there a deadline driving the sale (1031 exchange, divorce, estate, relocation)? That informs how much negotiation room exists.
- Crime grade is F in this area — have there been break-ins, vandalism, or insurance claims at this property in the last 3 years? What carrier currently insures it and at what premium?
- What's the average days-on-market for RENTAL listings here right now (not sales)? A rising rental-DOM trend means longer vacancies and softer asking-rent achievability than the comps imply.
- What's the recent tenant-quality profile in this submarket — average credit score on applications, eviction rate, late-payment / NSF rate, and stable-employment percentage? A property-management company in the area should have these aggregated.
- How much new for-sale + rental construction is in the pipeline within 1–3 miles? Heavy new supply typically softens prices + rents 12–24 months out; constrained supply supports both.
Investment metrics
- 1% rule
- 1.18% ✓
- Cap rate
- 10.01%
- Cash-on-cash
- 13.28%
- DSCR
- 1.59
- GRM
- 7.1
CMA / ARV
- ARV (median comp)
- $111,752
- List price
- $103,500
- Delta
- -7.38%
- Verdict
- FAIR
- Comps
- 20 within 1.0 mi
Show comp detail 12 sales within ~0.75 mi
| Address | Dist | Beds/Ba | Sqft | Sold | Price | $/sf | Match |
|---|---|---|---|---|---|---|---|
| 8110 Paseo Blvd | 0.13mi | 2/1.0 | 792 (-3%) | 3mo | $75,000 | $95 | 87 |
| 1329 E 82nd St | 0.19mi | 2/1.0 | 822 (+1%) | 4mo | $135,000 | $164 | 86 |
| 1206 E 81 St | 0.34mi | 2/1.0 | 816 (0%) | 4mo | $95,000 | $116 | 81 |
| 8119 Wayne Ave | 0.05mi | 2/1.0 | 882 (+8%) | 4mo | $85,000 | $96 | 81 |
| 8236 Flora Ave | 0.13mi | 3/2.0 (+1) | 864 (+6%) | 0mo | $195,000 | $226 | 75 |
| 8321 Olive St | 0.53mi | 2/1.0 | 803 (-2%) | 0mo | $70,000 | $87 | 72 |
| 8028 Flora Ave | 0.20mi | 2/1.0 | 906 (+11%) | 1mo | $130,000 | $143 | 71 |
| 2121 E 77th Ter | 0.56mi | 2/1.0 | 832 (+2%) | 2mo | $78,000 | $94 | 69 |
| 8029 Park Ave | 0.44mi | 2/1.0 | 744 (-9%) | 4mo | $104,500 | $140 | 62 |
| 2131 E 81st St | 0.34mi | 2/1.0 | 704 (-14%) | 2mo | $65,000 | $92 | 60 |
| 8111 Park Ave | 0.42mi | 3/2.0 (+1) | 882 (+8%) | 3mo | $129,900 | $147 | 55 |
| 8405 Wabash Ave | 0.63mi | 2/1.0 | 936 (+15%) | 2mo | $74,889 | $80 | 45 |
Match score weights: distance 35% · size 25% · config 20% · recency 20%. Top-matched comps best support the ARV.
Projected returns pro-forma
-3.0% appreciation · 3.97% rent growth · sell at horizon
- IRR
- 4.3%
- Equity multiple
- 1.17×
- Total profit
- $4,828
- Equity at exit
- $15,432
- IRR
- 14.6%
- Equity multiple
- 2.22×
- Total profit
- $35,417
- Equity at exit
- $8,949
Cash invested: $28,980 (down + closing). Projections, not guarantees.
Landlord ↔ Tenant lean methodology
- Overall (STATE)
- 81 Strongly Landlord-Friendly
- State Missouri
- 81 Strongly Landlord-Friendly · R+10
- County
- — inherits STATE
- City
- — inherits STATE
ZIP-level market 64131
- Rents YoY
- 4.0%
- Active inventory
- 131
- Price-to-rent
- 7.1×
Monthly cashflow live
- Estimated rent
- $1,217 high interval (Pro) →
- Mortgage (P&I)
- −$543
- Tax from tax record
- −$55 /mo · $661/yr
- Insurance
- −$43
- HOA
- −$0
- Vacancy / Maint / Mgmt
- −$256
- Net cashflow
- $321
Break-even live
UW: 25.0% down · 7.5% · 30yr · 1.5% tax · 5.0% vac · 8.0% maint · 8.0% mgmt
Financing live
Cash to close
- Down payment
- $25,875
- Closing costs
- $3,105
- Reserves months
- —
- Total cash needed
- —
Loan-product check · same deal, 3 products live
Conventional
25% down · 7.5% · 30yr
- Down + closing
- —
- Monthly P&I
- —
- Monthly cashflow
- —
- DSCR
- —
- Eligible?
- —
Personal DTI + credit; lowest rate.
DSCR
20% down · 8.5% · 30yr
- Down + closing
- —
- Monthly P&I
- —
- Monthly cashflow
- —
- DSCR
- —
- Eligible?
- —
No personal income docs; deal must DSCR.
Hard money
10% down · 12.0% · 12mo
- Down + closing
- —
- Monthly P&I
- —
- Monthly cashflow
- —
- DSCR
- —
- Eligible?
- —
Short-term bridge; refi at stabilization.
Rent comps 21 comps
| Address | Beds | Baths | Sqft | Rent | $/sqft | DOM | Units | Dist |
|---|---|---|---|---|---|---|---|---|
| 8226 Flora Ave Kansas City, MO | 2.0 | 1.0 | 862 | $1,200 | $1.39 | 2d | 1 | 0.11mi |
| 8222 Troost Ave Unit 8222-1 Kansas City, MO | 2.0 | 1.0 | 825 | $1,400 | $1.70 | 14d | 1 | 0.41mi |
| 8208 Troost Ave Unit 8218-3 Kansas City, MO | 2.0 | 1.0 | 750 | $1,345 | $1.79 | 43d | 1 | 0.45mi |
| 8208 Troost Ave Kansas City, MO | 1.0–2.0 | 1.0 | 761 | $1,395 | $1.83 | 7d | 2 | 0.46mi |
| 8150 Troost Ave Unit 53 Kansas City, MO | 2.0 | 1.0 | 900 | $1,200 | $1.33 | 43d | 1 | 0.46mi |
| 1830 E 78th St Kansas City, MO | 3.0 | 1.0 | 1000 | $1,350 | $1.35 | 12d | 1 | 0.47mi |
| 1861 E 78th St Kansas City, MO | 3.0 | 1.0 | 864 | $1,095 | $1.27 | 16d | 1 | 0.48mi |
| 8101 Campbell St Kansas City, MO | 2.0 | 1.0 | 820 | $888 | $1.08 | 1d | 1 | 0.52mi |
| 7560 Prospect Ave Unit G Kansas City, MO | 1.0 | 1.0 | 900 | $925 | $1.03 | 3d | 1 | 0.86mi |
| 7560 Prospect Ave Unit F Kansas City, MO | 1.0 | 1.0 | 900 | $925 | $1.03 | 43d | 1 | 0.88mi |
| 7427 Arleta Blvd Kansas City, MO | 2.0 | 1.0 | 805 | $1,150 | $1.43 | 43d | 1 | 0.95mi |
| 320 E 79th Ter Kansas City, MO | 3.0 | 1.0 | 1100 | $1,700 | $1.55 | 43d | 1 | 0.96mi |
| 8104 McGee St Kansas City, MO | 2.0 | 1.0 | 1100 | $1,350 | $1.23 | 23d | 1 | 0.98mi |
| 8701 Chestnut Cir Kansas City, MO | 1.0–2.0 | 1.0–2.0 | 925 | $1,115 | $1.21 | 1d | 15 | 1.03mi |
| 7605 Locust St Kansas City, MO | 2.0 | 1.0 | 744 | $1,325 | $1.78 | 7d | 1 | 1.08mi |
| 7411 Montgall Ave Kansas City, MO | 3.0 | 1.0 | 840 | $1,200 | $1.43 | 43d | 1 | 1.14mi |
| 3106 E 75th St Kansas City, MO | 3.0 | 1.5 | 985 | $1,225 | $1.24 | 21d | 1 | 1.26mi |
| 7412 Bellefontaine Ave Unit A Kansas City, MO | 2.0 | 1.0 | 780 | $1,200 | $1.54 | 2d | 1 | 1.29mi |
| 7317 Agnes Ave Kansas City, MO | 2.0 | 1.0 | 767 | $895 | $1.17 | 23d | 1 | 1.34mi |
| 7426 Indiana Ave Kansas City, MO | 3.0 | 1.0 | 1100 | $1,400 | $1.27 | 43d | 1 | 1.40mi |
| 7524 Baltimore Ave Kansas City, MO | 2.0 | 1.0 | 1000 | $1,300 | $1.30 | 16d | 1 | 1.46mi |
Listing history 31 events
-
2026-06-18days on market $103,500 Active 58 DOM
-
2026-06-17days on market $103,500 Active 57 DOM
-
2026-06-16days on market $103,500 Active 56 DOM
-
2026-06-15days on market $103,500 Active 55 DOM
-
2026-06-13days on market $103,500 Active 53 DOM
-
2026-06-09days on market $103,500 Active 49 DOM
-
2026-06-08days on market $103,500 Active 48 DOM
-
2026-06-07days on market $103,500 Active 47 DOM
-
2026-06-03days on market $103,500 Active 43 DOM
-
2026-06-02days on market $103,500 Active 42 DOM
-
2026-06-01days on market $103,500 Active 41 DOM
-
2026-05-31days on market $103,500 Active 40 DOM
-
2026-04-21$103,500 Active 268-char remark
Show marketing remark (268 chars)
Check out this great investment property in Marlborough! This 2 bed / 1 bath home sits on a large lot and rents easily. Currently rents for $1075, leased through February 2027. This property is also being sold as a part of a package. Contact listing agent for details.
-
2026-02-21historical $1,075
-
2026-02-04$1,075
-
2019-05-31soldstatus Sold 244-char remark
Show marketing remark (244 chars)
THIS IS READY FOR YOU TO MAKE IT YOUR HOME! THIS HOME FEATURES TONS OF NEW UPGRADES!!!NEW FLOORS NEW & NEW CARPET THROUGH-OUT THE HOME, FRESHLY RENOVATED KITCHEN, ALL NEW CABINETS AND COUNTERS TOPS, NEW WINDOWS AND NICE NEWLY BUILD DECK!!
-
2019-05-02status Pending 244-char remark
Show marketing remark (244 chars)
THIS IS READY FOR YOU TO MAKE IT YOUR HOME! THIS HOME FEATURES TONS OF NEW UPGRADES!!!NEW FLOORS NEW & NEW CARPET THROUGH-OUT THE HOME, FRESHLY RENOVATED KITCHEN, ALL NEW CABINETS AND COUNTERS TOPS, NEW WINDOWS AND NICE NEWLY BUILD DECK!!
-
2019-04-25price $60,000 244-char remark
Show marketing remark (244 chars)
THIS IS READY FOR YOU TO MAKE IT YOUR HOME! THIS HOME FEATURES TONS OF NEW UPGRADES!!!NEW FLOORS NEW & NEW CARPET THROUGH-OUT THE HOME, FRESHLY RENOVATED KITCHEN, ALL NEW CABINETS AND COUNTERS TOPS, NEW WINDOWS AND NICE NEWLY BUILD DECK!!
-
2019-04-11price $64,000 244-char remark
Show marketing remark (244 chars)
THIS IS READY FOR YOU TO MAKE IT YOUR HOME! THIS HOME FEATURES TONS OF NEW UPGRADES!!!NEW FLOORS NEW & NEW CARPET THROUGH-OUT THE HOME, FRESHLY RENOVATED KITCHEN, ALL NEW CABINETS AND COUNTERS TOPS, NEW WINDOWS AND NICE NEWLY BUILD DECK!!
-
2019-04-01price $69,000 244-char remark
Show marketing remark (244 chars)
THIS IS READY FOR YOU TO MAKE IT YOUR HOME! THIS HOME FEATURES TONS OF NEW UPGRADES!!!NEW FLOORS NEW & NEW CARPET THROUGH-OUT THE HOME, FRESHLY RENOVATED KITCHEN, ALL NEW CABINETS AND COUNTERS TOPS, NEW WINDOWS AND NICE NEWLY BUILD DECK!!
-
2019-02-22price $73,000 244-char remark
Show marketing remark (244 chars)
THIS IS READY FOR YOU TO MAKE IT YOUR HOME! THIS HOME FEATURES TONS OF NEW UPGRADES!!!NEW FLOORS NEW & NEW CARPET THROUGH-OUT THE HOME, FRESHLY RENOVATED KITCHEN, ALL NEW CABINETS AND COUNTERS TOPS, NEW WINDOWS AND NICE NEWLY BUILD DECK!!
-
2019-01-31$76,000 Active 244-char remark
Show marketing remark (244 chars)
THIS IS READY FOR YOU TO MAKE IT YOUR HOME! THIS HOME FEATURES TONS OF NEW UPGRADES!!!NEW FLOORS NEW & NEW CARPET THROUGH-OUT THE HOME, FRESHLY RENOVATED KITCHEN, ALL NEW CABINETS AND COUNTERS TOPS, NEW WINDOWS AND NICE NEWLY BUILD DECK!!
-
2019-01-21historical
-
2018-12-17$80,000 Active
-
2017-09-29soldstatus Sold
-
2017-09-22status Pending
-
2017-08-05$15,900 Active
-
2000-04-27soldstatus
-
2000-04-26soldstatus
-
2000-02-06$33,950
-
1993-07-06soldstatus
ⓘ Source: listings_history table (triggers on properties + properties_extension) + one-shot
backfill from property_details.listing_events for pre-trigger history.
Tax reassessment forecast MO · Resets to sale price
- Current annual tax
- $661 · $55/mo
- Projected year-2 tax
- $1,004 · $84/mo
- Expected delta
- +$343/yr (+$29/mo · 52.0%)
ⓘ Screening estimate from a state-policy table — verify with the county assessor before closing.
Climate risk First Street
- Flood 1/10 Low FEMA zone X (unshaded) · 0% chance over 30 yrs
- Wildfire 1/10 Low
- Heat 4/10 Moderate 7 d/yr ≥107°F today · 17 d/yr by 30 yrs out
- Wind 2/10 Low
- Air quality 3/10 Moderate 2 unhealthy d/yr today · 4 by 30 yrs out
Nearby sold comps map
Loading sold comps map…
Walkable amenities ~0.75 mi
Loading nearby amenities…
Taxation est. · year 1
- Rental income
- $14,608
- − Mortgage interest
- −$5,798
- − Property taxes
- −$661
- − Insurance
- −$518
- − Repairs & maintenance
- −$1,169
- − Management
- −$1,169
- − Depreciation
- −$3,011
- Taxable income
- $2,284
- Est. tax owed @ 24.0%
- −$548
- After-tax cash flow
- $3,301/yr
For passive investors: Depreciation is non-cash, so a rental often shows a tax loss while cash-flowing — sheltering income. Rental losses are passive: they offset passive income freely, and up to $25,000/yr can offset ordinary (W-2) income if you actively participate and your MAGI is under $100k (phasing out to $0 by $150k); unused losses carry forward. On sale, claimed depreciation is recaptured at up to 25%, and gains may owe capital-gains tax (a 1031 exchange can defer both). Figures are a year-1 estimate at your 24.0% rate — not tax advice; consult a CPA.
Schools (NCES district)
- District
- Center 58
- NCES district ID
- 2908250
- Math proficiency
- 12% ▼ -15.00%
- Reading proficiency
- 29% ▼ -6.00%
- Median HH income
- $43,544
- Composite
- 17.64/100
- National rank
- #9031
- State rank
- #301 of 324 in MO
Livability — Kansas City
- Score
- 78/100
- State rank
- #28
- US rank
- #2671
Category grades
Schools grade is shown separately in the Schools card above.
Census & demographics
- Census place
- Kansas City, MO
- County
- Jackson County · 687,798 people
- City population
- 439,467
- Metro
- Kansas City, MO-KS
- Population (ZIP)
- 21,942
- Household income
- $64,201
- Rent vs Own
- Severe rent burden
- 1249.0
Population outlook (Jackson County) Hauer SSP2
- Today (2025)
- 719,589 people
- By 2030
- 731,456 · +1.6%
- By 2040
- 746,689 · +3.8%
- By 2050
- 749,289 · +4.1%
- By 2075
- 736,227 · +2.3%
- By 2100
- 668,210 · -7.1%
Race, ethnicity, and origin ACS 2023
- Neighborhood character
- Diverse neighborhood (Simpson 0.61)
- Race & ethnicity
- White 48% Black 39% Hispanic / Latino 7% Two or more races 7% Asian 1%
- Hispanic origin (detail)
- Mexican 3%
- Common ancestry
- Italian 5% Slovak 1% Lithuanian 1%
- Foreign-born
- 5% · Canada, Vietnam
- Languages at home
- 93% English-only · Spanish 3% French/Haitian/Cajun 1%
Political lean MEDSL · Jackson
- 2024 margin
- D (+19.3) · D 58.9% · R 39.5% · Other 1.6%
- 2008→2024 swing
- -6.1pp toward R · 2008: 25.4pp · 2024: 19.3pp
- All cycles
- 2024: D+19.3 2020: D+22.0 2016: D+16.6 2012: D+19.0 2008: D+25.4
Not yet ingested
- Civics
- —
Market trends
- HPI YoY
- ▼ -253.25%
- Current HPI
- 340.8202
- Rent YoY
- ▲ 3.97%
- Metro
- Kansas City, MO-KS
- State GDP YoY
- ▲ 1.84%
- F500 in state
- 20
Industry mix (Fortune 500 HQ in MO)
| Industry | F500 HQs | Revenue |
|---|---|---|
| Healthcare | 1 | $163B |
|
||
| Insurance | 1 | $21B |
|
||
| Industrial Technology | 1 | $17B |
|
||
| Retail | 1 | $16B |
|
||
| Industrial Distribution | 1 | $10B |
|
||
| Utilities | 1 | $9B |
|
||
Price history
+204.9% since first listed19 events — show timeline
- 2026-04-21 Listed $103,500 Heartland MLS as Distributed by MLS Grid
- 2026-02-21 Rental Removed $1,075 TENANTTURNER2
- 2026-02-04 Listed for Rent $1,075 TENANTTURNER2
- 2019-05-31 Sold (MLS) — Heartland MLS as Distributed by MLS Grid
- 2019-05-02 Pending — Heartland MLS as Distributed by MLS Grid
- 2019-04-25 Price Changed $60,000 Heartland MLS as Distributed by MLS Grid
- 2019-04-11 Price Changed $64,000 Heartland MLS as Distributed by MLS Grid
- 2019-04-01 Price Changed $69,000 Heartland MLS as Distributed by MLS Grid
- 2019-02-22 Price Changed $73,000 Heartland MLS as Distributed by MLS Grid
- 2019-01-31 Listed $76,000 Heartland MLS as Distributed by MLS Grid
- 2019-01-21 Listing Removed — Heartland MLS as Distributed by MLS Grid
- 2018-12-17 Listed $80,000 Heartland MLS as Distributed by MLS Grid
- 2017-09-29 Sold (MLS) — Heartland MLS as Distributed by MLS Grid
- 2017-09-22 Pending — Heartland MLS as Distributed by MLS Grid
- 2017-08-05 Listed $15,900 Heartland MLS as Distributed by MLS Grid
- 2000-04-27 Sold (Public Records) — Public Records
- 2000-04-26 Sold (MLS) — Heartland MLS as Distributed by MLS Grid
- 2000-02-06 Listed $33,950 Heartland MLS as Distributed by MLS Grid
- 1993-07-06 Sold (Public Records) — Public Records
Property tax history
+3.2%/yrLatest (2025): $661 · +12.1% YoY. Source: county tax records.
Cash-flow waterfall
monthlySold comps — $/sqft
last 12 mo · ≤1 miLoading sold comps…