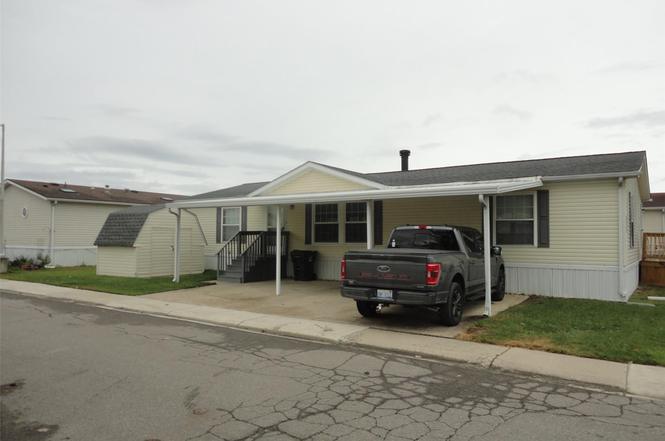
25182 Frontier Cir · Flat Rock, MI
Flood risk No data
- FEMA flood zone
- —
- Chance of flooding over 30 yrs
- —
- Est. flood insurance / yr
- —
Fire risk No data
- Est. fire insurance / yr
- —
Heat risk No data
- Hot days now (above threshold)
- —
- Hot days in 30 yrs
- —
Wind risk No data
- Chance of severe wind over 30 yrs
- —
Air-quality risk No data
- Unhealthy air days now
- —
- Unhealthy air days in 30 yrs
- —
Risk factors via First Street. Map © Google.
Why this score? — see what drove the B- grade
The composite is a weighted blend of 9 inputs, each scored 0–100. Each bar is that input's sub-score; the figure is the points it added to the 100-point composite (weight × sub-score).
- Cash flow +30.0/30.0
- 1% rule +10.0/10.0
- DSCR +10.0/10.0
- ARV discount +7.5/15.0
- Livability +3.7/5.0
- Schools +2.8/10.0
- Rent growth +2.5/5.0
- Condition / age +2.5/5.0
- Appreciation +0.0/10.0
$62,900
🖨 Deal sheet (PDF) 📄 Offer letter ✓ Due diligence
Listing remarks MLS
Very clean 3 bedroom home with 2 full baths, open floor plan with large living area, all appliances included with sale of home. This is a manufactured home on a rented lot in Deerfield Estates mobile home park. Easy to show and move in at closing.
Key facts
- 2,800 sq ft lot
- Built 1998
- Listed 186 days
Neighborhood map
What this means for you Summary
Snapshot
- This is a 3-bed/2.0-bath manufactured listed at $63k.
Deal economics
- At list price, monthly cash flow is $384 ($5k/yr) — positive.
- The deal already cash-flows at list — no discount required.
- Meets the 1% rule at list price ($2k rent vs $63k).
- Recommended offer: $55k (12.0% below list) — sets the bar for market timing.
- Cap rate 13.6% vs local median 2.7% in Flat Rock — top-decile yield for the area; either an underpriced asset or a hidden risk that comps aren't pricing in. Stress-test before assuming the spread holds.
Location & tenants
- Location reads 74/100 on livability (#177 in MI, #4,594 nationally) — a middle-class / working-renter tenant base. Strengths: cost of living A+, housing A+, health & safety A+; Watch: amenities F, commute F.
- Flat Rock Community Schools (suburban): math 26% / reading 37% proficiency, ranked #326 of 540 in MI (top 60%) — families likely to look elsewhere, expect single-tenant / working-renter base with shorter leases.
- Zoned schools: John M Barnes Elem School (math 31% / reading 33%, grade F, #814 of 1,397 statewide, top 61%, 380 students, 53% FRL); Thomas Simpson Middle School (math 24% / reading 39%, grade F, #323 of 493 statewide, top 66%, 402 students, 44% FRL); Flat Rock Community High School (math 27% / reading 42%, grade F, #372 of 713 statewide, top 56%, 475 students, 38% FRL).
- Market conditions: 84 active listings in the ZIP; 1 comparable units currently listed for rent nearby; solid renter incomes; 2,639 units permitted in Wayne County in 2024 (1,216 in 5+ unit buildings).
Forward outlook
- Local home prices are declining (-3.0%/yr); year-one equity from $435 of loan paydown is wiped out by about $2k of value loss. Plan a longer hold.
- Wayne County population projected at -17% by 2050 — secular population decline; favor cash flow + early exit over multi-decade hold.
- At projected returns (-3.0% appreciation + 3.0% rent growth), your $18k cash investment doubles in ~5 years — after that, you're playing with house money.
Negotiation context
- It's been on market 186 days — a 12% lower offer ($55k) is reasonable based on typical stale-listing flexibility.
- 2 sale attempts; this cycle's ask has dropped $7k (10%) from the opening price — seller is motivated, your offer sets the floor, not the list.
Risks & watch-outs
- Watch-outs: HOA is 32% of rent.
Questions for the listing agent
- It's been on market 186 days. Have you received any prior offers? Is the seller open to a 12% concession, seller financing, or rate buy-down credit?
- What does the HOA fee cover, when was the last increase, and are there any pending special assessments or reserve-fund shortfalls?
- Why hasn't it sold? Are there any deal-killer items the seller is aware of (foundation, flood, title, zoning, code violations)?
- Is there a deadline driving the sale (1031 exchange, divorce, estate, relocation)? That informs how much negotiation room exists.
- What's the average days-on-market for RENTAL listings here right now (not sales)? A rising rental-DOM trend means longer vacancies and softer asking-rent achievability than the comps imply.
- What's the recent tenant-quality profile in this submarket — average credit score on applications, eviction rate, late-payment / NSF rate, and stable-employment percentage? A property-management company in the area should have these aggregated.
- How much new for-sale + rental construction is in the pipeline within 1–3 miles? Heavy new supply typically softens prices + rents 12–24 months out; constrained supply supports both.
Investment metrics
- 1% rule
- 2.75% ✓
- Cap rate
- 13.61%
- Cash-on-cash
- 26.14%
- DSCR
- 2.16
- GRM
- 3.0
CMA / ARV
No comps found within radius.
Projected returns pro-forma
-3.0% appreciation · 3.0% rent growth · sell at horizon
- IRR
- 20.3%
- Equity multiple
- 1.83×
- Total profit
- $14,607
- Equity at exit
- $9,379
- IRR
- 28.7%
- Equity multiple
- 3.59×
- Total profit
- $45,663
- Equity at exit
- $5,438
Cash invested: $17,612 (down + closing). Projections, not guarantees.
Landlord ↔ Tenant lean methodology
- Overall (STATE)
- 62 Landlord-Friendly
- State Michigan
- 62 Landlord-Friendly · EVEN
- County
- — inherits STATE
- City
- — inherits STATE
ZIP-level market 48134
- Active inventory
- 84
- Price-to-rent
- 3.0×
Monthly cashflow live
- Estimated rent
- $1,732 medium interval (Pro) →
- Mortgage (P&I)
- −$330
- Tax est. 1.5%
- −$79 /mo · $944/yr
- Insurance
- −$26
- HOA
- −$550
- Vacancy / Maint / Mgmt
- −$364
- Net cashflow
- $384
Break-even live
Sensitivity live
| Price | -10% $427 | -5% $405 | +0% $384 | +5% $362 | +10% $340 |
|---|---|---|---|---|---|
| Rent | -10% $247 | -5% $315 | +0% $384 | +5% $452 | +10% $520 |
| Rate | -1.0pp $415 | -0.5pp $400 | base $384 | +0.5pp $367 | +1.0pp $351 |
UW: 25.0% down · 7.5% · 30yr · 1.5% tax · 5.0% vac · 8.0% maint · 8.0% mgmt
Financing live
Cash to close
- Down payment
- $15,725
- Closing costs
- $1,887
- Reserves months
- —
- Total cash needed
- —
Loan-product check · same deal, 3 products live
Conventional
25% down · 7.5% · 30yr
- Down + closing
- —
- Monthly P&I
- —
- Monthly cashflow
- —
- DSCR
- —
- Eligible?
- —
Personal DTI + credit; lowest rate.
DSCR
20% down · 8.5% · 30yr
- Down + closing
- —
- Monthly P&I
- —
- Monthly cashflow
- —
- DSCR
- —
- Eligible?
- —
No personal income docs; deal must DSCR.
Hard money
10% down · 12.0% · 12mo
- Down + closing
- —
- Monthly P&I
- —
- Monthly cashflow
- —
- DSCR
- —
- Eligible?
- —
Short-term bridge; refi at stabilization.
Rent comps 1 comps
| Address | Beds | Baths | Sqft | Rent | $/sqft | DOM | Units | Dist |
|---|---|---|---|---|---|---|---|---|
| 23501 Van Horn Rd Woodhaven, MI | 4.0 | 2.0 | 1568 | $1,599 | $1.02 | 0d | 1 | 1.12mi |
HOA detail
- Monthly dues
- $550 · $6,600/yr
Listing history 12 events
-
2026-04-24status Pending 247-char remark
Show marketing remark (247 chars)
Very clean 3 bedroom home with 2 full baths, open floor plan with large living area, all appliances included with sale of home. This is a manufactured home on a rented lot in Deerfield Estates mobile home park. Easy to show and move in at closing.
-
2026-04-24status Pending
Show marketing remark (247 chars)
Very clean 3 bedroom home with 2 full baths, open floor plan with large living area, all appliances included with sale of home. This is a manufactured home on a rented lot in Deerfield Estates mobile home park. Easy to show and move in at closing.
-
2026-04-17price $62,900 247-char remark
Show marketing remark (247 chars)
Very clean 3 bedroom home with 2 full baths, open floor plan with large living area, all appliances included with sale of home. This is a manufactured home on a rented lot in Deerfield Estates mobile home park. Easy to show and move in at closing.
-
2026-04-16price $62,900
-
2026-03-10price $65,000 247-char remark
Show marketing remark (247 chars)
Very clean 3 bedroom home with 2 full baths, open floor plan with large living area, all appliances included with sale of home. This is a manufactured home on a rented lot in Deerfield Estates mobile home park. Easy to show and move in at closing.
-
2026-03-10price $65,000
Show marketing remark (247 chars)
Very clean 3 bedroom home with 2 full baths, open floor plan with large living area, all appliances included with sale of home. This is a manufactured home on a rented lot in Deerfield Estates mobile home park. Easy to show and move in at closing.
-
2026-02-25price $67,000 247-char remark
Show marketing remark (247 chars)
Very clean 3 bedroom home with 2 full baths, open floor plan with large living area, all appliances included with sale of home. This is a manufactured home on a rented lot in Deerfield Estates mobile home park. Easy to show and move in at closing.
-
2026-02-25price $67,000
Show marketing remark (247 chars)
Very clean 3 bedroom home with 2 full baths, open floor plan with large living area, all appliances included with sale of home. This is a manufactured home on a rented lot in Deerfield Estates mobile home park. Easy to show and move in at closing.
-
2025-12-11price $69,000 247-char remark
Show marketing remark (247 chars)
Very clean 3 bedroom home with 2 full baths, open floor plan with large living area, all appliances included with sale of home. This is a manufactured home on a rented lot in Deerfield Estates mobile home park. Easy to show and move in at closing.
-
2025-12-10price $69,000
-
2025-10-20$70,000 Active
-
2025-10-19$70,000 Active 247-char remark
Show marketing remark (247 chars)
Very clean 3 bedroom home with 2 full baths, open floor plan with large living area, all appliances included with sale of home. This is a manufactured home on a rented lot in Deerfield Estates mobile home park. Easy to show and move in at closing.
ⓘ Source: listings_history table (triggers on properties + properties_extension) + one-shot
backfill from property_details.listing_events for pre-trigger history.
Nearby sold comps map
Loading sold comps map…
Walkable amenities ~0.75 mi
Loading nearby amenities…
Taxation est. · year 1
- Rental income
- $20,785
- − Mortgage interest
- −$3,523
- − Property taxes
- −$944
- − Insurance
- −$314
- − Repairs & maintenance
- −$1,663
- − Management
- −$1,663
- − HOA
- −$6,600
- − Depreciation
- −$1,830
- Taxable income
- $4,248
- Est. tax owed @ 24.0%
- −$1,020
- After-tax cash flow
- $3,584/yr
For passive investors: Depreciation is non-cash, so a rental often shows a tax loss while cash-flowing — sheltering income. Rental losses are passive: they offset passive income freely, and up to $25,000/yr can offset ordinary (W-2) income if you actively participate and your MAGI is under $100k (phasing out to $0 by $150k); unused losses carry forward. On sale, claimed depreciation is recaptured at up to 25%, and gains may owe capital-gains tax (a 1031 exchange can defer both). Figures are a year-1 estimate at your 24.0% rate — not tax advice; consult a CPA.
Schools (NCES district)
- District
- Flat Rock Community Schools
- NCES district ID
- 2607080
- Math proficiency
- 26% ▼ -7.00%
- Reading proficiency
- 37% ▼ -2.00%
- Median HH income
- $55,015
- Composite
- 27.89/100
- National rank
- #6871
- State rank
- #326 of 540 in MI
Livability — Flat Rock
- Score
- 74/100
- State rank
- #177
- US rank
- #4594
Category grades
Schools grade is shown separately in the Schools card above.
Census & demographics
- Census place
- Flat Rock, MI
- County
- Wayne County · 1,562,939 people
- City population
- 23,935
- Metro
- Detroit-Warren-Dearborn, MI
- Population (ZIP)
- 23,935
- Household income
- $92,076
- Rent vs Own
- Severe rent burden
- 228.0
Population outlook (Wayne County) Hauer SSP2
- Today (2025)
- 1,675,273 people
- By 2030
- 1,620,300 · -3.3%
- By 2040
- 1,502,341 · -10.3%
- By 2050
- 1,384,039 · -17.4%
- By 2075
- 1,124,592 · -32.9%
- By 2100
- 881,193 · -47.4%
Race, ethnicity, and origin ACS 2023
- Neighborhood character
- Predominantly White (77%)
- Race & ethnicity
- White 77% Two or more races 10% Hispanic / Latino 9% Black 8%
- Hispanic origin (detail)
- Mexican 6%
- Common ancestry
- Romanian 13% Lithuanian 5% Portuguese 3%
- Foreign-born
- 3% · Canada
- Languages at home
- 95% English-only · Spanish 3% Other Indo-European 1%
Political lean MEDSL · Wayne
- 2024 margin
- Strong D (+29.0) · D 62.7% · R 33.7% · Other 3.6%
- 2008→2024 swing
- -20.5pp toward R · 2008: 49.5pp · 2024: 29.0pp
- All cycles
- 2024: D+29.0 2020: D+38.1 2016: D+37.3 2012: D+46.9 2008: D+49.5
Not yet ingested
- Civics
- —
Market trends
- HPI YoY
- ▼ -223.42%
- Current HPI
- 232.7533
- Rent YoY
- —
- Metro
- Detroit-Warren-Dearborn, MI
- State GDP YoY
- ▲ 1.37%
- F500 in state
- 28
Industry mix (Fortune 500 HQ in MI)
| Industry | F500 HQs | Revenue |
|---|---|---|
| Automotive Parts | 3 | $48B |
|
||
| Automotive | 2 | $372B |
|
||
| Chemicals | 1 | $45B |
|
||
| Automotive Retail | 1 | $29B |
|
||
| Healthcare / Medical Devices | 1 | $23B |
|
||
| Automotive Technology | 1 | $20B |
|
||
Price history
-10.1% since first listed12 events — show timeline
- 2026-04-24 Pending — MiRealSource-MiMLS
- 2026-04-24 Pending — REALCOMP
- 2026-04-17 Price Changed $62,900 MiRealSource-MiMLS
- 2026-04-16 Price Changed $62,900 REALCOMP
- 2026-03-10 Price Changed $65,000 MiRealSource-MiMLS
- 2026-03-10 Price Changed $65,000 REALCOMP
- 2026-02-25 Price Changed $67,000 MiRealSource-MiMLS
- 2026-02-25 Price Changed $67,000 REALCOMP
- 2025-12-11 Price Changed $69,000 MiRealSource-MiMLS
- 2025-12-10 Price Changed $69,000 REALCOMP
- 2025-10-20 Listed $70,000 REALCOMP
- 2025-10-19 Listed $70,000 MiRealSource-MiMLS
Cash-flow waterfall
monthlySold comps — $/sqft
last 12 mo · ≤1 miLoading sold comps…