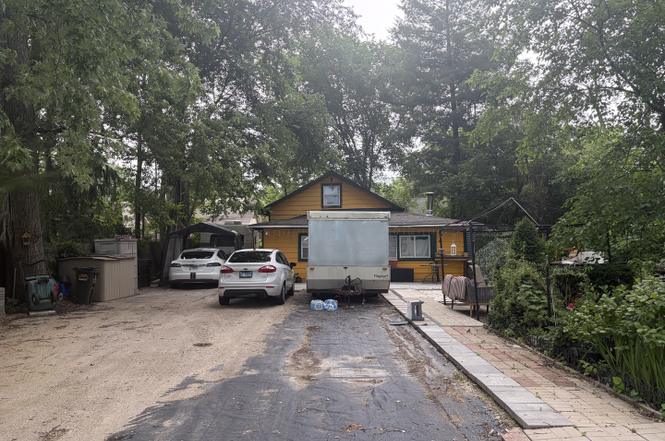
125 Sunnyside Ave · Crystal Lake, IL
Flood risk 3/10 · Minor
- FEMA flood zone
- X (unshaded)
- Chance of flooding over 30 yrs
- 0.12%
- Est. flood insurance / yr
- $473 – $860
Fire risk 1/10 · Minimal
- Est. fire insurance / yr
- $804 – $1,492
Heat risk 2/10 · Minimal
- Hot days now (above 101°F)
- 7 days/yr
- Hot days in 30 yrs
- 14 days/yr
Wind risk 2/10 · Minimal
- Chance of severe wind over 30 yrs
- —
Air-quality risk 2/10 · Minimal
- Unhealthy air days now
- 1 days/yr
- Unhealthy air days in 30 yrs
- 2 days/yr
Risk factors via First Street. Map © Google.
Why this score? — see what drove the D grade
The composite is a weighted blend of 9 inputs, each scored 0–100. Each bar is that input's sub-score; the figure is the points it added to the 100-point composite (weight × sub-score).
- Cash flow +12.7/30.0
- ARV discount +9.2/15.0
- Livability +4.1/5.0
- Schools +3.9/10.0
- 1% rule +3.8/10.0
- DSCR +3.8/10.0
- Rent growth +3.5/5.0
- Condition / age +2.5/5.0
- Appreciation +0.0/10.0
$220,000
🖨 Deal sheet 📄 Offer letter ✓ Due diligence
Listing remarks MLS
Check out this great opportunity to own your own home and build sweat equity or investors to rehab and convert to rental property. Elbow grease and modern re-interpretation will go a long way into making this cozy cottage a home again. Home is located in a well-established neighborhood with a private beach and access to Crystal Lake where you will enjoy fishing, sailing, boating, water skiing, canoeing and swimming. You can even get a front row seat to the fireworks display on July 4th. The galley kitchen offers plenty of storage with a great view of the yard and allows you to visit with friends and family when cooking that fresh caught fish for dinner. Home is set back off the road so there is plenty of room to build that oversized garage you have always wanted. Home is close to Lippold Family Park for watching the kid's baseball/soccer games, Crystal Lake beaches and shopping. This is a Fannie Mae HomePath Property.
Key facts
- Crystal lake beach
- Recent updates
- Spacious lot
Tags
Neighborhood map
What this means for you Summary
Snapshot
- This is a 2-bed/1.0-bath single-family listed at $220k.
Deal economics
- At list price, monthly cash flow is $-24 ($-292/yr) — negative.
- To cash-flow at today's rent, offer at most $216k (2.0% below list).
- To meet the 1% rule (rent ≥ 1% of price), the offer needs to be $194k (11.6% below list).
- Recommended offer: $194k (11.6% below list) — sets the bar for 1% rule.
- Cap rate 6.2% vs local median 4.0% in Crystal Lake — top-decile yield for the area; either an underpriced asset or a hidden risk that comps aren't pricing in. Stress-test before assuming the spread holds.
Location & tenants
- Location reads 82/100 on livability (#80 in IL, #1,289 nationally) — a professional / high-income tenant draw. Strengths: crime A+, employment A+, housing A+; Watch: amenities D+, commute F.
- Chsd 155 (suburban): math 41% / reading 42% proficiency, ranked #98 of 620 in IL (top 16%) — families likely to look elsewhere, expect single-tenant / working-renter base with shorter leases.
- Zoned schools: Crystal Lake Central High School (math 34% / reading 35%, grade F, #126 of 693 statewide, top 21%, 1,470 students, 0% FRL).
- Market conditions: Rents rising (+3.9%/yr); 144 active listings in the ZIP; 2 comparable units currently listed for rent nearby; solid renter incomes; 1,595 units permitted in McHenry County in 2024 (485 in 5+ unit buildings).
Forward outlook
- Local home prices are declining (-3.0%/yr); year-one equity from $2k of loan paydown is wiped out by about $7k of value loss. Plan a longer hold.
- McHenry County population projected at -12% by 2050 — secular population decline; favor cash flow + early exit over multi-decade hold.
Negotiation context
- Only 1 days on market — expect competitive offers; lowballing is unlikely to land.
- 2 sale attempts since 6y ago; this cycle's ask is 487% above the opening price — seller raised mid-cycle; expect resistance to lowballs.
- Current owner paid $39k; list at $220k implies a 464% gain — meaningful room to come down on a strong offer.
Risks & watch-outs
- Watch-outs: built in 1950 — expect roof / HVAC / electrical / plumbing capex.
Questions for the listing agent
- What do current leases actually rent for vs. the listed asking? Can we see a recent rent roll and the last 12 months of T-12 income?
- Built in 1950 — when were the roof, HVAC, electrical panel, plumbing, and water heater last replaced?
- What does the HOA fee cover, when was the last increase, and are there any pending special assessments or reserve-fund shortfalls?
- Is there a deadline driving the sale (1031 exchange, divorce, estate, relocation)? That informs how much negotiation room exists.
- Schools are B-rated — typically a magnet for longer-tenancy family renters. What's the average tenant stay here, and is there a school-zone premium baked into asking?
- The area grade is low — what's the realistic commute time and amenity access for the typical tenant pool here? Any planned neighborhood developments (good or bad) we should know about?
- What's the average days-on-market for RENTAL listings here right now (not sales)? A rising rental-DOM trend means longer vacancies and softer asking-rent achievability than the comps imply.
- What's the recent tenant-quality profile in this submarket — average credit score on applications, eviction rate, late-payment / NSF rate, and stable-employment percentage? A property-management company in the area should have these aggregated.
- How much new for-sale + rental construction is in the pipeline within 1–3 miles? Heavy new supply typically softens prices + rents 12–24 months out; constrained supply supports both.
Investment metrics
- 1% rule
- 0.88% ✗
- Cap rate
- 6.16%
- Cash-on-cash
- -0.47%
- DSCR
- 0.98
- GRM
- 9.4
CMA / ARV
- ARV (on-the-fly)
- $228,448
- Comps found
- 11
Show comp detail 11 sales within ~0.75 mi
| Address | Dist | Beds/Ba | Sqft | Sold | Price | $/sf | Match |
|---|---|---|---|---|---|---|---|
| 98 Cedar Dr | 0.22mi | 2/2.0 | 912 (-3%) | 1mo | $361,000 | $396 | 79 |
| 117 Lakewood Ave | 0.11mi | 2/1.0 | 809 (-14%) | 0mo | $250,000 | $309 | 71 |
| 153 N Greenfield Ave | 0.23mi | 2/1.0 | 833 (-12%) | 16mo | $155,000 | $186 | 56 |
| 48 Burr Oak Dr | 0.28mi | 2/1.0 | 1,026 (+9%) | 19mo | $248,000 | $242 | 56 |
| 1328 Teakwood Ln | 0.42mi | 3/1.5 (+1) | 864 (-8%) | 4mo | $264,000 | $306 | 56 |
| 1393 Mulberry Ln | 0.54mi | 3/1.0 (+1) | 888 (-6%) | 7mo | $165,000 | $186 | 54 |
| 1377 Gardina Vis | 0.61mi | 3/1.0 (+1) | 1,020 (+8%) | 8mo | $263,000 | $258 | 46 |
| 1370 Teakwood Ln | 0.50mi | 3/2.0 (+1) | 1,014 (+7%) | 17mo | $240,000 | $237 | 42 |
| 1398 Floresta Vista Ln | 0.59mi | 3/1.0 (+1) | 1,075 (+14%) | 6mo | $254,000 | $236 | 39 |
| 283 Millard Ave | 0.67mi | 3/1.0 (+1) | 1,025 (+9%) | 22mo | $265,000 | $259 | 31 |
| 340 Corrine Ave | 0.72mi | 3/1.0 (+1) | 1,053 (+12%) | 21mo | $245,000 | $233 | 24 |
Match score weights: distance 35% · size 25% · config 20% · recency 20%. Top-matched comps best support the ARV.
Projected returns pro-forma
-3.0% appreciation · 3.89% rent growth · sell at horizon
- IRR
- -16.0%
- Equity multiple
- 0.43×
- Total profit
- $-35,390
- Equity at exit
- $32,803
- IRR
- -6.1%
- Equity multiple
- 0.59×
- Total profit
- $-25,258
- Equity at exit
- $19,022
Cash invested: $61,600 (down + closing). Projections, not guarantees.
Landlord ↔ Tenant lean methodology
- Overall (STATE)
- 43 Moderately Tenant-Leaning
- State Illinois
- 43 Moderately Tenant-Leaning · D+7
- County
- — inherits STATE
- City
- — inherits STATE
ZIP-level market 60014
- Rents YoY
- 3.9%
- Active inventory
- 144
- Price-to-rent
- 9.4×
Monthly cashflow live
- Estimated rent
- $1,944 medium interval (Pro) →
- Mortgage (P&I)
- −$1,154
- Tax from tax record
- −$304 /mo · $3,643/yr
- Insurance
- −$92
- HOA
- −$11
- Vacancy / Maint / Mgmt
- −$408
- Net cashflow
- $-24
Break-even live
UW: 25.0% down · 7.5% · 30yr · 1.5% tax · 5.0% vac · 8.0% maint · 8.0% mgmt
Financing live
Cash to close
- Down payment
- $55,000
- Closing costs
- $6,600
- Reserves months
- —
- Total cash needed
- —
Loan-product check · same deal, 3 products live
Conventional
25% down · 7.5% · 30yr
- Down + closing
- —
- Monthly P&I
- —
- Monthly cashflow
- —
- DSCR
- —
- Eligible?
- —
Personal DTI + credit; lowest rate.
DSCR
20% down · 8.5% · 30yr
- Down + closing
- —
- Monthly P&I
- —
- Monthly cashflow
- —
- DSCR
- —
- Eligible?
- —
No personal income docs; deal must DSCR.
Hard money
10% down · 12.0% · 12mo
- Down + closing
- —
- Monthly P&I
- —
- Monthly cashflow
- —
- DSCR
- —
- Eligible?
- —
Short-term bridge; refi at stabilization.
Rent comps 2 comps
| Address | Beds | Baths | Sqft | Rent | $/sqft | DOM | Units | Dist |
|---|---|---|---|---|---|---|---|---|
| 116 Pauline Ave Crystal Lake, IL | 3.0 | 1.0 | 960 | $2,100 | $2.19 | 43d | 1 | 1.01mi |
| 300 Pauline Ave Unit B Crystal Lake, IL | 1.0 | 1.0 | 1000 | $1,275 | $1.27 | 24d | 1 | 1.07mi |
HOA detail
- Monthly dues
- $11 · $132/yr
- Likely covers
- water
Listing history 6 events
-
2026-06-17statusdays on market $220,000 Active 1 DOM
-
2026-06-17days on market $220,000 Active (Private) 5 DOM
-
2026-06-16days on market $220,000 Active (Private) 4 DOM
-
2026-06-15days on market $220,000 Active (Private) 3 DOM
-
2026-06-13remarks 565-char remark
-
2026-06-13$220,000 Active (Private) 1 DOM
ⓘ Source: listings_history table (triggers on properties + properties_extension) + one-shot
backfill from property_details.listing_events for pre-trigger history.
Tax reassessment forecast IL · Partial reset (capped growth)
- Current annual tax
- $3,643 · $304/mo
- Projected year-2 tax
- $4,318 · $360/mo
- Expected delta
- +$676/yr (+$56/mo · 18.5%)
ⓘ Screening estimate from a state-policy table — verify with the county assessor before closing.
Climate risk First Street
- Flood 3/10 Moderate FEMA zone X (unshaded) · 12% chance over 30 yrs
- Wildfire 1/10 Low
- Heat 2/10 Low 7 d/yr ≥101°F today · 14 d/yr by 30 yrs out
- Wind 2/10 Low
- Air quality 2/10 Low 1 unhealthy d/yr today · 2 by 30 yrs out
Nearby sold comps map
Loading sold comps map…
Walkable amenities ~0.75 mi
Loading nearby amenities…
Taxation est. · year 1
- Rental income
- $23,325
- − Mortgage interest
- −$12,323
- − Property taxes
- −$3,643
- − Insurance
- −$1,100
- − Repairs & maintenance
- −$1,866
- − Management
- −$1,866
- − HOA
- −$132
- − Depreciation
- −$6,400
- Taxable loss
- −$4,005
- Est. tax savings @ 24.0%
- +$961
- After-tax cash flow
- $669/yr
For passive investors: Depreciation is non-cash, so a rental often shows a tax loss while cash-flowing — sheltering income. Rental losses are passive: they offset passive income freely, and up to $25,000/yr can offset ordinary (W-2) income if you actively participate and your MAGI is under $100k (phasing out to $0 by $150k); unused losses carry forward. On sale, claimed depreciation is recaptured at up to 25%, and gains may owe capital-gains tax (a 1031 exchange can defer both). Figures are a year-1 estimate at your 24.0% rate — not tax advice; consult a CPA.
Schools (NCES district)
- District
- Chsd 155
- NCES district ID
- 1711370
- Math proficiency
- 41% ▼ -9.00%
- Reading proficiency
- 42% ▼ -7.00%
- Median HH income
- $87,560
- Composite
- 39.33/100
- National rank
- #3982
- State rank
- #98 of 620 in IL
Livability — Crystal Lake
- Score
- 82/100
- State rank
- #80
- US rank
- #1289
Category grades
Schools grade is shown separately in the Schools card above.
Census & demographics
- Census place
- Crystal Lake, IL
- County
- McHenry County · 204,279 people
- City population
- 48,590
- Metro
- Chicago-Naperville-Elgin, IL-IN-WI
- Population (ZIP)
- 48,590
- Household income
- $109,016
- Rent vs Own
- Severe rent burden
- 922.0
Population outlook (McHenry County) Hauer SSP2
- Today (2025)
- 305,342 people
- By 2030
- 301,491 · -1.3%
- By 2040
- 288,211 · -5.6%
- By 2050
- 268,430 · -12.1%
- By 2075
- 226,209 · -25.9%
- By 2100
- 181,247 · -40.6%
Race, ethnicity, and origin ACS 2023
- Neighborhood character
- Predominantly White (80%)
- Race & ethnicity
- White 80% Hispanic / Latino 13% Two or more races 8% Asian 3%
- Hispanic origin (detail)
- Mexican 9% Puerto Rican 1%
- Common ancestry
- Romanian 12% Portuguese 2% Lithuanian 2%
- Foreign-born
- 10% · Canada, Jamaica, Vietnam
- Languages at home
- 85% English-only · Spanish 10% Russian/Polish/Slavic 2% Other Indo-European 1%
Political lean MEDSL · McHenry
- 2024 margin
- Lean R (+5.3) · D 46.6% · R 51.9% · Other 1.5%
- 2008→2024 swing
- -10.6pp toward R · 2008: 5.3pp · 2024: -5.3pp
- All cycles
- 2024: R+5.3 2020: R+2.5 2016: R+8.1 2012: R+8.8 2008: D+5.3
Not yet ingested
- Civics
- —
Market trends
- HPI YoY
- ▼ -247.92%
- Current HPI
- 207.5209
- Rent YoY
- ▲ 3.89%
- Metro
- Chicago-Naperville-Elgin, IL-IN-WI
- State GDP YoY
- ▲ 1.59%
- F500 in state
- 60
Industry mix (Fortune 500 HQ in IL)
| Industry | F500 HQs | Revenue |
|---|---|---|
| Insurance | 4 | $201B |
|
||
| Consumer Goods | 4 | $87B |
|
||
| Industrial Machinery | 3 | $64B |
|
||
| Healthcare | 2 | $55B |
|
||
| Retail / Pharmacy | 1 | $148B |
|
||
| Agriculture / Food | 1 | $86B |
|
||
Price history
+587.5% since first listed8 events — show timeline
- 2026-06-12 Coming Soon $220,000 MRED as Distributed by MLS Grid
- 2024-12-31 Contingent — MRED as Distributed by MLS Grid
- 2024-12-30 Listing Removed — MRED as Distributed by MLS Grid
- 2024-12-03 Listed — MRED as Distributed by MLS Grid
- 2020-12-30 Sold (MLS) $39,000 MRED as Distributed by MLS Grid
- 2020-12-10 Pending — MRED as Distributed by MLS Grid
- 2020-11-25 Listed $37,500 MRED as Distributed by MLS Grid
- 1993-12-13 Sold (Public Records) $32,000 Public Records
Property tax history
+4.1%/yrLatest (2024): $3,643 · +4.5% YoY. Source: county tax records.
Cash-flow waterfall
monthlySold comps — $/sqft
last 12 mo · ≤1 miLoading sold comps…