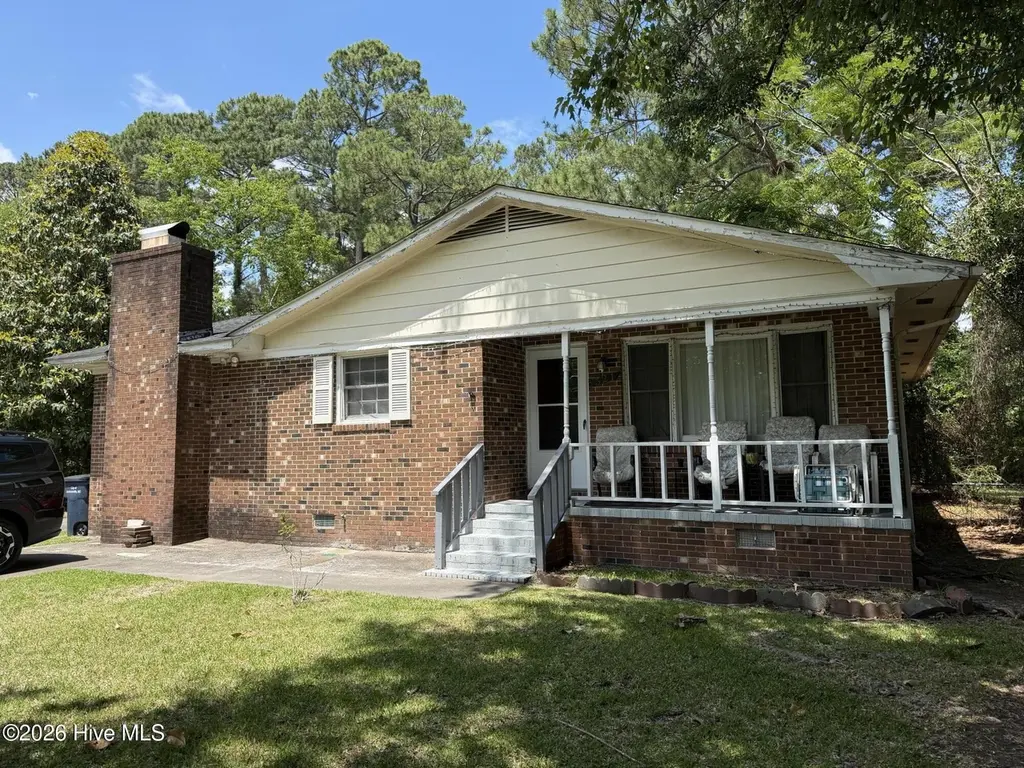
521 Brynn Marr Rd · Jacksonville, NC
Flood risk 1/10 · Minimal
- FEMA flood zone
- X (unshaded)
- Chance of flooding over 30 yrs
- 0.0%
- Est. flood insurance / yr
- $507 – $1,088
Fire risk 3/10 · Minor
- Est. fire insurance / yr
- $906 – $1,684
Heat risk 8/10 · Major
- Hot days now (above 106°F)
- 7 days/yr
- Hot days in 30 yrs
- 18 days/yr
Wind risk 8/10 · Major
- Chance of severe wind over 30 yrs
- 99.0%
Air-quality risk 3/10 · Minor
- Unhealthy air days now
- 2 days/yr
- Unhealthy air days in 30 yrs
- 4 days/yr
Risk factors via First Street. Map © Google.
Why this score? — see what drove the D+ grade
The composite is a weighted blend of 9 inputs, each scored 0–100. Each bar is that input's sub-score; the figure is the points it added to the 100-point composite (weight × sub-score).
- ARV discount +15.0/15.0
- Cash flow +14.1/30.0
- DSCR +4.3/10.0
- Schools +3.9/10.0
- Livability +3.6/5.0
- Rent growth +3.5/5.0
- 1% rule +3.2/10.0
- Condition / age +2.5/5.0
- Appreciation +0.0/10.0
$197,500
🖨 Deal sheet (PDF) 📄 Offer letter ✓ Due diligence
Listing remarks
Charming 3-bedroom, 2-bath home located within city limits featuring a spacious family room with a cozy fireplace, perfect for relaxing or entertaining. The backyard offers beautiful mature trees providing shade and privacy. This home has great potential and just needs a little TLC to make it truly shine. Conveniently located near shopping, dining, and hospital -- a wonderful opportunity to add your personal touch.
Key facts
- Shade and privacy
- Cozy fireplace
- Spacious family room
Tags
Neighborhood map
What this means for you Summary
Snapshot
- This is a 3-bed/1.5-bath single-family listed at $198k.
Deal economics
- At list price, monthly cash flow is $29 ($346/yr) — positive.
- The deal already cash-flows at list — no discount required.
- To meet the 1% rule (rent ≥ 1% of price), the offer needs to be $162k (18.0% below list).
- Recommended offer: $162k (18.0% below list) — sets the bar for 1% rule.
- Cap rate 6.5% vs local median 4.4% in Jacksonville — top-decile yield for the area; either an underpriced asset or a hidden risk that comps aren't pricing in. Stress-test before assuming the spread holds.
Location & tenants
- Location reads 71/100 on livability (#111 in NC) — a middle-class / working-renter tenant base. Strengths: cost of living A+, housing A+, health & safety A+; Watch: employment D, crime F, amenities F.
- Onslow County Schools (other): math 42% / reading 49% proficiency, ranked #84 of 178 in NC (top 47%) — families likely to look elsewhere, expect single-tenant / working-renter base with shorter leases.
- Zoned schools: Bell Fork Elementary (math 47% / reading 37%, grade F, #633 of 1,410 statewide, top 48%, 553 students, 71% FRL); Jacksonville Commons Middle (math 39% / reading 47%, grade D-, #191 of 475 statewide, top 41%, 1,011 students, 64% FRL); Northside High (math 67% / reading 55%, grade C+, #202 of 535 statewide, top 39%, 1,097 students, 54% FRL) — zoned schools average 63% FRL vs 37% district-wide (26 pts higher); higher-poverty schools than district average — tighter screening recommended.
- Market conditions: Rents rising (+3.9%/yr); 612 active listings in the ZIP; 8 comparable units currently listed for rent nearby; rentals at typical pace (median 23d on market — plan ~3-4 weeks tenant-placement turnaround); 1,246 units permitted in Onslow County in 2024 (0 in 5+ unit buildings).
- This rent runs 31% of the median local income ($64k/yr) — at the standard rent-burdened threshold; future hikes will face affordability resistance.
Forward outlook
- Local home prices are declining (-3.0%/yr); year-one equity from $1k of loan paydown is wiped out by about $6k of value loss. Plan a longer hold.
Negotiation context
- Only 9 days on market — expect competitive offers; lowballing is unlikely to land.
- Current owner paid $84k; list at $198k implies a 137% gain — meaningful room to come down on a strong offer.
Risks & watch-outs
- Climate carrying-cost: severe wind risk, 99% chance of damaging wind over 30y; extreme-heat days projected 7→18/yr by 2055 (HVAC capex compounding) — expect insurance premiums to compound above CPI over the hold.
Questions for the listing agent
- Built in 1969 — when were the roof, HVAC, electrical panel, plumbing, and water heater last replaced?
- Is there a deadline driving the sale (1031 exchange, divorce, estate, relocation)? That informs how much negotiation room exists.
- Crime grade is F in this area — have there been break-ins, vandalism, or insurance claims at this property in the last 3 years? What carrier currently insures it and at what premium?
- The area grade is low — what's the realistic commute time and amenity access for the typical tenant pool here? Any planned neighborhood developments (good or bad) we should know about?
- What's the average days-on-market for RENTAL listings here right now (not sales)? A rising rental-DOM trend means longer vacancies and softer asking-rent achievability than the comps imply.
- What's the recent tenant-quality profile in this submarket — average credit score on applications, eviction rate, late-payment / NSF rate, and stable-employment percentage? A property-management company in the area should have these aggregated.
- How much new for-sale + rental construction is in the pipeline within 1–3 miles? Heavy new supply typically softens prices + rents 12–24 months out; constrained supply supports both.
Investment metrics
- 1% rule
- 0.82% ✗
- Cap rate
- 6.47%
- Cash-on-cash
- 0.63%
- DSCR
- 1.03
- GRM
- 10.2
CMA / ARV
- ARV (on-the-fly)
- $265,052
- Comps found
- 12
Show comp detail 12 sales within ~0.75 mi
| Address | Dist | Beds/Ba | Sqft | Sold | Price | $/sf | Match |
|---|---|---|---|---|---|---|---|
| 125 Linda Loop | 0.34mi | 3/2.0 | 1,531 (-1%) | 2mo | $138,000 | $90 | 79 |
| 414 Brynn Marr Rd | 0.28mi | 3/2.0 | 1,393 (-10%) | 4mo | $240,000 | $172 | 66 |
| 700 Shadowridge Rd | 0.49mi | 3/2.0 | 1,662 (+8%) | 1mo | $265,000 | $159 | 62 |
| 107 Wedgewood Dr | 0.28mi | 3/2.0 | 1,315 (-15%) | 2mo | $242,000 | $184 | 59 |
| 405 Thomas Dr | 0.39mi | 3/2.0 | 1,363 (-12%) | 3mo | $257,000 | $189 | 58 |
| 904 Huff Dr | 0.67mi | 3/2.0 | 1,624 (+5%) | 1mo | $279,000 | $172 | 57 |
| 133 Silver Leaf Dr | 0.70mi | 3/2.5 | 1,500 (-3%) | 3mo | $190,500 | $127 | 57 |
| 220 E Lakeridge Lndg | 0.52mi | 3/2.0 | 1,354 (-12%) | 1mo | $265,000 | $196 | 53 |
| 216 E Lakeridge Lndg | 0.51mi | 3/2.0 | 1,350 (-12%) | 1mo | $254,000 | $188 | 52 |
| 512 E Springhill Ter | 0.42mi | 4/2.0 (+1) | 1,723 (+12%) | 2mo | $280,000 | $163 | 52 |
| 101 Huff Ct | 0.71mi | 3/2.0 | 1,648 (+7%) | 3mo | $277,000 | $168 | 51 |
| 600 Oakwood Ave | 0.60mi | 4/2.5 (+1) | 1,738 (+13%) | 4mo | $265,000 | $152 | 39 |
Match score weights: distance 35% · size 25% · config 20% · recency 20%. Top-matched comps best support the ARV.
Projected returns pro-forma
-3.0% appreciation · 3.86% rent growth · sell at horizon
- IRR
- -14.4%
- Equity multiple
- 0.48×
- Total profit
- $-28,802
- Equity at exit
- $29,448
- IRR
- -4.5%
- Equity multiple
- 0.69×
- Total profit
- $-17,005
- Equity at exit
- $17,076
Cash invested: $55,300 (down + closing). Projections, not guarantees.
Landlord ↔ Tenant lean methodology
- Overall (STATE)
- 85 Strongly Landlord-Friendly
- State North Carolina
- 85 Strongly Landlord-Friendly · R+3
- County
- — inherits STATE
- City
- — inherits STATE
ZIP-level market 28546
- Home prices YoY
- -19.3%
- Rents YoY
- 3.9%
- Active inventory
- 612
- Price-to-rent
- 10.2×
Monthly cashflow live
- Estimated rent
- $1,619 high interval (Pro) →
- Mortgage (P&I)
- −$1,036
- Tax from tax record
- −$132 /mo · $1,585/yr
- Insurance
- −$82
- HOA
- −$0
- Vacancy / Maint / Mgmt
- −$340
- Net cashflow
- $29
Break-even live
Sensitivity live
| Price | -10% $141 | -5% $85 | +0% $29 | +5% $-27 | +10% $-83 |
|---|---|---|---|---|---|
| Rent | -10% $-99 | -5% $-35 | +0% $29 | +5% $93 | +10% $157 |
| Rate | -1.0pp $128 | -0.5pp $79 | base $29 | +0.5pp $-22 | +1.0pp $-74 |
UW: 25.0% down · 7.5% · 30yr · 1.5% tax · 5.0% vac · 8.0% maint · 8.0% mgmt
Financing live
Cash to close
- Down payment
- $49,375
- Closing costs
- $5,925
- Reserves months
- —
- Total cash needed
- —
Loan-product check · same deal, 3 products live
Conventional
25% down · 7.5% · 30yr
- Down + closing
- —
- Monthly P&I
- —
- Monthly cashflow
- —
- DSCR
- —
- Eligible?
- —
Personal DTI + credit; lowest rate.
DSCR
20% down · 8.5% · 30yr
- Down + closing
- —
- Monthly P&I
- —
- Monthly cashflow
- —
- DSCR
- —
- Eligible?
- —
No personal income docs; deal must DSCR.
Hard money
10% down · 12.0% · 12mo
- Down + closing
- —
- Monthly P&I
- —
- Monthly cashflow
- —
- DSCR
- —
- Eligible?
- —
Short-term bridge; refi at stabilization.
Rent comps 8 comps
| Address | Beds | Baths | Sqft | Rent | $/sqft | DOM | Units | Dist |
|---|---|---|---|---|---|---|---|---|
| 507 Birchwood Ct Jacksonville, NC | 3.0 | 2.0 | 1314 | $1,525 | $1.16 | 15d | 1 | 0.18mi |
| 120 Palace Cir Jacksonville, NC | 3.0 | 2.5 | 1378 | $1,400 | $1.02 | 23d | 1 | 0.28mi |
| 821 Shadowridge Rd Jacksonville, NC | 3.0 | 2.0 | 1488 | $750 | $0.50 | 23d | 1 | 0.71mi |
| 553 Corbin St Lot A-633 Jacksonville, NC | 3.0 | 2.0 | 1216 | $48,000 | $39.47 | 23d | 1 | 0.72mi |
| 190 Valencia Dr Unit 110A Jacksonville, NC | 2.0 | 2.0 | 1130 | $1,425 | $1.26 | 23d | 1 | 0.90mi |
| 236 White Oak Blvd Jacksonville, NC | 3.0 | 2.0 | 1275 | $1,650 | $1.29 | 23d | 1 | 1.04mi |
| 102 Riverbirch Pl Jacksonville, NC | 3.0 | 2.5 | 1520 | $2,400 | $1.58 | 23d | 1 | 1.13mi |
| 110 Sycamore Dr Jacksonville, NC | 3.0 | 2.0 | 1433 | $1,750 | $1.22 | 23d | 1 | 1.34mi |
Listing history 5 events
-
2026-06-01status $197,500 Pending 9 DOM
-
2026-05-31days on market $197,500 Active 9 DOM
-
2026-05-30days on market $197,500 Active 8 DOM
-
2026-05-21$197,500 Active
-
2001-11-27soldstatus $83,500
ⓘ Source: listings_history table (triggers on properties + properties_extension) + one-shot
backfill from property_details.listing_events for pre-trigger history.
Tax reassessment forecast NC · Resets to sale price
- Current annual tax
- $1,585 · $132/mo
- Projected year-2 tax
- $1,620 · $135/mo
- Expected delta
- +$34/yr (+$3/mo · 2.1%)
ⓘ Screening estimate from a state-policy table — verify with the county assessor before closing.
Climate risk First Street
- Flood 1/10 Low FEMA zone X (unshaded) · 0% chance over 30 yrs
- Wildfire 3/10 Moderate
- Heat 8/10 Severe 7 d/yr ≥106°F today · 18 d/yr by 30 yrs out
- Wind 8/10 Severe 99% chance of damaging wind over 30 yrs
- Air quality 3/10 Moderate 2 unhealthy d/yr today · 4 by 30 yrs out
Nearby sold comps map
Loading sold comps map…
Walkable amenities ~0.75 mi
Loading nearby amenities…
Taxation est. · year 1
- Rental income
- $19,427
- − Mortgage interest
- −$11,063
- − Property taxes
- −$1,585
- − Insurance
- −$988
- − Repairs & maintenance
- −$1,554
- − Management
- −$1,554
- − Depreciation
- −$5,745
- Taxable loss
- −$3,063
- Est. tax savings @ 24.0%
- +$735
- After-tax cash flow
- $1,081/yr
For passive investors: Depreciation is non-cash, so a rental often shows a tax loss while cash-flowing — sheltering income. Rental losses are passive: they offset passive income freely, and up to $25,000/yr can offset ordinary (W-2) income if you actively participate and your MAGI is under $100k (phasing out to $0 by $150k); unused losses carry forward. On sale, claimed depreciation is recaptured at up to 25%, and gains may owe capital-gains tax (a 1031 exchange can defer both). Figures are a year-1 estimate at your 24.0% rate — not tax advice; consult a CPA.
Schools (NCES district)
- District
- Onslow County Schools
- NCES district ID
- 3703450
- Math proficiency
- 42% ▲ 6.00%
- Reading proficiency
- 49% ▲ 5.00%
- Median HH income
- $46,076
- Composite
- 38.66/100
- National rank
- #4148
- State rank
- #84 of 178 in NC
Livability — Jacksonville
- Score
- 71/100
- State rank
- #111
- US rank
- #6991
Category grades
Schools grade is shown separately in the Schools card above.
Census & demographics
- Census place
- Jacksonville, NC
- County
- Onslow County · 164,453 people
- Metro
- Jacksonville, NC
- Population (ZIP)
- 47,256
- Household income
- $63,561
- Rent vs Own
- Severe rent burden
- 1830.0
Population outlook (Onslow County) Hauer SSP2
- Today (2025)
- 189,789 people
- By 2030
- 194,463 · +2.5%
- By 2040
- 193,629 · +2.0%
- By 2050
- 193,248 · +1.8%
- By 2075
- 196,995 · +3.8%
- By 2100
- 201,513 · +6.2%
Race, ethnicity, and origin ACS 2023
- Neighborhood character
- Diverse neighborhood (Simpson 0.62)
- Race & ethnicity
- White 57% Black 18% Hispanic / Latino 16% Two or more races 13% Asian 2%
- Hispanic origin (detail)
- Mexican 5% Puerto Rican 5% Dominican 1%
- Common ancestry
- Romanian 1% Serbian 1% Slovak 1%
- Foreign-born
- 5% · Canada, South Korea
- Languages at home
- 89% English-only · Spanish 8% German/W. Germanic 1% Tagalog/Filipino 1%
Political lean MEDSL · Onslow
- 2024 margin
- Solid R (+35.9) · D 31.5% · R 67.5% · Other 1.0%
- 2008→2024 swing
- -14.5pp toward R · 2008: -21.5pp · 2024: -35.9pp
- All cycles
- 2024: R+35.9 2020: R+30.2 2016: R+34.6 2012: R+27.0 2008: R+21.5
Not yet ingested
- Civics
- —
Market trends
- HPI YoY
- ▼ -50.75%
- Current HPI
- 211.9993
- Rent YoY
- ▲ 3.86%
- Metro
- Jacksonville, NC
- State GDP YoY
- ▲ 3.28%
- F500 in state
- 26
Industry mix (Fortune 500 HQ in NC)
| Industry | F500 HQs | Revenue |
|---|---|---|
| Financial Services | 2 | $213B |
|
||
| Retail | 2 | $95B |
|
||
| Industrial Conglomerate | 1 | $38B |
|
||
| Metals / Steel | 1 | $35B |
|
||
| Utilities | 1 | $30B |
|
||
| Industrial Machinery | 1 | $19B |
|
||
Price history
+136.5% since first listed2 events — show timeline
- 2026-05-21 Listed $197,500 Hive MLS
- 2001-11-27 Sold (Public Records) $83,500 Public Records
Property tax history
+1.0%/yrLatest (2025): $1,585 · +0.0% YoY. Source: county tax records.
Cash-flow waterfall
monthlySold comps — $/sqft
last 12 mo · ≤1 miLoading sold comps…