 Fourplex
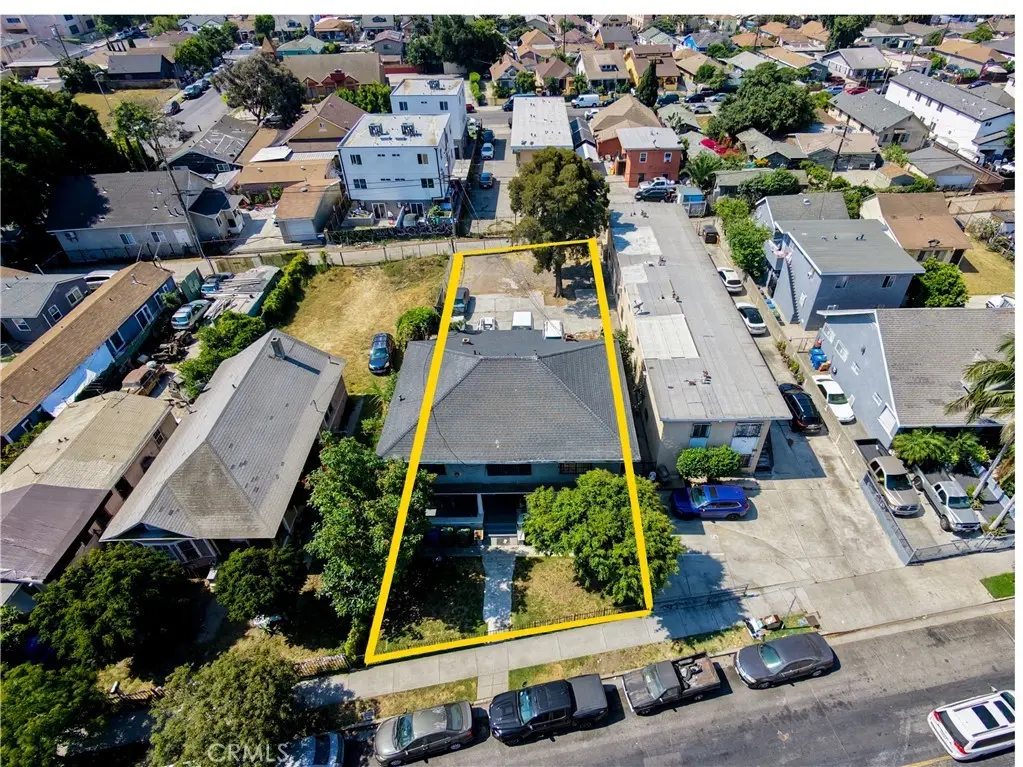
786 E 41st · Los Angeles, CA
Flood risk 1/10 · Minimal
- FEMA flood zone
- X (shaded)
- Chance of flooding over 30 yrs
- 0.0%
- Est. flood insurance / yr
- $507 – $1,088
Fire risk 1/10 · Minimal
- Est. fire insurance / yr
- $659 – $1,223
Heat risk 6/10 · Moderate
- Hot days now (above 91°F)
- 7 days/yr
- Hot days in 30 yrs
- 22 days/yr
Wind risk 1/10 · Minimal
- Chance of severe wind over 30 yrs
- —
Air-quality risk 5/10 · Moderate
- Unhealthy air days now
- 7 days/yr
- Unhealthy air days in 30 yrs
- 7 days/yr
Risk factors via First Street. Map © Google.
Why this score? — see what drove the B- grade
The composite is a weighted blend of 9 inputs, each scored 0–100. Each bar is that input's sub-score; the figure is the points it added to the 100-point composite (weight × sub-score).
- Cash flow +30.0/30.0
- 1% rule +10.0/10.0
- DSCR +10.0/10.0
- ARV discount +5.8/15.0
- Schools +3.6/10.0
- Livability +3.4/5.0
- Condition / age +2.5/5.0
- Rent growth +0.5/5.0
- Appreciation +0.0/10.0
$759,800
🖨 Deal sheet 📄 Offer letter ✓ Due diligence
Multi-family units
County records classify this as Multi-Family (2-4 Unit). Listing-text estimate: 4 units. confirmed
Listing remarks MLS
TERRIFIC INVESTMENT REAL ESTATE OPPORTUNITY WITH POTENTIAL RENTAL UPSIDE OF 20% +/-!!!! All units are one bed/one bath, plus two of the four units have a large den. Property features newer exterior paint and updated electrical system. Additionally the property is individually metered for gas/electricity and units have individual water heaters (some units have washer/dryer hookups). Ample amount of parking is available for tenant convenience in the rear of the building (8+ open spaces). Some of the units h
Key facts
- High demand corridor
- Tenant occupied
- Two story quadruplex
Tags
Property features AI
Finance
- Other: Total number of buildings: 1
- Financial info: Gross scheduled income: $74,722; Gross income: $74,722; Net operating income: $53,318; Operating expenses: $21,405 (includes $1,000 maintenance, $1,766 insurance, $4,391 water/sewer, $1,500 gardener); Property is subject to rent control; Tenants pay all utilities; Building area total: 2,730 (units of area recorded)
Exterior
- Parking: Driveway parking available
- Utilities: Public sewer; District/public water; One water meter; Four separate gas meters; Four separate electric meters
- Home design: Attached multi-unit property; Two-story building; Total of 4 residential units; 2+ common walls
- Construction: Year built sourced from assessor
- Exterior features: No pool; Neighborhood includes gutters, curbs, street lighting, storm drains and sidewalks; Walking/riding stables noted in community features; Urban setting
Interior
- Kitchen: Kitchens in each unit (appliances not specified)
- Bedrooms: Four units with 1 bedroom each
- Bathrooms: Each unit has 1 full bathroom
- Interior features: Front entry; Two-level layout; Entry on first level
- Laundry & utility: No on-site laundry specified
Neighborhood map
What this means for you Summary
Snapshot
- This is a 4 × 4-bed/4.0-bath units multifamily listed at $760k.
Deal economics
- At list price, monthly cash flow is $4k ($52k/yr) — positive. Per door: $1k/mo.
- The deal already cash-flows at list — no discount required.
- Meets the 1% rule at list price ($12k rent vs $760k).
- Cap rate 13.1% vs local median 2.1% in Los Angeles — top-decile yield for the area; either an underpriced asset or a hidden risk that comps aren't pricing in. Stress-test before assuming the spread holds.
Location & tenants
- Location reads 68/100 on livability (#273 in CA) — a middle-class / working-renter tenant base. Strengths: amenities A+, commute A+, employment B; Watch: health & safety C-, schools D+, crime F.
- Los Angeles Unified (urban): math 29% / reading 54% proficiency, ranked #223 of 517 in CA (top 43%) — families likely to look elsewhere, expect single-tenant / working-renter base with shorter leases; 67% free/reduced lunch — lower-income household profile, screen leases tightly.
- Market conditions: Rents falling (-8.2%/yr); 126 active listings in the ZIP; 14 comparable units currently listed for rent nearby; rentals lingering (median 44d on market — plan ~5-8 weeks vacancy on turnover, expect pricing pressure); 57% of comp listings sitting > 30 days — soft ceiling on asking rent; 19,697 units permitted in Los Angeles County in 2024 (9,426 in 5+ unit buildings).
- At $11,863/mo this rent would consume 241% of the median local household income ($59k/yr) (locally 5930% of renters already pay >50% of income on rent) — very limited rent-growth headroom before tenants either downsize or default.
Forward outlook
- Local home prices are declining (-3.0%/yr); year-one equity from $5k of loan paydown is wiped out by about $23k of value loss. Plan a longer hold.
- Los Angeles County population projected at +9% by 2050 — modest demand growth; plan on rents tracking national, not racing it.
- At projected returns (-3.0% appreciation + 0.0% rent growth), your $213k cash investment doubles in ~6 years — after that, you're playing with house money.
Negotiation context
- Only 3 days on market — expect competitive offers; lowballing is unlikely to land.
- 8 sale attempts since 21y ago; this cycle's ask is 17% above the opening price — seller raised mid-cycle; expect resistance to lowballs.
- Current owner paid $650k; 17% above their basis — modest negotiation headroom, anchor on the comps not their cost.
Risks & watch-outs
- Watch-outs: built in 1919 — expect roof / HVAC / electrical / plumbing capex.
- Climate carrying-cost: extreme-heat days projected 7→22/yr by 2055 (HVAC capex compounding) — expect insurance premiums to compound above CPI over the hold.
Questions for the listing agent
- Can we see the unit-by-unit rent roll, current vacancy, and any below-market leases? What's the average tenancy length?
- What capital expenditures (roof, boiler, parking lot, exteriors) have been made in the last 5 years, and what's planned in the next 2?
- Built in 1919 — when were the roof, HVAC, electrical panel, plumbing, and water heater last replaced?
- Is there a deadline driving the sale (1031 exchange, divorce, estate, relocation)? That informs how much negotiation room exists.
- Schools are D-rated, which usually means shorter tenancies and higher turnover. Who's the typical renter profile here, and what's been the actual vacancy rate?
- Crime grade is F in this area — have there been break-ins, vandalism, or insurance claims at this property in the last 3 years? What carrier currently insures it and at what premium?
- What's the average days-on-market for RENTAL listings here right now (not sales)? A rising rental-DOM trend means longer vacancies and softer asking-rent achievability than the comps imply.
- What's the recent tenant-quality profile in this submarket — average credit score on applications, eviction rate, late-payment / NSF rate, and stable-employment percentage? A property-management company in the area should have these aggregated.
- How much new apartment / multifamily construction is in the pipeline within 1–3 miles? Heavy new supply (>2% of stock underway) typically softens rents 12–24 months out; light construction supports rent growth.
Investment metrics
- 1% rule
- 1.56% ✓
- Cap rate
- 13.10%
- Cash-on-cash
- 24.31%
- DSCR
- 2.08
- GRM
- 5.3
CMA / ARV
- ARV (on-the-fly)
- $731,640
- Comps found
- 9
Show comp detail 9 sales within ~0.75 mi
| Address | Dist | Beds/Ba | Sqft | Sold | Price | $/sf | Match |
|---|---|---|---|---|---|---|---|
| 835 E 41st St | 0.06mi | 6/— | 2,376 (-13%) | 5mo | $390,000 | $164 | 71 |
| 456 E 43rd Pl | 0.40mi | 5/4.0 (-1) | 2,640 (-3%) | 3mo | $935,000 | $354 | 68 |
| 631 E 47th St | 0.58mi | 7/4.0 (+1) | 2,912 (+7%) | 3mo | $820,000 | $282 | 54 |
| 511 E 33rd St | 0.61mi | 6/4.0 | 2,848 (+4%) | 16mo | $600,000 | $211 | 51 |
| 687 E 49th | 0.70mi | 6/4.0 | 3,000 (+10%) | 1mo | $805,000 | $268 | 50 |
| 1138 E 45th St | 0.57mi | 5/4.0 (-1) | 2,460 (-10%) | 2mo | $575,000 | $234 | 50 |
| 4245 Wall St | 0.60mi | 5/4.5 (-1) | 2,954 (+8%) | 10mo | $810,000 | $274 | 43 |
| 1241 E 43rd | 0.58mi | 5/3.0 (-1) | 2,362 (-14%) | 3mo | $555,000 | $235 | 39 |
| 3215 Trinity St | 0.64mi | 5/3.0 (-1) | 2,472 (-10%) | 17mo | $750,000 | $303 | 31 |
Match score weights: distance 35% · size 25% · config 20% · recency 20%. Top-matched comps best support the ARV.
Projected returns pro-forma
-3.0% appreciation · 0.0% rent growth · sell at horizon
- IRR
- 14.2%
- Equity multiple
- 1.55×
- Total profit
- $116,636
- Equity at exit
- $113,289
- IRR
- 20.7%
- Equity multiple
- 2.51×
- Total profit
- $320,874
- Equity at exit
- $65,694
Cash invested: $212,744 (down + closing). Projections, not guarantees.
Landlord ↔ Tenant lean methodology
- Overall (CITY)
- 0 Strongly Tenant-Friendly
- State California
- 18 Strongly Tenant-Friendly · D+13
- County
- — inherits STATE
- City Los Angeles
- 0 Strongly Tenant-Friendly · D+22
ZIP-level market 90011
- Rents YoY
- -8.2%
- Active inventory
- 126
- Price-to-rent
- 21.4×
Monthly cashflow live
- Estimated rent
- $11,863 medium interval (Pro) →
- Mortgage (P&I)
- −$3,984
- Tax from tax record
- −$761 /mo · $9,138/yr
- Insurance
- −$317
- HOA
- −$0
- Vacancy / Maint / Mgmt
- −$2,491
- Net cashflow
- $4,309
Break-even live
4-unit breakdown (identical units grouped — click to expand)
| Units | Beds | Baths | Est. rent |
|---|---|---|---|
| 4× units | 4 | 4 | $11,864 |
| #1 | 4 | 4 | $2,966 |
| #2 | 4 | 4 | $2,966 |
| #3 | 4 | 4 | $2,966 |
| #4 | 4 | 4 | $2,966 |
| Total (4 units) | $11,863 | ||
UW: 25.0% down · 7.5% · 30yr · 1.5% tax · 5.0% vac · 8.0% maint · 8.0% mgmt
Financing live
Cash to close
- Down payment
- $189,950
- Closing costs
- $22,794
- Reserves months
- —
- Total cash needed
- —
Loan-product check · same deal, 3 products live
Conventional
25% down · 7.5% · 30yr
- Down + closing
- —
- Monthly P&I
- —
- Monthly cashflow
- —
- DSCR
- —
- Eligible?
- —
Personal DTI + credit; lowest rate.
DSCR
20% down · 8.5% · 30yr
- Down + closing
- —
- Monthly P&I
- —
- Monthly cashflow
- —
- DSCR
- —
- Eligible?
- —
No personal income docs; deal must DSCR.
Hard money
10% down · 12.0% · 12mo
- Down + closing
- —
- Monthly P&I
- —
- Monthly cashflow
- —
- DSCR
- —
- Eligible?
- —
Short-term bridge; refi at stabilization.
Rent comps 14 comps
| Address | Beds | Baths | Sqft | Rent | $/sqft | DOM | Units | Dist |
|---|---|---|---|---|---|---|---|---|
| 839 E 32nd St Los Angeles, CA | 5.0 | 4.0 | 2150 | $4,000 | $1.86 | 16d | 1 | 0.48mi |
| 839 E 32nd St Unit 32(841) Los Angeles, CA | 5.0 | 4.0 | 2150 | $4,000 | $1.86 | 24d | 1 | 0.48mi |
| 3839 Woodlawn Ave Unit 1/2 Los Angeles, CA | 6.0 | 3.0 | 1915 | $4,500 | $2.35 | 4d | 1 | 0.67mi |
| 1440 E 42nd St Los Angeles, CA | 5.0 | 3.0 | 1849 | $3,895 | $2.11 | 43d | 1 | 0.78mi |
| 618 E 28th St Los Angeles, CA | 5.0 | 5.0 | 1900 | $4,000 | $2.11 | 43d | 1 | 0.79mi |
| 751 E Adams Blvd Los Angeles, CA | 5.0 | 5.5 | 2050 | $6,000 | $2.93 | 43d | 1 | 0.84mi |
| 1142 E 50th St Los Angeles, CA | 5.0 | 3.0 | 1857 | $3,900 | $2.10 | 43d | 1 | 0.86mi |
| 213 W 43rd St Los Angeles, CA | 5.0 | 4.0 | 2302 | $4,200 | $1.82 | 4d | 1 | 0.87mi |
| 1635 E 33rd St Los Angeles, CA | 5.0 | 4.0 | 3000 | $750 | $0.25 | 24d | 1 | 1.02mi |
| 238 W 46th St Los Angeles, CA | 5.0 | 3.0 | 1848 | $3,890 | $2.10 | 24d | 1 | 1.02mi |
| 116 W 50th St Los Angeles, CA | 5.0 | 3.0 | 1858 | $4,000 | $2.15 | 43d | 1 | 1.08mi |
| 114 W 50th St Los Angeles, CA | 5.0 | 3.0 | 1858 | $4,000 | $2.15 | 43d | 1 | 1.09mi |
| 1011 56th St Los Angeles, CA | 5.0 | 3.0 | 1993 | $4,200 | $2.11 | 43d | 1 | 1.21mi |
| 122 E 24th St Los Angeles, CA | 5.0 | 3.0 | 1819 | $4,200 | $2.31 | 43d | 1 | 1.21mi |
Listing history 6 events
-
2026-06-18days on market $759,800 Active 3 DOM
-
2026-06-17days on market $759,800 Active 2 DOM
-
2026-06-15statusdays on market $759,800 Active 1 DOM
-
2026-06-15days on market $759,800 Coming Soon 3 DOM
-
2026-06-13remarks 699-char remark
-
2026-06-13$759,800 Coming Soon 1 DOM
ⓘ Source: listings_history table (triggers on properties + properties_extension) + one-shot
backfill from property_details.listing_events for pre-trigger history.
Tax reassessment forecast CA · Resets to sale price
- Current annual tax
- $9,138 · $761/mo
- Projected year-2 tax
- $9,138 · $761/mo
- Expected delta
- $0/yr ($0/mo · 0.0%)
ⓘ Screening estimate from a state-policy table — verify with the county assessor before closing.
Climate risk First Street
- Flood 1/10 Low FEMA zone X (shaded) · 0% chance over 30 yrs
- Wildfire 1/10 Low
- Heat 6/10 Major 7 d/yr ≥91°F today · 22 d/yr by 30 yrs out
- Wind 1/10 Low
- Air quality 5/10 Major 7 unhealthy d/yr today · 7 by 30 yrs out
Nearby sold comps map
Loading sold comps map…
Walkable amenities ~0.75 mi
Loading nearby amenities…
Taxation est. · year 1
- Rental income
- $142,356
- − Mortgage interest
- −$42,561
- − Property taxes
- −$9,138
- − Insurance
- −$3,799
- − Repairs & maintenance
- −$11,388
- − Management
- −$11,388
- − Depreciation
- −$22,103
- Taxable income
- $41,979
- Est. tax owed @ 24.0%
- −$10,075
- After-tax cash flow
- $41,636/yr
For passive investors: Depreciation is non-cash, so a rental often shows a tax loss while cash-flowing — sheltering income. Rental losses are passive: they offset passive income freely, and up to $25,000/yr can offset ordinary (W-2) income if you actively participate and your MAGI is under $100k (phasing out to $0 by $150k); unused losses carry forward. On sale, claimed depreciation is recaptured at up to 25%, and gains may owe capital-gains tax (a 1031 exchange can defer both). Figures are a year-1 estimate at your 24.0% rate — not tax advice; consult a CPA.
Schools (NCES district)
- District
- Los Angeles Unified
- NCES district ID
- 0622710
- Math proficiency
- 29% ▼ -4.00%
- Reading proficiency
- 54% ▲ 10.00%
- Median HH income
- $50,403
- Composite
- 35.67/100
- National rank
- #4875
- State rank
- #223 of 517 in CA
Livability — Los Angeles
- Score
- 68/100
- State rank
- #273
- US rank
- #9237
Category grades
Schools grade is shown separately in the Schools card above.
Census & demographics
- Census place
- Los Angeles, CA
- County
- Los Angeles County · 9,444,647 people
- City population
- 3,838,149
- Metro
- Los Angeles-Long Beach-Anaheim, CA
- Population (ZIP)
- 100,113
- Household income
- $59,017
- Rent vs Own
- Severe rent burden
- 5930.0
Population outlook (Los Angeles County) Hauer SSP2
- Today (2025)
- 10,940,515 people
- By 2030
- 11,256,481 · +2.9%
- By 2040
- 11,729,929 · +7.2%
- By 2050
- 11,948,407 · +9.2%
- By 2075
- 11,818,114 · +8.0%
- By 2100
- 10,842,928 · -0.9%
Race, ethnicity, and origin ACS 2023
- Neighborhood character
- Predominantly Hispanic (92%)
- Race & ethnicity
- Hispanic / Latino 92% Two or more races 26% Black 6% Native American 2%
- Hispanic origin (detail)
- Mexican 67%
- Foreign-born
- 45% · Canada, South Korea
- Languages at home
- 13% English-only · Spanish 86%
Political lean MEDSL · Los Angeles
- 2024 margin
- Solid D (+32.9) · D 64.8% · R 31.9% · Other 3.3%
- 2008→2024 swing
- -7.4pp toward R · 2008: 40.4pp · 2024: 32.9pp
- All cycles
- 2024: D+32.9 2020: D+44.2 2016: D+48.0 2012: D+40.0 2008: D+40.4
Not yet ingested
- Civics
- —
Market trends
- HPI YoY
- ▼ -636.62%
- Current HPI
- 477.6496
- Rent YoY
- ▼ -8.20%
- Metro
- Los Angeles-Long Beach-Anaheim, CA
- State GDP YoY
- ▲ 3.21%
- F500 in state
- 116
Industry mix (Fortune 500 HQ in CA)
| Industry | F500 HQs | Revenue |
|---|---|---|
| Technology | 27 | $1,492B |
|
||
| Financial Services | 3 | $174B |
|
||
| Retail | 3 | $44B |
|
||
| Insurance | 3 | $26B |
|
||
| Media / Entertainment | 2 | $115B |
|
||
| Pharmaceuticals / Biotech | 2 | $62B |
|
||
Price history
+2432.7% since first listed29 events — show timeline
- 2026-06-12 Coming Soon $759,800 CRMLS
- 2020-04-01 Delisted — TheMLS
- 2020-03-18 Listed — TheMLS
- 2017-07-27 Sold (Public Records) $635,000 Public Records
- 2017-07-27 Sold (MLS) $650,000 CRMLS
- 2017-07-27 Sold (MLS) $650,000 SDMLS
- 2017-06-16 Pending — CRMLS
- 2017-06-01 Listed $650,000 CRMLS
- 2017-05-31 Listed $650,000 SDMLS
- 2013-06-20 Sold (MLS) $296,500 TheMLS
- 2013-05-10 Pending — TheMLS
- 2013-05-04 Listed $242,400 TheMLS
- 2009-10-14 Delisted — CRMLS
- 2009-09-28 Price Changed $305,000 CRMLS
- 2009-05-29 Price Changed $239,000 CRMLS
- 2009-04-29 Price Changed $269,000 CRMLS
- 2009-04-06 Price Changed $289,000 CRMLS
- 2009-03-17 Listed $309,000 CRMLS
- 2008-12-22 Listing Removed — CRMLS
- 2008-12-17 Price Changed $329,000 CRMLS
- 2008-11-29 Price Changed $349,000 CRMLS
- 2008-11-19 Price Changed $394,000 CRMLS
- 2008-03-21 Listed $419,000 CRMLS
- 2008-03-12 Listing Removed — CRMLS
- 2007-06-11 Listed $619,000 CRMLS
- 2006-04-15 Sold (MLS) $550,000 CRMLS
- 2006-03-30 Sold (Public Records) $550,000 Public Records
- 2005-11-15 Listed $619,000 CRMLS
- 1979-04-13 Sold (Public Records) $30,000 Public Records
Property tax history
+1.4%/yrLatest (2025): $9,138 · +1.6% YoY. Source: county tax records.
Cash-flow waterfall
monthlySold comps — $/sqft
last 12 mo · ≤1 miLoading sold comps…