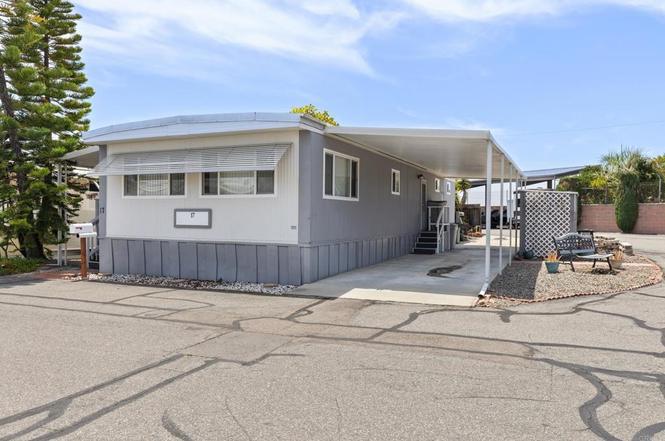
17 Blue Sky Ln · Oceanside, CA
Flood risk 1/10 · Minimal
- FEMA flood zone
- X (unshaded)
- Chance of flooding over 30 yrs
- 0.0%
- Est. flood insurance / yr
- $507 – $1,088
Fire risk 1/10 · Minimal
- Est. fire insurance / yr
- $659 – $1,223
Heat risk 5/10 · Moderate
- Hot days now (above 88°F)
- 7 days/yr
- Hot days in 30 yrs
- 21 days/yr
Wind risk 1/10 · Minimal
- Chance of severe wind over 30 yrs
- —
Air-quality risk 4/10 · Minor
- Unhealthy air days now
- 5 days/yr
- Unhealthy air days in 30 yrs
- 5 days/yr
Risk factors via First Street. Map © Google.
Why this score? — see what drove the B- grade
The composite is a weighted blend of 9 inputs, each scored 0–100. Each bar is that input's sub-score; the figure is the points it added to the 100-point composite (weight × sub-score).
- Cash flow +29.3/30.0
- DSCR +10.0/10.0
- 1% rule +8.2/10.0
- ARV discount +7.5/15.0
- Schools +4.0/10.0
- Rent growth +3.5/5.0
- Livability +3.2/5.0
- Condition / age +2.5/5.0
- Appreciation +0.0/10.0
$238,000
🖨 Deal sheet 📄 Offer letter ✓ Due diligence
Listing remarks MLS
PRIDE OF OWNERSHIP IN THIS VERY CLEAN AND CUTE COACH LOCATED IN THE RANCHO CALEVERO SENIOR PARK. HIGHLY SOUGHT AFTER 55 + COMMUNITY. EXCELLENT LOCATION: CLOSE TO SHOPPING, DOCTORS, HOSPITAL AND BEACH! COSTCO ONLY 1 MILE AWAY. NEWER CARPET AND UPGRADES THROUGHOUT. CALIFORNIA ROOM IS PERFECT OFFICE. NICE DECK IN BACK YARD WITH SEA BREEZES! SHOWS LIKE A MODEL! * * * SQ. FT. INCLUDES CALIF. ROOM-BUYER TO VERIFY. * * * . Neighborhoods: RANCHO CALEVERO Equipment: Dryer, Washer Other Fees: 0 Sewer: Sewer Connected Topography: LL
Key facts
- Private deck
- Enclosed front patio
- Spa
Tags
Property features AI
Finance
- Other: Lot size source: public records
- Financial info: Monthly land lease approximately $722
- HOA & community: Senior community; Land lease community with monthly land lease
Exterior
- Parking: Located in Rancho Calevero community
- Utilities: Public sewer
- Home design: Single-story mobile home; Mobile home remains; Mobile dimensions approximately 24 ft by 50 ft
- Exterior features: Private pool; Community pool; Corner lot; Sidewalks
Interior
- Bedrooms: Primary bedroom; Main floor bedroom
- Bathrooms: 2 full bathrooms
- Heating & cooling: Central cooling
- Interior features: One-level entry; One story
- Laundry & utility: Gas and electric dryer hookups; Laundry in unit
Neighborhood map
What this means for you Summary
Snapshot
- This is a 2-bed/2.0-bath timeshare listed at $238k.
Deal economics
- At list price, monthly cash flow is $840 ($10k/yr) — positive.
- The deal already cash-flows at list — no discount required.
- Meets the 1% rule at list price ($3k rent vs $238k).
- Cap rate 10.5% vs local median 2.5% in Oceanside — top-decile yield for the area; either an underpriced asset or a hidden risk that comps aren't pricing in. Stress-test before assuming the spread holds.
Location & tenants
- Location reads 64/100 on livability (#413 in CA) — a middle-class / working-renter tenant base. Strengths: amenities A+, commute A+, employment A; Watch: schools D+, crime D, cost of living F.
- Vista Unified (suburban): math 32% / reading 59% proficiency, ranked #175 of 517 in CA (top 34%) — families likely to look elsewhere, expect single-tenant / working-renter base with shorter leases.
- Market conditions: Rents rising fast (+4.1%/yr); 133 active listings in the ZIP; 22 comparable units currently listed for rent nearby; rentals at typical pace (median 18d on market — plan ~3-4 weeks tenant-placement turnaround); solid renter incomes; 11,759 units permitted in San Diego County in 2024 (7,244 in 5+ unit buildings).
- This rent runs 36% of the median local income ($106k/yr) — at the standard rent-burdened threshold; future hikes will face affordability resistance.
Forward outlook
- Local home prices are declining (-3.0%/yr); year-one equity from $2k of loan paydown is wiped out by about $7k of value loss. Plan a longer hold.
- San Diego County population projected at +20% by 2050 — long-run rental-demand tailwind backs the buy-and-hold thesis.
- At projected returns (-3.0% appreciation + 4.1% rent growth), your $67k cash investment doubles in ~8 years — after that, you're playing with house money.
Negotiation context
- Only 13 days on market — expect competitive offers; lowballing is unlikely to land.
- 5 sale attempts since 13y ago with the ask held roughly flat each time — persistent listings suggest the price (not the market) is what's stuck; bring a comps-based counter.
- Current owner paid $140k; list at $238k implies a 70% gain — meaningful room to come down on a strong offer.
Risks & watch-outs
- Climate carrying-cost: extreme-heat days projected 7→21/yr by 2055 (HVAC capex compounding) — expect insurance premiums to compound above CPI over the hold.
Questions for the listing agent
- Built in 1969 — when were the roof, HVAC, electrical panel, plumbing, and water heater last replaced?
- Is there a deadline driving the sale (1031 exchange, divorce, estate, relocation)? That informs how much negotiation room exists.
- Schools are D-rated, which usually means shorter tenancies and higher turnover. Who's the typical renter profile here, and what's been the actual vacancy rate?
- Crime grade is D in this area — have there been break-ins, vandalism, or insurance claims at this property in the last 3 years? What carrier currently insures it and at what premium?
- What's the average days-on-market for RENTAL listings here right now (not sales)? A rising rental-DOM trend means longer vacancies and softer asking-rent achievability than the comps imply.
- What's the recent tenant-quality profile in this submarket — average credit score on applications, eviction rate, late-payment / NSF rate, and stable-employment percentage? A property-management company in the area should have these aggregated.
- How much new for-sale + rental construction is in the pipeline within 1–3 miles? Heavy new supply typically softens prices + rents 12–24 months out; constrained supply supports both.
Investment metrics
- 1% rule
- 1.32% ✓
- Cap rate
- 10.53%
- Cash-on-cash
- 15.12%
- DSCR
- 1.67
- GRM
- 6.3
CMA / ARV
No comps found within radius.
Projected returns pro-forma
-3.0% appreciation · 4.07% rent growth · sell at horizon
- IRR
- 7.0%
- Equity multiple
- 1.28×
- Total profit
- $18,381
- Equity at exit
- $35,487
- IRR
- 17.2%
- Equity multiple
- 2.49×
- Total profit
- $99,410
- Equity at exit
- $20,578
Cash invested: $66,640 (down + closing). Projections, not guarantees.
Landlord ↔ Tenant lean methodology
- Overall (STATE)
- 18 Strongly Tenant-Friendly
- State California
- 18 Strongly Tenant-Friendly · D+13
- County
- — inherits STATE
- City
- — inherits STATE
ZIP-level market 92056
- Rents YoY
- 4.1%
- Active inventory
- 133
- Price-to-rent
- 6.3×
Monthly cashflow live
- Estimated rent
- $3,145 high interval (Pro) →
- Mortgage (P&I)
- −$1,248
- Tax est. 1.5%
- −$298 /mo · $3,570/yr
- Insurance
- −$99
- HOA
- −$0
- Vacancy / Maint / Mgmt
- −$660
- Net cashflow
- $840
Break-even live
UW: 25.0% down · 7.5% · 30yr · 1.5% tax · 5.0% vac · 8.0% maint · 8.0% mgmt
Financing live
Cash to close
- Down payment
- $59,500
- Closing costs
- $7,140
- Reserves months
- —
- Total cash needed
- —
Loan-product check · same deal, 3 products live
Conventional
25% down · 7.5% · 30yr
- Down + closing
- —
- Monthly P&I
- —
- Monthly cashflow
- —
- DSCR
- —
- Eligible?
- —
Personal DTI + credit; lowest rate.
DSCR
20% down · 8.5% · 30yr
- Down + closing
- —
- Monthly P&I
- —
- Monthly cashflow
- —
- DSCR
- —
- Eligible?
- —
No personal income docs; deal must DSCR.
Hard money
10% down · 12.0% · 12mo
- Down + closing
- —
- Monthly P&I
- —
- Monthly cashflow
- —
- DSCR
- —
- Eligible?
- —
Short-term bridge; refi at stabilization.
Rent comps 22 comps
| Address | Beds | Baths | Sqft | Rent | $/sqft | DOM | Units | Dist |
|---|---|---|---|---|---|---|---|---|
| 4463 Jasper Ln Oceanside, CA | 2.0 | 2.0 | 1436 | $3,495 | $2.43 | 43d | 1 | 0.15mi |
| 3407 Del Este Way Oceanside, CA | 3.0 | 2.0 | 1110 | $3,434 | $3.09 | 43d | 1 | 0.55mi |
| 3402 Los Mochis Way Oceanside, CA | 3.0 | 2.0 | 1101 | $3,250 | $2.95 | 43d | 1 | 0.58mi |
| 3465 Los Mochis Way Oceanside, CA | 2.0 | 1.5 | 1280 | $3,100 | $2.42 | 16d | 1 | 0.58mi |
| 3657 Harbor View Way Oceanside, CA | 3.0 | 1.5 | 1191 | $3,050 | $2.56 | 43d | 1 | 0.65mi |
| 3556 Thunder Dr Oceanside, CA | 2.0 | 1.0 | 820 | $2,775 | $3.38 | 2d | 1 | 0.68mi |
| 176 Cedar Rd Vista, CA | 1.0 | 1.0 | 710 | $2,100 | $2.96 | 43d | 2 | 0.70mi |
| 333 N Emerald Dr Vista, CA | 1.0–2.0 | 1.0–2.0 | 840 | $3,009 | $3.58 | 2d | 46 | 0.76mi |
| 1515 Date St Vista, CA | 2.0 | 2.0 | 881 | $2,795 | $3.17 | 3d | 1 | 0.85mi |
| 3964 Waring Rd Oceanside, CA | 1.0 | 1.0 | 825 | $2,325 | $2.82 | 20d | 1 | 0.97mi |
| 164 Santa Barbara Way Vista, CA | 3.0 | 2.0 | 1260 | $3,800 | $3.02 | 43d | 1 | 0.98mi |
| 315 Pomelo Dr Vista, CA | 2.0 | 1.0 | 858 | $2,400 | $2.80 | 2d | 1 | 1.02mi |
| 701 Breeze Hill Rd Vista, CA | 1.0–3.0 | 1.0–2.5 | 1013 | $3,478 | $3.43 | 2d | 1 | 1.25mi |
| 710 Breeze Hill Rd Vista, CA | 1.0–2.0 | 1.0–2.0 | 879 | $3,140 | $3.57 | 5d | 5 | 1.26mi |
| 3675 Barnard Dr Oceanside, CA | 1.0–2.0 | 1.0–2.0 | 915 | $2,895 | $3.16 | 16d | 4 | 1.32mi |
| 3675 Barnard Dr Oceanside, CA | 1.0–2.0 | 1.0–2.0 | 915 | $2,895 | $3.16 | 24d | 3 | 1.34mi |
| 3675 Barnard Dr Oceanside, CA | 2.0 | 2.0 | 1015 | $2,845 | $2.80 | 18d | 3 | 1.34mi |
| 3675 Barnard Dr Oceanside, CA | 1.0–2.0 | 1.0–2.0 | 915 | $2,895 | $3.16 | 5d | 7 | 1.34mi |
| 4717 Majorca Way Oceanside, CA | 2.0 | 2.0 | 1444 | $6,300 | $4.36 | 1d | 1 | 1.40mi |
| 2825 College Blvd Oceanside, CA | 3.0 | 2.0 | 1140 | $3,100 | $2.72 | 43d | 1 | 1.43mi |
| 754 Copper Dr Unit 756 Vista, CA | 2.0 | 2.5 | 1150 | $2,950 | $2.57 | 24d | 1 | 1.46mi |
| 3661 Harvard Dr Oceanside, CA | 3.0 | 2.5 | 1353 | $3,295 | $2.44 | 14d | 1 | 1.47mi |
Listing history 10 events
-
2026-06-18days on market $238,000 Active 13 DOM
-
2026-06-17days on market $238,000 Active 12 DOM
-
2026-06-16days on market $238,000 Active 11 DOM
-
2026-06-15days on market $238,000 Active 10 DOM
-
2026-06-13days on market $238,000 Active 8 DOM
-
2026-06-13days on market $238,000 Active 7 DOM
-
2026-06-09days on market $238,000 Active 4 DOM
-
2026-06-08days on market $238,000 Active 3 DOM
-
2026-06-07remarks 699-char remark
-
2026-06-07$238,000 Active 2 DOM
ⓘ Source: listings_history table (triggers on properties + properties_extension) + one-shot
backfill from property_details.listing_events for pre-trigger history.
Climate risk First Street
- Flood 1/10 Low FEMA zone X (unshaded) · 0% chance over 30 yrs
- Wildfire 1/10 Low
- Heat 5/10 Major 7 d/yr ≥88°F today · 21 d/yr by 30 yrs out
- Wind 1/10 Low
- Air quality 4/10 Moderate 5 unhealthy d/yr today · 5 by 30 yrs out
Nearby sold comps map
Loading sold comps map…
Walkable amenities ~0.75 mi
Loading nearby amenities…
Taxation est. · year 1
- Rental income
- $37,738
- − Mortgage interest
- −$13,332
- − Property taxes
- −$3,570
- − Insurance
- −$1,190
- − Repairs & maintenance
- −$3,019
- − Management
- −$3,019
- − Depreciation
- −$6,924
- Taxable income
- $6,685
- Est. tax owed @ 24.0%
- −$1,604
- After-tax cash flow
- $8,472/yr
For passive investors: Depreciation is non-cash, so a rental often shows a tax loss while cash-flowing — sheltering income. Rental losses are passive: they offset passive income freely, and up to $25,000/yr can offset ordinary (W-2) income if you actively participate and your MAGI is under $100k (phasing out to $0 by $150k); unused losses carry forward. On sale, claimed depreciation is recaptured at up to 25%, and gains may owe capital-gains tax (a 1031 exchange can defer both). Figures are a year-1 estimate at your 24.0% rate — not tax advice; consult a CPA.
Schools (NCES district)
- District
- Vista Unified
- NCES district ID
- 0641190
- Math proficiency
- 32% ▼ -5.00%
- Reading proficiency
- 59% ▲ 9.00%
- Median HH income
- $60,067
- Composite
- 39.91/100
- National rank
- #3850
- State rank
- #175 of 517 in CA
Livability — Oceanside
- Score
- 64/100
- State rank
- #413
- US rank
- #14081
Category grades
Schools grade is shown separately in the Schools card above.
Census & demographics
- Census place
- Oceanside, CA
- County
- San Diego County · 3,178,799 people
- City population
- 198,702
- Metro
- San Diego-Chula Vista-Carlsbad, CA
- Population (ZIP)
- 53,616
- Household income
- $106,272
- Rent vs Own
- Severe rent burden
- 1741.0
Population outlook (San Diego County) Hauer SSP2
- Today (2025)
- 3,678,185 people
- By 2030
- 3,856,546 · +4.8%
- By 2040
- 4,171,407 · +13.4%
- By 2050
- 4,421,607 · +20.2%
- By 2075
- 4,831,599 · +31.4%
- By 2100
- 4,832,502 · +31.4%
Race, ethnicity, and origin ACS 2023
- Neighborhood character
- Diverse neighborhood (Simpson 0.65)
- Race & ethnicity
- White 50% Hispanic / Latino 31% Two or more races 20% Asian 8% Black 2% Native American 1%
- Hispanic origin (detail)
- Mexican 25%
- Common ancestry
- Romanian 2% Lithuanian 2% Italian 2%
- Foreign-born
- 18% · Canada, China, Vietnam
- Languages at home
- 72% English-only · Spanish 18% Tagalog/Filipino 2% Other Asian/Pacific 2%
Political lean MEDSL · San Diego
- 2024 margin
- D (+16.8) · D 56.9% · R 40.1% · Other 2.9%
- 2008→2024 swing
- +6.6pp toward D · 2008: 10.2pp · 2024: 16.8pp
- All cycles
- 2024: D+16.8 2020: D+22.8 2016: D+17.8 2012: D+5.1 2008: D+10.2
Not yet ingested
- Civics
- —
Market trends
- HPI YoY
- ▼ -547.84%
- Current HPI
- 383.2036
- Rent YoY
- ▲ 4.07%
- Metro
- San Diego-Chula Vista-Carlsbad, CA
- State GDP YoY
- ▲ 3.21%
- F500 in state
- 116
Industry mix (Fortune 500 HQ in CA)
| Industry | F500 HQs | Revenue |
|---|---|---|
| Technology | 27 | $1,492B |
|
||
| Financial Services | 3 | $174B |
|
||
| Retail | 3 | $44B |
|
||
| Insurance | 3 | $26B |
|
||
| Media / Entertainment | 2 | $115B |
|
||
| Pharmaceuticals / Biotech | 2 | $62B |
|
||
Price history
+468.0% since first listed12 events — show timeline
- 2026-06-04 Listed $238,000 CRMLS
- 2025-10-14 Listing Removed — SDMLS
- 2025-09-27 Listed $238,000 SDMLS
- 2020-08-19 Sold (MLS) $140,000 SDMLS
- 2020-08-19 Sold (MLS) $140,000 CRMLS
- 2020-07-31 Pending — CRMLS
- 2020-07-31 Pending — SDMLS
- 2020-07-09 Listed $153,900 SDMLS
- 2020-07-09 Listed $153,900 CRMLS
- 2013-06-14 Sold (MLS) $41,000 SDMLS
- 2013-05-15 Pending — SDMLS
- 2013-04-23 Listed $41,900 SDMLS
Cash-flow waterfall
monthlySold comps — $/sqft
last 12 mo · ≤1 miLoading sold comps…