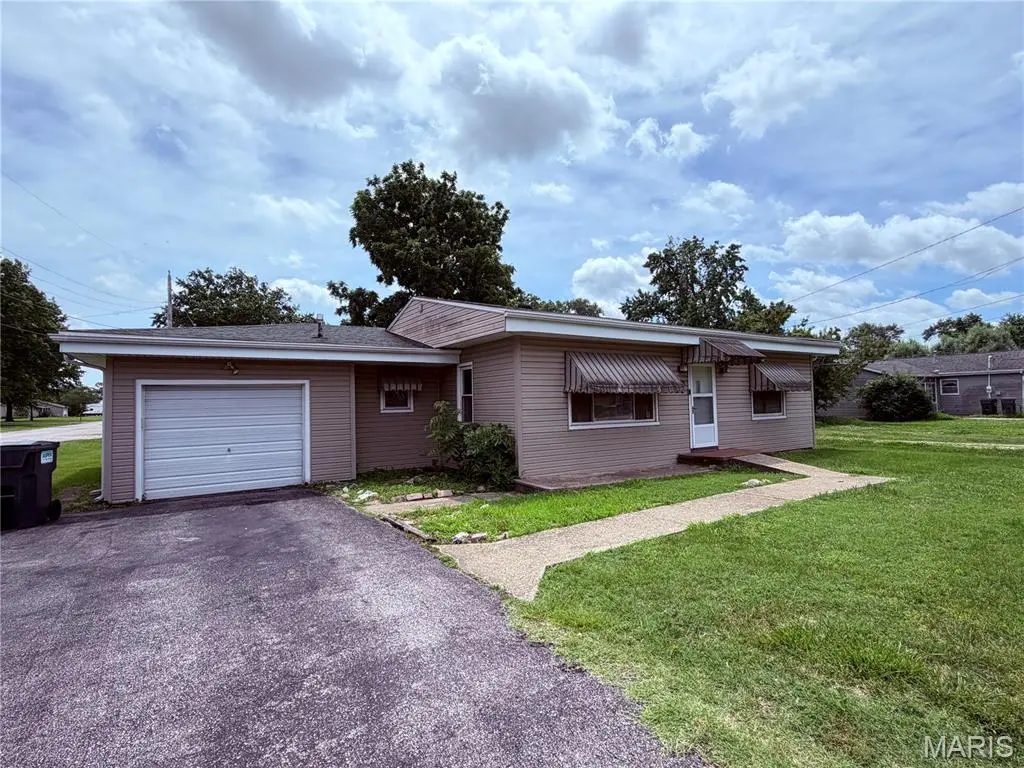
2640 Logan St · Granite City, IL
Flood risk 1/10 · Minimal
- FEMA flood zone
- X
- Chance of flooding over 30 yrs
- 0.0%
- Est. flood insurance / yr
- $507 – $1,088
Fire risk 1/10 · Minimal
- Est. fire insurance / yr
- $804 – $1,492
Heat risk 5/10 · Moderate
- Hot days now (above 108°F)
- 7 days/yr
- Hot days in 30 yrs
- 20 days/yr
Wind risk 2/10 · Minimal
- Chance of severe wind over 30 yrs
- 1.0%
Air-quality risk 4/10 · Minor
- Unhealthy air days now
- 5 days/yr
- Unhealthy air days in 30 yrs
- 6 days/yr
Risk factors via First Street. Map © Google.
Why this score? — see what drove the B grade
The composite is a weighted blend of 9 inputs, each scored 0–100. Each bar is that input's sub-score; the figure is the points it added to the 100-point composite (weight × sub-score).
- Cash flow +30.0/30.0
- ARV discount +14.7/15.0
- 1% rule +10.0/10.0
- DSCR +10.0/10.0
- Livability +3.2/5.0
- Rent growth +2.9/5.0
- Condition / age +2.5/5.0
- Schools +0.9/10.0
- Appreciation +0.0/10.0
$59,900
🖨 Deal sheet 📄 Offer letter ✓ Due diligence
Listing remarks
Opportunity awaits with this 2-bedroom home located in a quiet area outside the city limits! Featuring beautiful hardwood floors in both bedrooms and the spacious living room, this home offers a solid foundation with plenty of potential. The kitchen provides an abundance of cabinet space and opens to a large family room, creating an ideal layout for everyday living and entertaining. Additional features include a full bathroom, convenient main-floor laundry room, attached one-car garage, and extra tandem driveway parking. Situated on a nice-sized lot, the backyard is almost completely fenced, offering space for pets, play, or outdoor enjoyment. This property needs some fresh paint, and cosme
Key facts
- Large family room
- Nice-sized lot
- Hardwood floors
Tags
Property features AI
Finance
- Other: Corner, level lot
- Financial info: Lease not considered
Exterior
- Parking: Attached garage (tandem, 1 garage space); Additional off-street parking; Asphalt driveway
- Utilities: Public water; Public sewer; Electric service by Ameren; Electricity connected; Sewer connected
- Home design: Single family residence; Residential property; One story
- Construction: Vinyl siding; Concrete crawl space basement
- Exterior features: Covered porch; Chain link fenced backyard; Shed(s)
Interior
- Kitchen: Range; Range hood
- Bedrooms: 2 bedrooms (both on the main level)
- Flooring: Hardwood; Laminate; Linoleum
- Bathrooms: 1 full bathroom (main level)
- Heating & cooling: Forced air heating; Central air; Ceiling fan(s)
- Interior features: Ceiling fan(s)
- Laundry & utility: Main level laundry
Neighborhood map
What this means for you Summary
Snapshot
- This is a 2-bed/1.0-bath single-family listed at $60k.
Deal economics
- At list price, monthly cash flow is $494 ($6k/yr) — positive.
- The deal already cash-flows at list — no discount required.
- Meets the 1% rule at list price ($1k rent vs $60k).
- Cap rate 16.2% vs local median 7.0% in Granite City — top-decile yield for the area; either an underpriced asset or a hidden risk that comps aren't pricing in. Stress-test before assuming the spread holds.
Location & tenants
- Location reads 65/100 on livability (#623 in IL) — a middle-class / working-renter tenant base. Strengths: cost of living A+, housing A+; Watch: crime F, amenities F, commute F.
- Granite City CUSD 9 (suburban): math 9% / reading 11% proficiency, ranked #570 of 620 in IL (top 92%) — low school quality limits family demand, transient renter base, plan for 1-2y turnover.
- Zoned schools: Granite City High School (math 10% / reading 12%, grade F, #522 of 693 statewide, top 76%, 1,805 students, 0% FRL) — zoned schools average 0% FRL vs 59% district-wide (59 pts lower); this property's tenant base skews higher-income than the district average.
- Market conditions: Rents rising (+1.7%/yr); 194 active listings in the ZIP; 7 comparable units currently listed for rent nearby; rentals at typical pace (median 15d on market — plan ~3-4 weeks tenant-placement turnaround); 336 units permitted in Madison County in 2024 (0 in 5+ unit buildings).
Forward outlook
- Local home prices are declining (-3.0%/yr); year-one equity from $414 of loan paydown is wiped out by about $2k of value loss. Plan a longer hold.
- Madison County population projected at -18% by 2050 — secular population decline; favor cash flow + early exit over multi-decade hold.
- At projected returns (-3.0% appreciation + 1.7% rent growth), your $17k cash investment doubles in ~4 years — after that, you're playing with house money.
Negotiation context
- Only 2 days on market — expect competitive offers; lowballing is unlikely to land.
Risks & watch-outs
- Watch-outs: built in 1952 — expect roof / HVAC / electrical / plumbing capex.
- Climate carrying-cost: extreme-heat days projected 7→20/yr by 2055 (HVAC capex compounding) — expect insurance premiums to compound above CPI over the hold.
Questions for the listing agent
- Built in 1952 — when were the roof, HVAC, electrical panel, plumbing, and water heater last replaced?
- Is there a deadline driving the sale (1031 exchange, divorce, estate, relocation)? That informs how much negotiation room exists.
- Schools are F-rated, which usually means shorter tenancies and higher turnover. Who's the typical renter profile here, and what's been the actual vacancy rate?
- Crime grade is F in this area — have there been break-ins, vandalism, or insurance claims at this property in the last 3 years? What carrier currently insures it and at what premium?
- What's the average days-on-market for RENTAL listings here right now (not sales)? A rising rental-DOM trend means longer vacancies and softer asking-rent achievability than the comps imply.
- What's the recent tenant-quality profile in this submarket — average credit score on applications, eviction rate, late-payment / NSF rate, and stable-employment percentage? A property-management company in the area should have these aggregated.
- How much new for-sale + rental construction is in the pipeline within 1–3 miles? Heavy new supply typically softens prices + rents 12–24 months out; constrained supply supports both.
Investment metrics
- 1% rule
- 1.87% ✓
- Cap rate
- 16.20%
- Cash-on-cash
- 35.38%
- DSCR
- 2.57
- GRM
- 4.5
CMA / ARV
- ARV (on-the-fly)
- $71,390
- Comps found
- 12
Show comp detail 12 sales within ~0.75 mi
| Address | Dist | Beds/Ba | Sqft | Sold | Price | $/sf | Match |
|---|---|---|---|---|---|---|---|
| 2442 Dewey Ave | 0.33mi | 2/1.0 | 1,111 (-8%) | 9mo | $65,000 | $59 | 63 |
| 2202 Missouri Ave | 0.54mi | 3/2.0 (+1) | 1,276 (+6%) | 2mo | $120,000 | $94 | 55 |
| 906 24th St | 0.64mi | 3/1.0 (+1) | 1,152 (-5%) | 4mo | $82,000 | $71 | 53 |
| 2305 W 24th St | 0.44mi | 1/1.0 (-1) | 1,064 (-12%) | 6mo | $19,000 | $18 | 50 |
| 2235 Dewey Ave | 0.50mi | 3/1.0 (+1) | 1,064 (-12%) | 6mo | $25,000 | $23 | 47 |
| 2031 Illinois Ave | 0.70mi | 3/1.0 (+1) | 1,155 (-4%) | 11mo | $85,500 | $74 | 46 |
| 2544 Adams St | 0.73mi | 2/2.0 | 1,080 (-11%) | 3mo | $135,000 | $125 | 42 |
| 2113 Illinois Ave | 0.64mi | 2/2.0 | 1,272 (+5%) | 20mo | $35,000 | $28 | 41 |
| 2128 Dewey Ave | 0.61mi | 3/1.0 (+1) | 1,064 (-12%) | 7mo | $10,000 | $9 | 40 |
| 719 27th Pl | 0.51mi | 2/2.0 | 1,120 (-7%) | 24mo | $29,900 | $27 | 40 |
| 2520 Adams St | 0.71mi | 2/1.0 | 1,080 (-11%) | 22mo | $104,900 | $97 | 31 |
| 2620 Center St | 0.72mi | 3/1.0 (+1) | 1,064 (-12%) | 17mo | $60,000 | $56 | 27 |
Match score weights: distance 35% · size 25% · config 20% · recency 20%. Top-matched comps best support the ARV.
Projected returns pro-forma
-3.0% appreciation · 1.67% rent growth · sell at horizon
- IRR
- 29.5%
- Equity multiple
- 2.21×
- Total profit
- $20,312
- Equity at exit
- $8,931
- IRR
- 36.1%
- Equity multiple
- 4.12×
- Total profit
- $52,347
- Equity at exit
- $5,179
Cash invested: $16,772 (down + closing). Projections, not guarantees.
Landlord ↔ Tenant lean methodology
- Overall (STATE)
- 43 Moderately Tenant-Leaning
- State Illinois
- 43 Moderately Tenant-Leaning · D+7
- County
- — inherits STATE
- City
- — inherits STATE
ZIP-level market 62040
- Home prices YoY
- -21.8%
- Rents YoY
- 1.7%
- Active inventory
- 194
- Price-to-rent
- 4.5×
Monthly cashflow live
- Estimated rent
- $1,118 high interval (Pro) →
- Mortgage (P&I)
- −$314
- Tax from tax record
- −$50 /mo · $599/yr
- Insurance
- −$25
- HOA
- −$0
- Vacancy / Maint / Mgmt
- −$235
- Net cashflow
- $494
Break-even live
UW: 25.0% down · 7.5% · 30yr · 1.5% tax · 5.0% vac · 8.0% maint · 8.0% mgmt
Financing live
Cash to close
- Down payment
- $14,975
- Closing costs
- $1,797
- Reserves months
- —
- Total cash needed
- —
Loan-product check · same deal, 3 products live
Conventional
25% down · 7.5% · 30yr
- Down + closing
- —
- Monthly P&I
- —
- Monthly cashflow
- —
- DSCR
- —
- Eligible?
- —
Personal DTI + credit; lowest rate.
DSCR
20% down · 8.5% · 30yr
- Down + closing
- —
- Monthly P&I
- —
- Monthly cashflow
- —
- DSCR
- —
- Eligible?
- —
No personal income docs; deal must DSCR.
Hard money
10% down · 12.0% · 12mo
- Down + closing
- —
- Monthly P&I
- —
- Monthly cashflow
- —
- DSCR
- —
- Eligible?
- —
Short-term bridge; refi at stabilization.
Rent comps 7 comps
| Address | Beds | Baths | Sqft | Rent | $/sqft | DOM | Units | Dist |
|---|---|---|---|---|---|---|---|---|
| 2556 Center St Granite City, IL | 3.0 | 1.0 | 874 | $1,500 | $1.72 | 14d | 1 | 0.71mi |
| 2715 Center St Unit B Granite City, IL | 2.0 | 1.0 | 930 | $1,275 | $1.37 | 43d | 1 | 0.81mi |
| 2450 Cleveland Blvd Apt A Granite City, IL | 2.0 | 1.0 | 846 | $825 | $0.98 | 17d | 1 | 0.85mi |
| 2317 Grand Ave Granite City, IL | 2.0 | 1.0 | 1124 | $750 | $0.67 | 7d | 1 | 1.07mi |
| 303 Wilson Park Ln Granite City, IL | 3.0 | 1.0 | 900 | $1,200 | $1.33 | 7d | 1 | 1.16mi |
| 2415 Jerden Ave Granite City, IL | 3.0 | 1.0 | 970 | $1,400 | $1.44 | 4d | 1 | 1.35mi |
| 1709 Edison Ave Unit 1709 Granite City, IL | 1.0 | 1.0 | 700 | $800 | $1.14 | 14d | 1 | 1.37mi |
Listing history 4 events
-
2026-06-15status $59,900 Pending 2 DOM
-
2026-06-13days on market $59,900 Active 2 DOM
-
2026-06-13remarks 699-char remark
-
2026-06-13$59,900 Active 1 DOM
ⓘ Source: listings_history table (triggers on properties + properties_extension) + one-shot
backfill from property_details.listing_events for pre-trigger history.
Tax reassessment forecast IL · Partial reset (capped growth)
- Current annual tax
- $599 · $50/mo
- Projected year-2 tax
- $979 · $82/mo
- Expected delta
- +$380/yr (+$32/mo · 63.5%)
ⓘ Screening estimate from a state-policy table — verify with the county assessor before closing.
Climate risk First Street
- Flood 1/10 Low FEMA zone X · 0% chance over 30 yrs
- Wildfire 1/10 Low
- Heat 5/10 Major 7 d/yr ≥108°F today · 20 d/yr by 30 yrs out
- Wind 2/10 Low 100% chance of damaging wind over 30 yrs
- Air quality 4/10 Moderate 5 unhealthy d/yr today · 6 by 30 yrs out
Nearby sold comps map
Loading sold comps map…
Walkable amenities ~0.75 mi
Loading nearby amenities…
Taxation est. · year 1
- Rental income
- $13,420
- − Mortgage interest
- −$3,355
- − Property taxes
- −$599
- − Insurance
- −$300
- − Repairs & maintenance
- −$1,074
- − Management
- −$1,074
- − Depreciation
- −$1,743
- Taxable income
- $5,276
- Est. tax owed @ 24.0%
- −$1,266
- After-tax cash flow
- $4,668/yr
For passive investors: Depreciation is non-cash, so a rental often shows a tax loss while cash-flowing — sheltering income. Rental losses are passive: they offset passive income freely, and up to $25,000/yr can offset ordinary (W-2) income if you actively participate and your MAGI is under $100k (phasing out to $0 by $150k); unused losses carry forward. On sale, claimed depreciation is recaptured at up to 25%, and gains may owe capital-gains tax (a 1031 exchange can defer both). Figures are a year-1 estimate at your 24.0% rate — not tax advice; consult a CPA.
Schools (NCES district)
- District
- Granite City CUSD 9
- NCES district ID
- 1717280
- Math proficiency
- 9% ▼ -4.00%
- Reading proficiency
- 11% ▼ -7.00%
- Median HH income
- $45,082
- Composite
- 9.15/100
- National rank
- #9864
- State rank
- #570 of 620 in IL
Livability — Granite City
- Score
- 65/100
- State rank
- #623
- US rank
- #12751
Category grades
Schools grade is shown separately in the Schools card above.
Census & demographics
- County
- Madison County · 189,064 people
- City population
- 40,404
- Metro
- St. Louis, MO-IL
- Population (ZIP)
- 40,404
- Household income
- $60,031
- Rent vs Own
- Severe rent burden
- 923.0
Population outlook (Madison County) Hauer SSP2
- Today (2025)
- 258,371 people
- By 2030
- 251,523 · -2.7%
- By 2040
- 233,640 · -9.6%
- By 2050
- 213,042 · -17.5%
- By 2075
- 165,255 · -36.0%
- By 2100
- 123,953 · -52.0%
Race, ethnicity, and origin ACS 2023
- Neighborhood character
- Predominantly White (76%)
- Race & ethnicity
- White 76% Hispanic / Latino 9% Black 9% Two or more races 7% Asian 1%
- Hispanic origin (detail)
- Mexican 7%
- Common ancestry
- Romanian 2% Lithuanian 2% Serbian 2%
- Foreign-born
- 3% · Canada, Vietnam
- Languages at home
- 93% English-only · Spanish 5%
Political lean MEDSL · Madison
- 2024 margin
- R (+13.3) · D 42.5% · R 55.8% · Other 1.8%
- 2008→2024 swing
- -22.5pp toward R · 2008: 9.2pp · 2024: -13.3pp
- All cycles
- 2024: R+13.3 2020: R+13.2 2016: R+15.6 2012: R+1.4 2008: D+9.2
Not yet ingested
- Civics
- —
Market trends
- HPI YoY
- ▼ -56.88%
- Current HPI
- 204.4612
- Rent YoY
- ▲ 1.67%
- Metro
- St. Louis, MO-IL
- State GDP YoY
- ▲ 1.59%
- F500 in state
- 60
Industry mix (Fortune 500 HQ in IL)
| Industry | F500 HQs | Revenue |
|---|---|---|
| Insurance | 4 | $201B |
|
||
| Consumer Goods | 4 | $87B |
|
||
| Industrial Machinery | 3 | $64B |
|
||
| Healthcare | 2 | $55B |
|
||
| Retail / Pharmacy | 1 | $148B |
|
||
| Agriculture / Food | 1 | $86B |
|
||
Price history
1 event — show timeline
- 2026-06-11 Listed $59,900 MARIS as Distributed by MLS Grid
Property tax history
+1.3%/yrLatest (2024): $599 · +15.8% YoY. Source: county tax records.
Cash-flow waterfall
monthlySold comps — $/sqft
last 12 mo · ≤1 miLoading sold comps…